Statistics and Research Methods for Business Decision Making
Added on 2022-12-15
11 Pages2612 Words315 Views
Statistics and Research Methods for Business Decision
Making
1
Making
1
Question 1: Australian Exports
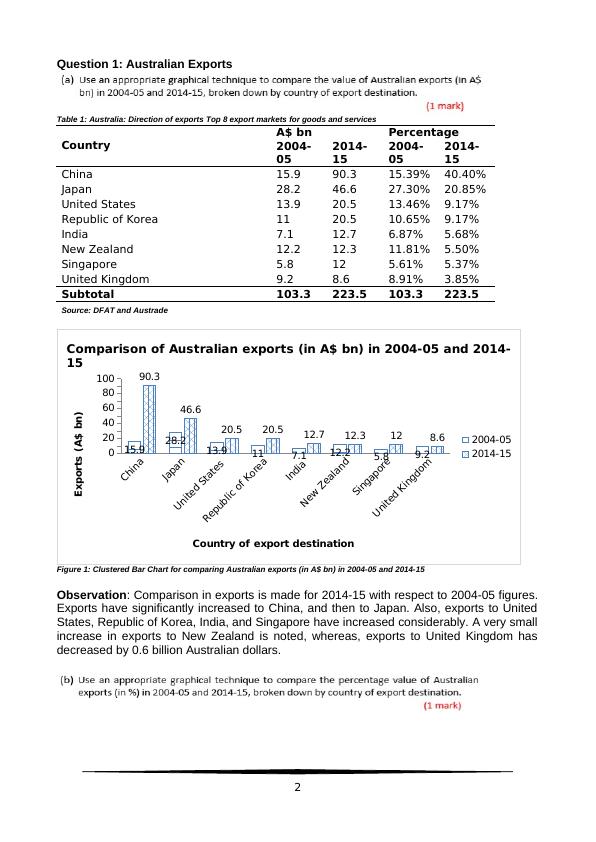
Table 1: Australia: Direction of exports Top 8 export markets for goods and services
Country
A$ bn Percentage
2004-
05
2014-
15
2004-
05
2014-
15
China 15.9 90.3 15.39% 40.40%
Japan 28.2 46.6 27.30% 20.85%
United States 13.9 20.5 13.46% 9.17%
Republic of Korea 11 20.5 10.65% 9.17%
India 7.1 12.7 6.87% 5.68%
New Zealand 12.2 12.3 11.81% 5.50%
Singapore 5.8 12 5.61% 5.37%
United Kingdom 9.2 8.6 8.91% 3.85%
Subtotal 103.3 223.5 103.3 223.5
Source: DFAT and Austrade
China
Japan
United States
Republic of Korea
India
New Zealand
Singapore
United Kingdom
0
20
40
60
80
100
15.9 28.2
13.9 11 7.1 12.2 5.8 9.2
90.3
46.6
20.5 20.5 12.7 12.3 12 8.6
Comparison of Australian exports (in A$ bn) in 2004-05 and 2014-
15
2004-05
2014-15
Country of export destination
Exports (A$ bn)
Figure 1: Clustered Bar Chart for comparing Australian exports (in A$ bn) in 2004-05 and 2014-15
Observation: Comparison in exports is made for 2014-15 with respect to 2004-05 figures.
Exports have significantly increased to China, and then to Japan. Also, exports to United
States, Republic of Korea, India, and Singapore have increased considerably. A very small
increase in exports to New Zealand is noted, whereas, exports to United Kingdom has
decreased by 0.6 billion Australian dollars.
2
China
Japan
United States
Republic of Korea
India
New Zealand
Singapore
United Kingdom
0.00%
10.00%
20.00%
30.00%
40.00%
15.39%
27.30%
13.46% 10.65% 6.87% 11.81% 5.61% 8.91%
40.40%
20.85%
9.17% 9.17% 5.68% 5.50% 5.37% 3.85%
Comparison of Australian exports (in A$ bn) in 2004-05 and 2014-15
2004-05
2014-15
Country of export destination
Percentage
Figure 2: Clustered Bar Chart for comparing percentage of Australian
Exports (in A$ bn) in 2004-05 and 2014-15
Observation: Comparison in percentage exports is made for 2014-15 with respect to
2004-05 figures. Interestingly, exports have increased by 25.01% to China, and the impact
is felt on the entire scenario. Exports have decreased by 6.45% to Japan. Also, exports to
United States, Republic of Korea, India, and Singapore have decreased respectively by
4.29%, 1.48%, 1.19%, and 0.24%. A heavy decrease in exports to New Zealand by 6.31%
is noted, and exports to United Kingdom have also decreased by 5.06% ( Hopkins, 2017,
pp.1-4).
Total export in 2004-2005 was 103.3 billion Australian dollars, which increased to 223.5
billion Australian dollars in 2014-15. Export volume in Australian dollars has considerably
increased in 2014-15 compared to 2004-05. From part A, it can be noted that export to
almost all the countries have increased in volume (except United Kingdom). Interestingly,
comparison in export percentages revealed that export to China has grown at a rapid rate,
whereas, percentage export to rest of the countries have decreased. This indicates that
Australian trade is favouring China compared to other countries for their export, which
eventually has a retarding impact on growth of export to other countries (Bluman, 2009).
Question 2: Umbrella sales
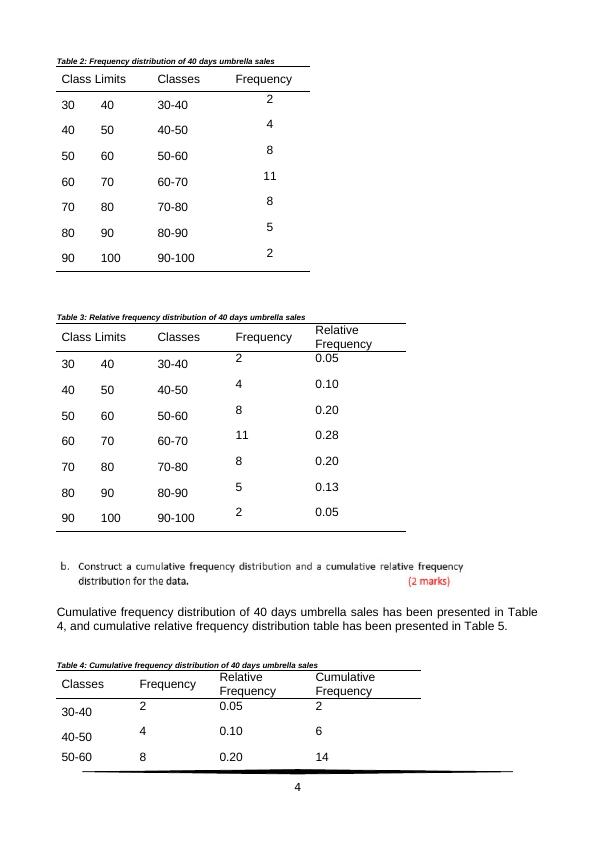
Frequency distribution of 40 days umbrella sales has been presented in Table 2, and
relative frequency distribution table has been presented in Table 3. Class limits, along with
classes and frequencies, have been included in both the tables.
3
Japan
United States
Republic of Korea
India
New Zealand
Singapore
United Kingdom
0.00%
10.00%
20.00%
30.00%
40.00%
15.39%
27.30%
13.46% 10.65% 6.87% 11.81% 5.61% 8.91%
40.40%
20.85%
9.17% 9.17% 5.68% 5.50% 5.37% 3.85%
Comparison of Australian exports (in A$ bn) in 2004-05 and 2014-15
2004-05
2014-15
Country of export destination
Percentage
Figure 2: Clustered Bar Chart for comparing percentage of Australian
Exports (in A$ bn) in 2004-05 and 2014-15
Observation: Comparison in percentage exports is made for 2014-15 with respect to
2004-05 figures. Interestingly, exports have increased by 25.01% to China, and the impact
is felt on the entire scenario. Exports have decreased by 6.45% to Japan. Also, exports to
United States, Republic of Korea, India, and Singapore have decreased respectively by
4.29%, 1.48%, 1.19%, and 0.24%. A heavy decrease in exports to New Zealand by 6.31%
is noted, and exports to United Kingdom have also decreased by 5.06% ( Hopkins, 2017,
pp.1-4).
Total export in 2004-2005 was 103.3 billion Australian dollars, which increased to 223.5
billion Australian dollars in 2014-15. Export volume in Australian dollars has considerably
increased in 2014-15 compared to 2004-05. From part A, it can be noted that export to
almost all the countries have increased in volume (except United Kingdom). Interestingly,
comparison in export percentages revealed that export to China has grown at a rapid rate,
whereas, percentage export to rest of the countries have decreased. This indicates that
Australian trade is favouring China compared to other countries for their export, which
eventually has a retarding impact on growth of export to other countries (Bluman, 2009).
Question 2: Umbrella sales
Frequency distribution of 40 days umbrella sales has been presented in Table 2, and
relative frequency distribution table has been presented in Table 3. Class limits, along with
classes and frequencies, have been included in both the tables.
3
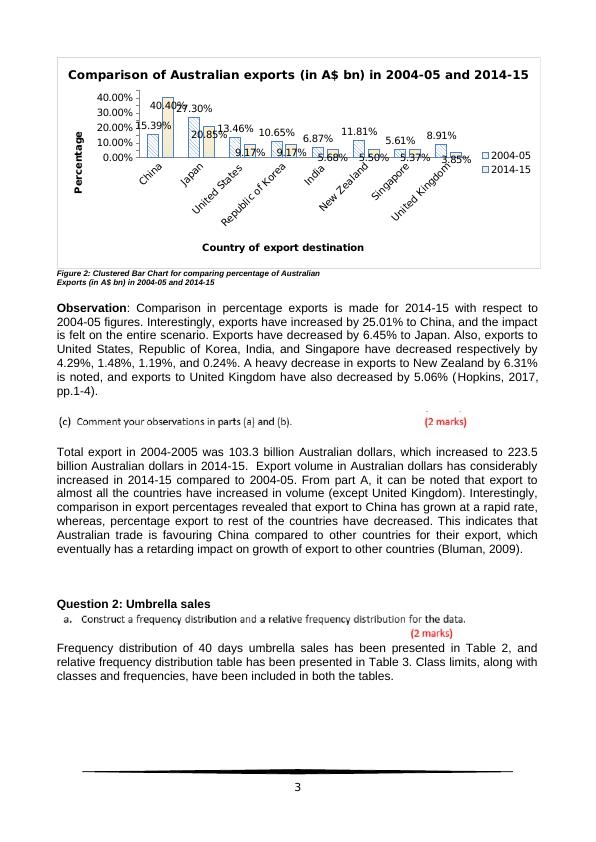
Table 2: Frequency distribution of 40 days umbrella sales
Class Limits Classes Frequency
30 40 30-40 2
40 50 40-50 4
50 60 50-60 8
60 70 60-70 11
70 80 70-80 8
80 90 80-90 5
90 100 90-100 2
Table 3: Relative frequency distribution of 40 days umbrella sales
Class Limits Classes Frequency Relative
Frequency
30 40 30-40 2 0.05
40 50 40-50 4 0.10
50 60 50-60 8 0.20
60 70 60-70 11 0.28
70 80 70-80 8 0.20
80 90 80-90 5 0.13
90 100 90-100 2 0.05
Cumulative frequency distribution of 40 days umbrella sales has been presented in Table
4, and cumulative relative frequency distribution table has been presented in Table 5.
Table 4: Cumulative frequency distribution of 40 days umbrella sales
Classes Frequency Relative
Frequency
Cumulative
Frequency
30-40 2 0.05 2
40-50 4 0.10 6
50-60 8 0.20 14
4
End of preview
Want to access all the pages? Upload your documents or become a member.
Related Documents
Statistics for Business Decisions PDFlg...
|20
|3185
|81
Australia: Direction of Exports | Assignmentlg...
|12
|1638
|132
Statistics for Business Decisions Assignmentlg...
|15
|1897
|239
Statistics and Research Methods for Business Decision Making PDFlg...
|15
|3027
|44
Methods for Business Decision Makinglg...
|11
|2087
|81
Business Decision Making using Statistical Toolslg...
|11
|1928
|2