Statistics for Business Decisions PDF
Added on 2021-02-19
20 Pages3185 Words81 Views
STATISTICS FORBUSINESS DECISIONSAND RESEARCH
Table of ContentsQUESTION 1 ..................................................................................................................................1a) Comparing the values of Exports for two time-periods..........................................................1b) Comparing the percentages value of exports for two time-periods........................................2c) Interpreting the Results...........................................................................................................2QUESTION 2 ..................................................................................................................................3a) Constructing a Frequency and Relative Frequency Distribution............................................3b. Constructing a Cumulative Frequency and Cumulative Relative Frequency Distribution.....4c. Plotting a Relative Frequency Histogram for the given data..................................................5d. Constructing an Ogive from given data..................................................................................5e. Proportion of grades less than 60............................................................................................6f. Proportion of grades more than 70..........................................................................................7QUESTION 3...................................................................................................................................9a. Defining Variables through a graphical descriptive measure.................................................9b. Graphical Representation of Relationship between two variables..........................................9c. Creating a Summary Report for the data provided................................................................10d. Coefficient of Correlation (r)................................................................................................12e. Estimating a simple linear regression model, estimated linear equation and coefficients forthe two variables.......................................................................................................................12f. Interpreting Coefficient of Determination (r2)......................................................................15g. Testing whether FINAL CONSUMPTION EXPENDITURE positively and significantlyincreases withRETAIL TURNOVER PER CAPITA at the 5% significance level........................................16h. Ascertaining the value of the standard error of the estimate (Se )........................................17REFERENCES..............................................................................................................................18
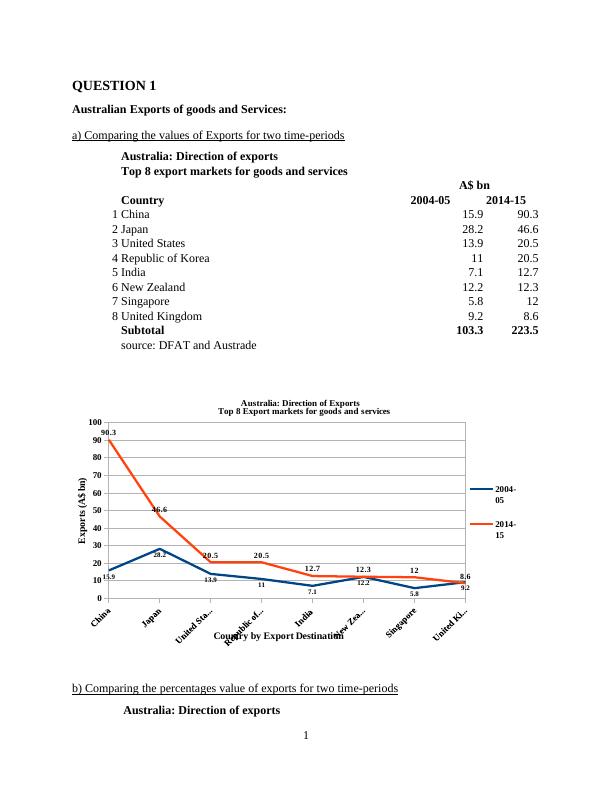
QUESTION 1 Australian Exports of goods and Services:a) Comparing the values of Exports for two time-periodsAustralia: Direction of exports Top 8 export markets for goods and services A$ bnCountry 2004-052014-151China15.990.32Japan28.246.63United States 13.920.54Republic of Korea1120.55India 7.112.76New Zealand12.212.37Singapore5.8128United Kingdom9.28.6Subtotal103.3223.5source: DFAT and Austrade010203040506070809010015.928.213.9117.112.25.89.290.346.620.520.512.712.3128.6Australia: Direction of ExportsTop 8 Export markets for goods and services2004-052014-15Country by Export DestinationExports(A$bn)b) Comparing the percentages value of exports for two time-periodsAustralia: Direction of exports 1
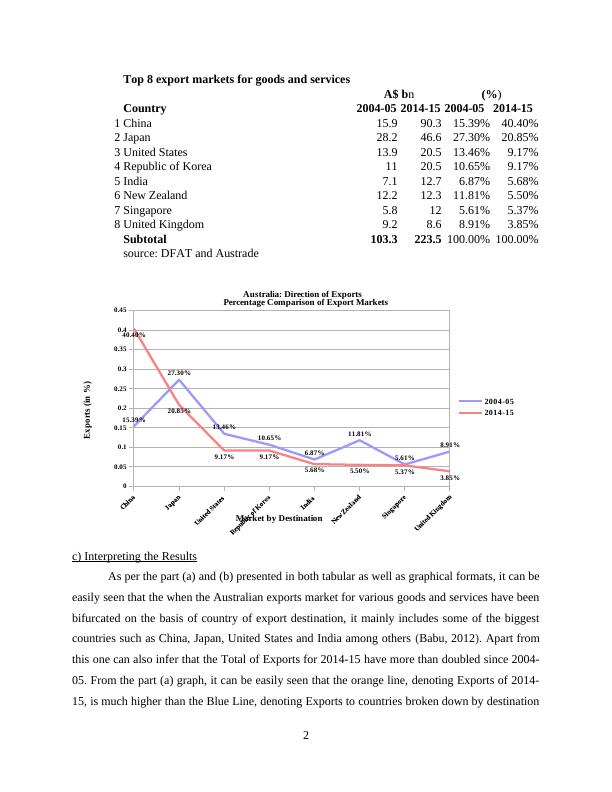
Top 8 export markets for goods and services A$ bn(%)Country 2004-052014-152004-05 2014-151China15.990.315.39%40.40%2Japan28.246.627.30%20.85%3United States 13.920.513.46%9.17%4Republic of Korea1120.510.65%9.17%5India 7.112.76.87%5.68%6New Zealand12.212.311.81%5.50%7Singapore5.8125.61%5.37%8United Kingdom9.28.68.91%3.85%Subtotal103.3223.5100.00%100.00%source: DFAT and Austrade00.050.10.150.20.250.30.350.40.4515.39%27.30%13.46%10.65%6.87%11.81%5.61%8.91%40.40%20.85%9.17%9.17%5.68%5.50%5.37%3.85%Australia: Direction of ExportsPercentage Comparison of Export Markets2004-05 2014-15Market by DestinationExports(in%)c) Interpreting the ResultsAs per the part (a) and (b) presented in both tabular as well as graphical formats, it can beeasily seen that the when the Australian exports market for various goods and services have beenbifurcated on the basis of country of export destination, it mainly includes some of the biggestcountries such as China, Japan, United States and India among others (Babu, 2012). Apart fromthis one can also infer that the Total of Exports for 2014-15 have more than doubled since 2004-05. From the part (a) graph, it can be easily seen that the orange line, denoting Exports of 2014-15, is much higher than the Blue Line, denoting Exports to countries broken down by destination2
End of preview
Want to access all the pages? Upload your documents or become a member.
Related Documents
Australia: Direction of Exports | Assignmentlg...
|12
|1638
|132
Statistics and Research Methods for Business Decision Makinglg...
|11
|2612
|315
Statistics for Business Decisionlg...
|7
|804
|337