Statistics and Research Methods for Business Decision Making
Added on 2022-11-09
12 Pages1297 Words263 Views
End of preview
Want to access all the pages? Upload your documents or become a member.
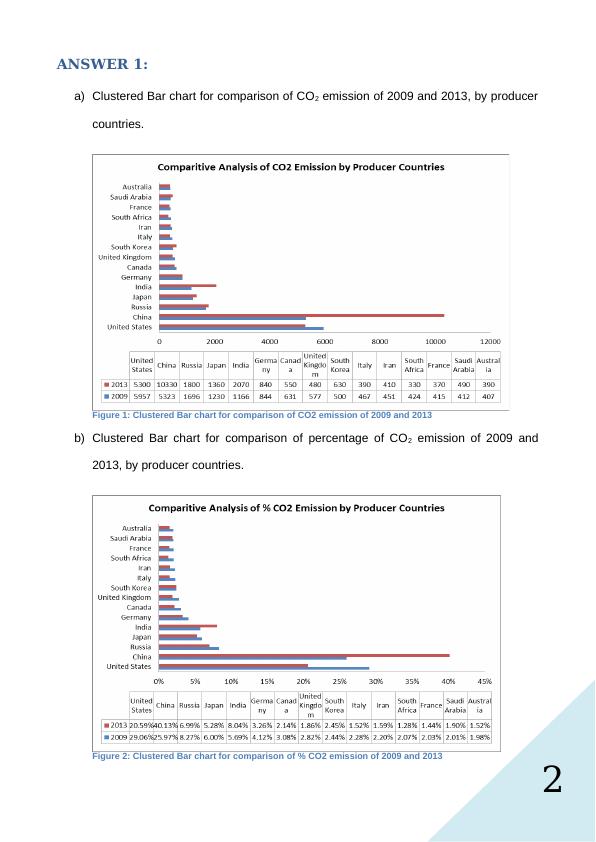
Statistics and Research Methods for Business Decision Making
|12
|1274
|210
Statistics for Business Decision: CO2 Emissions, Vehicle Assembly Line Time, and Inflation Rate Analysis
|14
|1290
|265
Statistics for Business: Carbon Emissions, Frequency Distribution, Time Series Plots
|10
|776
|110
Statistics and Research Methods in Business Decision Making Research 2022
|11
|782
|20
Analysis of CO2 Emission, Welding Time, and Inflation Rate in Australia
|7
|880
|269
Statistics: CO2 Emissions, Welding Time Data Analysis, Inflation Rates and All Ordinaries Index
|12
|1201
|393