Statistics for Business: Carbon Emissions, Frequency Distribution, Time Series Plots
10 Pages776 Words110 Views
Added on 2022-10-10
About This Document
This document covers topics such as carbon emissions, frequency distribution, time series plots in Statistics for Business. It includes explanations, tables, charts, and numerical summaries.
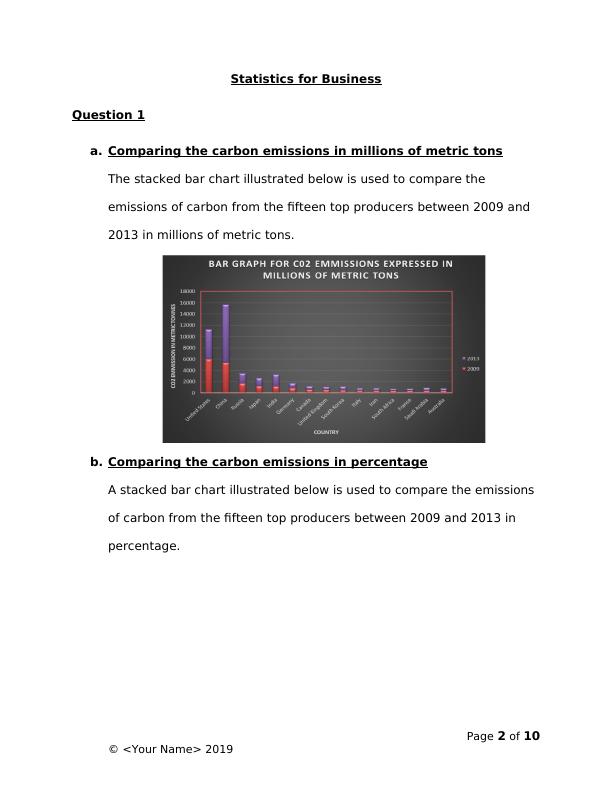
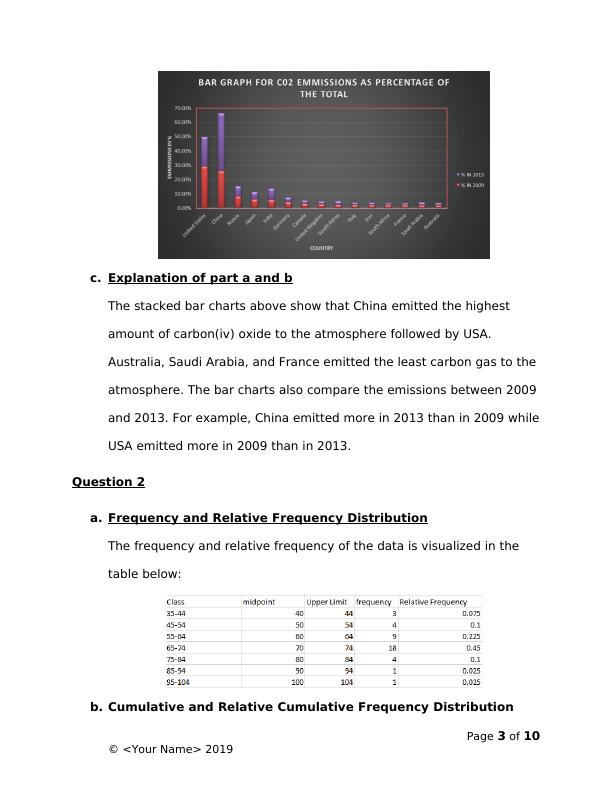
Statistics for Business: Carbon Emissions, Frequency Distribution, Time Series Plots
Added on 2022-10-10
ShareRelated Documents
End of preview
Want to access all the pages? Upload your documents or become a member.
Statistics: CO2 Emission, Frequency Distribution, Regression Model
|9
|779
|270
Statistics and Research Methods for Business Decision Making
|12
|1274
|210
Statistics and Research Methods in Business Decision Making Research 2022
|11
|782
|20
Statistics And Research Methods for Business
|6
|700
|35
Statistics Assignment with CO2 Emission and Regression Analysis
|10
|703
|79
Statistics and Research Methods for Business Decision Making
|12
|1297
|263