Statistics Assignment 1 Solutions

Verified

Added on  2023/06/03

|6
|517
|50
AI Summary
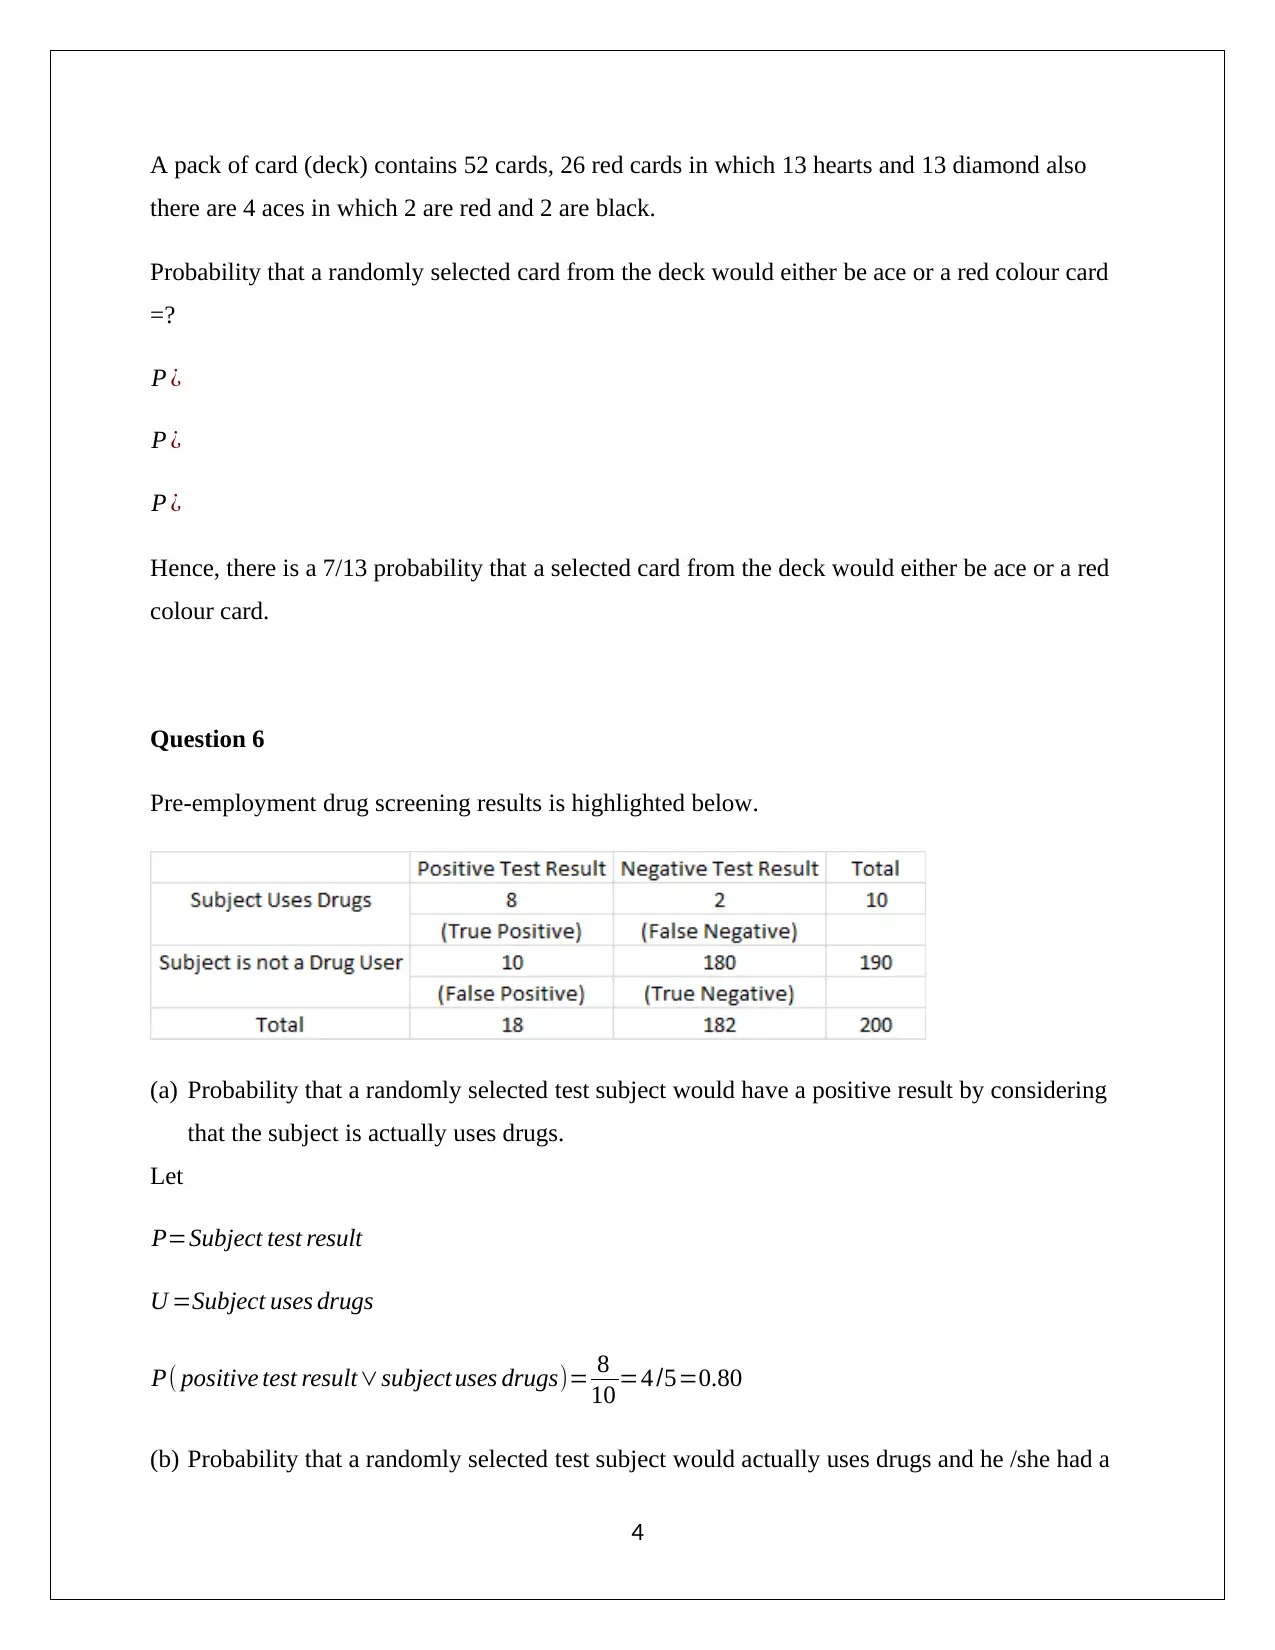
This article provides solutions to Statistics Assignment 1 covering topics such as frequency distribution, mean, standard deviation, probability, and more. It includes solved examples and explanations for each question.
tabler-icon-diamond-filled.svg

Contribute Materials

Your contribution can guide someone’s learning journey. Share your documents today.
Document Page
STATISTICS (STAT -101)
Assignment – 1
Student’s Name
Student’s ID
Section/CRN
Location
tabler-icon-diamond-filled.svg

Secure Best Marks with AI Grader

Need help grading? Try our AI Grader for instant feedback on your assignments.
Document Page
Question 1
Given data points
Frequency distribution
Class interval Frequency Relative frequency
12 – 16 6 0.30
17- 21 3 0.15
22 -26 7 0.35
27-31 3 0.15
32 -36 1 0.05
Total 20 1
Relative Frequency = Class frequency/Total Observations
Question 2
Frequency table
Class
Interval
Frequenc
y
Class Boundaries Class Mid-Points
1019 4 ¿(2019)/2=0.5
¿ 19+0.5=19.5
¿( 10+19) /2=14.5
2029 6 ¿( 3029)/2=0.5
¿ 29+0.5=29.5
¿( 20+29)/2=24.5
3039 10 =(40-39 ¿/2=0.5
¿ 39+0.5=39.5
¿( 30+39)/2=34.5
4049 6 =(50- 49 ¿ /2=0.5
¿ 49+ 0.5=49.5
¿( 40+9)/2=44.5
5059 4 =(60-59 ¿/2=0.5
¿ 59+0.5=59.5
¿( 50+59) /2=54.5
1
Document Page
Histogram
10 - 19 20-29 30-39 40-49 50-59
0
2
4
6
8
10
12
Histogram
Class Interval
Frequency
Question 3
Data points
5, 6, 7, 8, 9
Mean x= x
n =5+ 6+7+8+ 9
5 =7
Standard deviation of sample ¿ 1
n1 ¿ ¿ ¿
2
Document Page
Standard deviation= ( 4+1+0+1+ 4)
51 =1.58
Based on the above computation, it can be said that value 10 is unusual because it does not lie in
the data points.
Question 4
Distribution of marks
Marks
Interval
No. of
Students
(F)
Mid-Point of
Interval (M)
F*M
0-10 4 = (0+10)/2
= 5
=4*5 = 20
10-20 6 =(10+20)/2
= 15
=6*15 = 90
20-30 10 =(20+30)/2
= 25
=10*25 =250
30-40 6 =(30+40)/2
=35
=6*35 =210
40-50 4 =(40+50)/2
=45
=4*45 =180
Mean= FM
F = 750
30 =25
Therefore, the mean of the marks is 25.
Question 5
3
tabler-icon-diamond-filled.svg

Secure Best Marks with AI Grader

Need help grading? Try our AI Grader for instant feedback on your assignments.
Document Page
A pack of card (deck) contains 52 cards, 26 red cards in which 13 hearts and 13 diamond also
there are 4 aces in which 2 are red and 2 are black.
Probability that a randomly selected card from the deck would either be ace or a red colour card
=?
P ¿
P ¿
P ¿
Hence, there is a 7/13 probability that a selected card from the deck would either be ace or a red
colour card.
Question 6
Pre-employment drug screening results is highlighted below.
(a) Probability that a randomly selected test subject would have a positive result by considering
that the subject is actually uses drugs.
Let
P=Subject test result
U =Subject uses drugs
P( positive test resultsubject uses drugs)= 8
10 =4 /5=0.80
(b) Probability that a randomly selected test subject would actually uses drugs and he /she had a
4
Document Page
positive test result.
P ( subject uses drugs| positive test result ) = 8
18 = 4
9 =0.44
5
chevron_up_icon
1 out of 6
circle_padding
hide_on_mobile
zoom_out_icon
[object Object]

Your All-in-One AI-Powered Toolkit for Academic Success.

Available 24*7 on WhatsApp / Email

[object Object]