logo

Descriptive Statistics Name of the University Author

11 Pages1247 Words493 Views
   

Added on  2020-03-23

About This Document

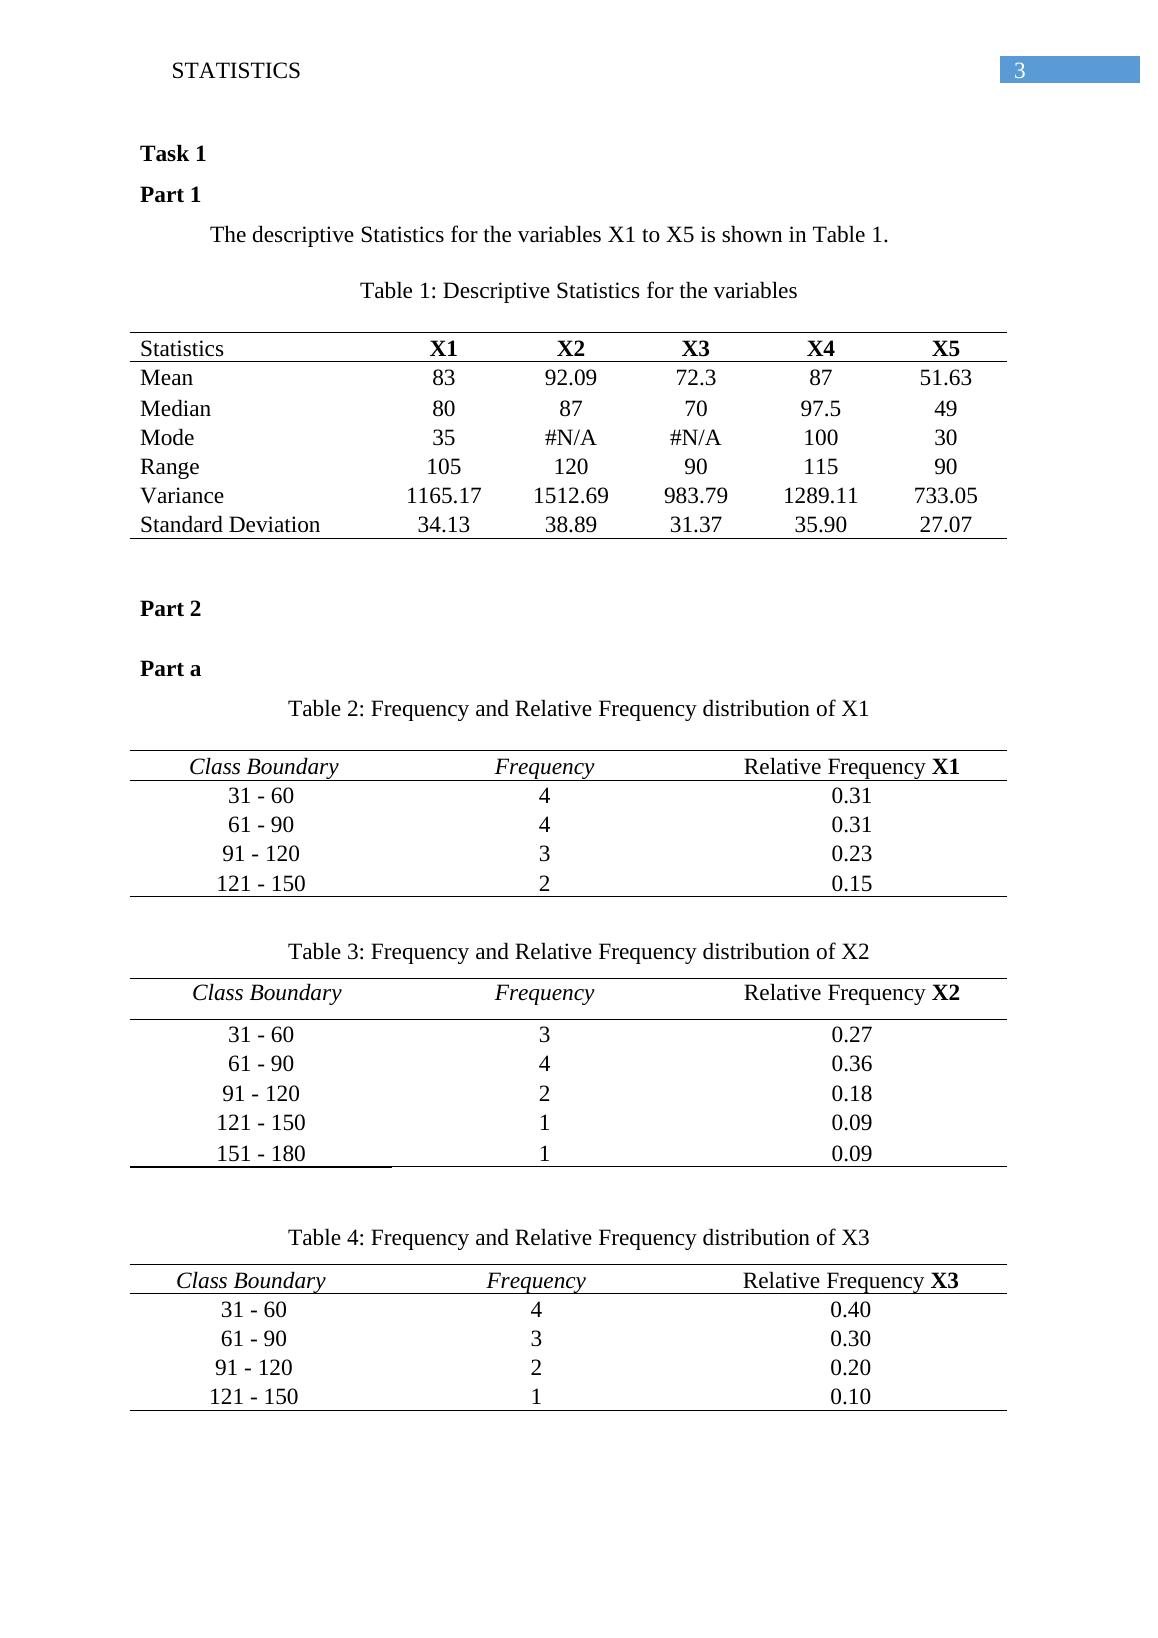
Table 1: Descriptive Statistics for the variables Statistics X1 X2 X3 X4 X5 Mean 83 92.09 72.3 87.63 Median 80 87 70 97.5 49 Mode 35 #N/A #N/A 100 30 Range 10538 90 115 90 Variance 1165.17 1512.69 983.79 1289.11 733.05 Standard Deviation 34.13 38.89 31.37 35.90 27.07 Part 2 Part a Table 2: Frequency and

Descriptive Statistics Name of the University Author

   Added on 2020-03-23

ShareRelated Documents
Running head: STATISTICS
Statistics
Name of the Student
Name of the University
Author Note
Descriptive Statistics Name of the University Author_1
2STATISTICS
Table of Contents
Task 1.........................................................................................................................................3
Part 1......................................................................................................................................3
Part 2......................................................................................................................................3
Part a...................................................................................................................................3
Part b..................................................................................................................................4
Part 3......................................................................................................................................6
Part 4......................................................................................................................................7
Task 2.........................................................................................................................................8
Part 1......................................................................................................................................8
Part 2......................................................................................................................................8
Part 3......................................................................................................................................8
Part 4......................................................................................................................................9
Part 5......................................................................................................................................9
Part 6......................................................................................................................................9
Part 7....................................................................................................................................11
Part 8....................................................................................................................................11
Descriptive Statistics Name of the University Author_2
3STATISTICS
Task 1
Part 1
The descriptive Statistics for the variables X1 to X5 is shown in Table 1.
Table 1: Descriptive Statistics for the variables
Statistics X1 X2 X3 X4 X5
Mean 83 92.09 72.3 87 51.63
Median 80 87 70 97.5 49
Mode 35 #N/A #N/A 100 30
Range 105 120 90 115 90
Variance 1165.17 1512.69 983.79 1289.11 733.05
Standard Deviation 34.13 38.89 31.37 35.90 27.07
Part 2
Part a
Table 2: Frequency and Relative Frequency distribution of X1
Class Boundary Frequency Relative Frequency X1
31 - 60 4 0.31
61 - 90 4 0.31
91 - 120 3 0.23
121 - 150 2 0.15
Table 3: Frequency and Relative Frequency distribution of X2
Class Boundary Frequency Relative Frequency X2
31 - 60 3 0.27
61 - 90 4 0.36
91 - 120 2 0.18
121 - 150 1 0.09
151 - 180 1 0.09
Table 4: Frequency and Relative Frequency distribution of X3
Class Boundary Frequency Relative Frequency X3
31 - 60 4 0.40
61 - 90 3 0.30
91 - 120 2 0.20
121 - 150 1 0.10
Descriptive Statistics Name of the University Author_3
4STATISTICS
Table 5: Frequency and Relative Frequency distribution of X4
Class Boundary Frequency Relative Frequency X4
31 - 60 3 0.3
61 - 90 1 0.1
91 - 120 5 0.5
121 - 150 1 0.1
Table 6: Frequency and Relative Frequency distribution of X5
Class Boundary Frequency Relative Frequency X5
0 - 30 6 0.375
31 - 60 5 0.3125
61 - 90 4 0.25
91 - 120 1 0.0625
Part b
30 60 90 120 150
0.00
0.05
0.10
0.15
0.20
0.25
0.30
0.35
Relative Frequency X1
Relative Frequency
Figure 1: Relative Frequency Histogram of X1
Descriptive Statistics Name of the University Author_4

End of preview

Want to access all the pages? Upload your documents or become a member.

Related Documents
Strategic Information System | Statistics Usage Assignment
|11
|1469
|55

HI6007 Statistics for Business Decisions -Assignment
|13
|1702
|31

Assignment on Statistics Of Costing Using MS Excel
|5
|1956
|202

(Solution) Statistics Assignment
|9
|1228
|303

QUAN102 - Statistics In Business Assignment
|7
|1209
|67

Statistics for Business Decision Assignment Sample
|15
|2576
|164