Assignment on Statistics Report
18 Pages2125 Words67 Views
Added on 2020-07-23
Assignment on Statistics Report
Added on 2020-07-23
ShareRelated Documents
STATISTICS1
Table of ContentsQUESTION 1.......................................................................................................................................1A. Justifying type of samples............................................................................................................1B. Appropriate test to examine 1-carat effect...................................................................................1C. Reporting 95% confidence interval for difference in average prices...........................................1D. Stating and checking assumptions...............................................................................................1QUESTION 2.......................................................................................................................................4A. Examining significant difference in the yearly growth percentage across three regions............4B. Perform post-hoc tests..................................................................................................................5C. 95% pair-wise CI for mean difference in yearly growth % in Antarctic Peninsula and Himalayas.........................................................................................................................................5D. Stating and checking the assumptions for analysis......................................................................5QUESTION 3.......................................................................................................................................9A. Scatter Plot with fitted regression line.........................................................................................9B. Assessing linear relationship between Osmolality and specific gravity......................................9C. Assumptions for regression........................................................................................................10D. Equation for estimated regression line and interpreting slope coefficient.................................10E. Predicting osmolality for USG value of 1.025...........................................................................11F. Write down R2 value for regression and interpretation...............................................................11G. Sensible or not to use R2 value to predict osmolality................................................................11REFERENCES...................................................................................................................................12APPENDIX....................................................................................................................................13Appendix: 1. Independent sample t-test.........................................................................................13Appendix: 2. Normality Test..........................................................................................................13Appendix: 3. One-Way ANOVA....................................................................................................13Appendix: 4. Post Hoc tests............................................................................................................14Appendix: 5. Normality test...........................................................................................................14Appendix: 6. Regression & Correlation.........................................................................................15Appendix: 7. Normality Test..........................................................................................................162
QUESTION 1A. Justifying type of samples Drawing out a random sample of 30 diamonds less than 1 carat and 30 diamonds above 1-carat weight are independent samples because in both of these, different units had selected withhaving different carat weight. B. Appropriate test to examine 1-carat effect μ0: Average price of carat diamond is not higher than sub-carat diamonds. μ1: Average price of carat diamond is higher than sub-carat diamonds.Test significance: 0.05 or 5%Independent sample T-testNull distribution: F distributionResults: Appendix 1Group Statistics table reflect that Carat size diamond’s average price is 50.90 greater thanthe price of ‘Sub Carat’ diamond size with an average price of just 43.07. The statisticalsignificance of looked difference is tested through independent sample t-test. In this, Leneve’s teststatistics reflect sig value of 0.001<0.05 which states that popular variance in both the groups arenot equal and found sig. level t(38.27) = 2.386, p = 0.022<0.05 that reflects significant differenceexists in the diamond price of “carat’ and ‘Sub Carat’ size. Thus, alternative hypothesis acceptedthat demonstrates that point price of carat diamonds is higher than sub-carat diamonds due toexistence of 1 carat effect (Koch, 2013). C. Reporting 95% confidence interval for difference in average pricesThe output shows that at 95%, confidence interval for the equal variance not assumed seriesis found 1.18 – 14.46 which evident that difference exists in the price of carat and sub-caratdiamond sizes. Thus, the difference in average price between Carat and Sub-carat lies in the rangeof 1.18 -14.46. The findings are in line with the lower P value of 0.022 than test statistics of 0.05,hence, it can be said that CI supports acceptance of alternative hypothesis evidencing the presenceof 1-carat effect (De Winter, 2013). D. Stating and checking assumptionsDependent variable must be measured on continuous scale (ratio or interval). Here pointprice satisfies the conditions. Independent variable must be independent group that are ‘carat’ and ‘sub-carat’ sizes. 1
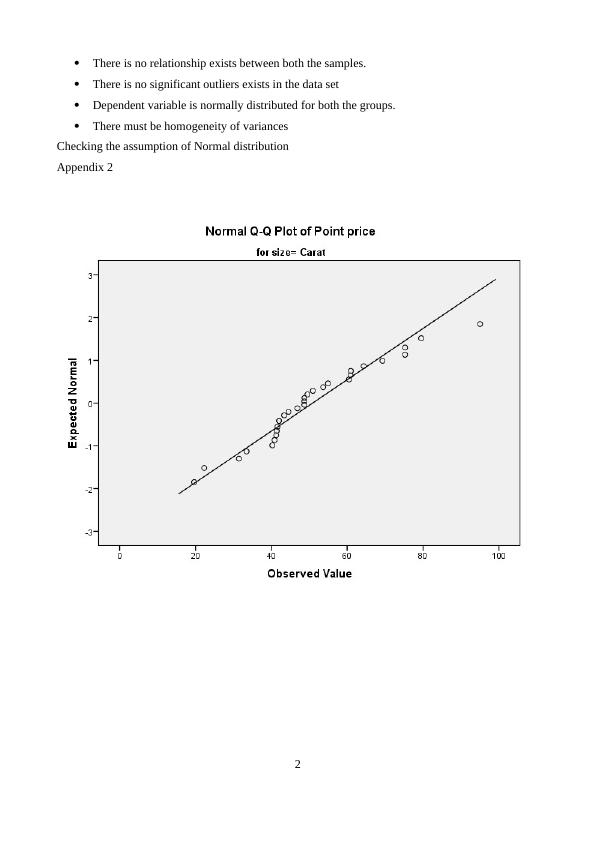
There is no relationship exists between both the samples.There is no significant outliers exists in the data set Dependent variable is normally distributed for both the groups. There must be homogeneity of variances Checking the assumption of Normal distribution Appendix 22
End of preview
Want to access all the pages? Upload your documents or become a member.
Related Documents
Analysis of Age Difference Between the Birth Weightlg...
|13
|2069
|57
Statistics Problems Assignment (pdf)lg...
|18
|5401
|13
Regression Analysis and Inference for BHP Stocklg...
|4
|707
|76
Statistics Assignment (Doc)lg...
|13
|2175
|47
Hypothesis Testing and Confidence Intervals for Grandparent Carers in Parramattalg...
|11
|1459
|221
Biostatistics Assignment 2: Hypothesis Testing and Statistical Analysislg...
|14
|2220
|425