Statistics for Business Decisions - Desklib
Added on 2023-06-08
6 Pages836 Words321 Views
Running Head: STATISTICS FOR BUSINESS DECISIONS
Statistics for business decisions
Name of the Student
Name of the University
Author Note
Statistics for business decisions
Name of the Student
Name of the University
Author Note
1STATISTICS FOR BUSINESS DECISIONS
Table of Contents
Answer 1..........................................................................................................................................2
Part a............................................................................................................................................2
Part b............................................................................................................................................2
Answer 2..........................................................................................................................................2
Part a............................................................................................................................................2
Part b............................................................................................................................................3
Part c............................................................................................................................................3
Part d............................................................................................................................................3
Part e............................................................................................................................................3
Answer 3..........................................................................................................................................3
Part a............................................................................................................................................3
Part b............................................................................................................................................3
Answer 4..........................................................................................................................................4
Part a............................................................................................................................................4
Part b............................................................................................................................................4
Part c............................................................................................................................................4
Part d............................................................................................................................................5
Part e............................................................................................................................................5
2STATISTICS FOR BUSINESS DECISIONS
Answer 1
Part a
Class
Width
Frequenc
y
Cumulative
Frequency
Relative
Frequenc
y
Cumulative
Relative
Frequency
Percent
Frequency
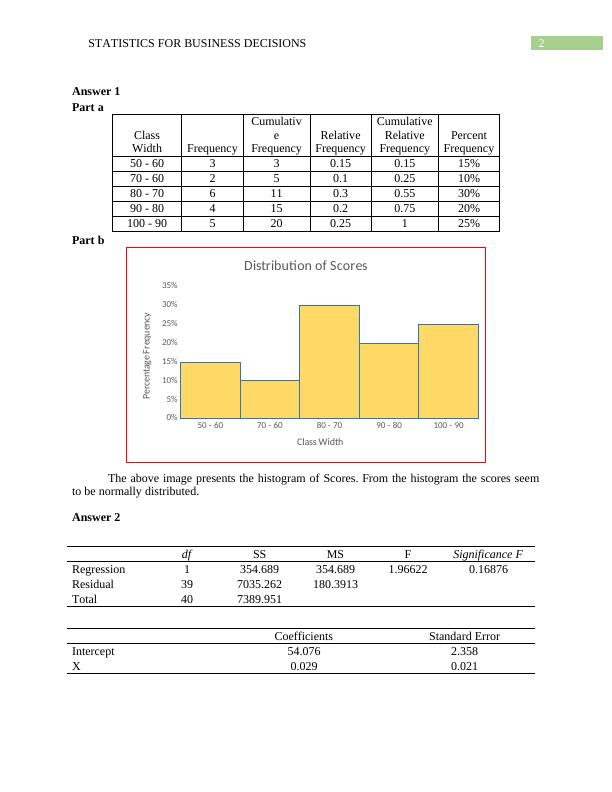
50 - 60 3 3 0.15 0.15 15%
70 - 60 2 5 0.1 0.25 10%
80 - 70 6 11 0.3 0.55 30%
90 - 80 4 15 0.2 0.75 20%
100 - 90 5 20 0.25 1 25%
Part b
50 - 60 70 - 60 80 - 70 90 - 80 100 - 90
0%
5%
10%
15%
20%
25%
30%
35%
Distribution of Scores
Class Width
Percentage Frequency
The above image presents the histogram of Scores. From the histogram the scores seem
to be normally distributed.
Answer 2
df SS MS F Significance F
Regression 1 354.689 354.689 1.96622 0.16876
Residual 39 7035.262 180.3913
Total 40 7389.951
Coefficients Standard Error
Intercept 54.076 2.358
X 0.029 0.021
Answer 1
Part a
Class
Width
Frequenc
y
Cumulative
Frequency
Relative
Frequenc
y
Cumulative
Relative
Frequency
Percent
Frequency
50 - 60 3 3 0.15 0.15 15%
70 - 60 2 5 0.1 0.25 10%
80 - 70 6 11 0.3 0.55 30%
90 - 80 4 15 0.2 0.75 20%
100 - 90 5 20 0.25 1 25%
Part b
50 - 60 70 - 60 80 - 70 90 - 80 100 - 90
0%
5%
10%
15%
20%
25%
30%
35%
Distribution of Scores
Class Width
Percentage Frequency
The above image presents the histogram of Scores. From the histogram the scores seem
to be normally distributed.
Answer 2
df SS MS F Significance F
Regression 1 354.689 354.689 1.96622 0.16876
Residual 39 7035.262 180.3913
Total 40 7389.951
Coefficients Standard Error
Intercept 54.076 2.358
X 0.029 0.021
End of preview
Want to access all the pages? Upload your documents or become a member.
Related Documents
Statistics: ANOVA, Regression Analysis and Frequency Distribution Tablelg...
|5
|939
|123
Statistics Exam: Frequency Distribution, Regression Analysis, ANOVA, and Sales Datalg...
|7
|1353
|141
Statistics for Business Decision Makinglg...
|7
|985
|83
Statistics Assignment Solutions | Deskliblg...
|8
|1150
|326
Statistics for Business Decisions - Deskliblg...
|6
|775
|444
Data Analysis for Desklib Online Librarylg...
|6
|725
|444