Statistics Study Material
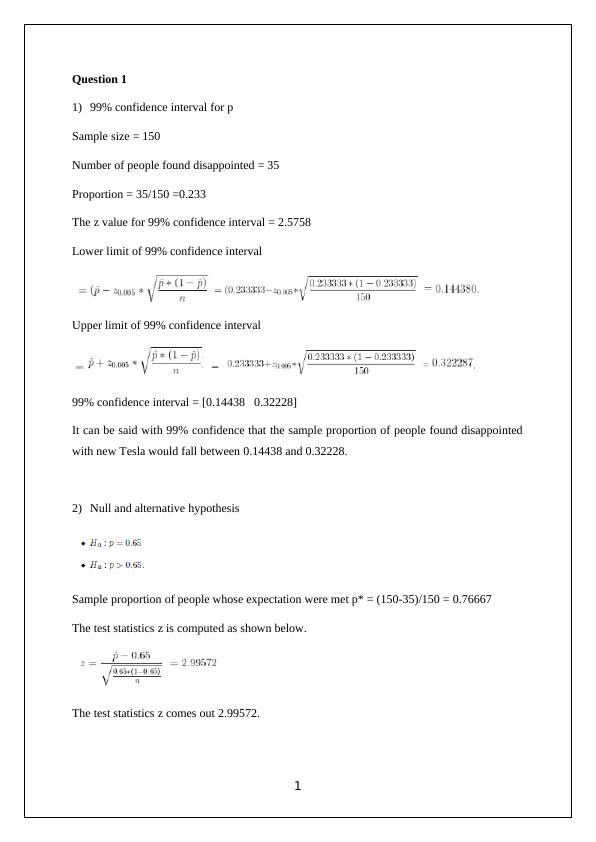
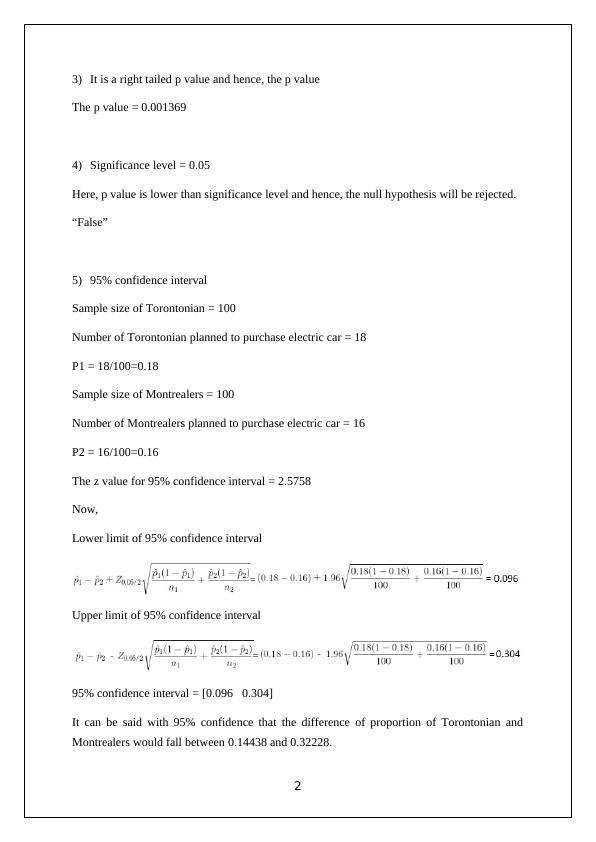
The assignment is about obtaining information on whether new Canadian owners of the Model 3 self-driving electric car have their expectations met or exceeded with the purchase. It involves calculating a confidence interval for the proportion of individuals for whom expectations were met or exceeded.
6 Pages723 Words74 Views
Added on 2023-01-11
About This Document
This document provides study material for Statistics, including solved assignments and essays. It covers topics such as confidence intervals, hypothesis testing, and regression analysis. The document also includes sample calculations and explanations.
Statistics Study Material
The assignment is about obtaining information on whether new Canadian owners of the Model 3 self-driving electric car have their expectations met or exceeded with the purchase. It involves calculating a confidence interval for the proportion of individuals for whom expectations were met or exceeded.
Added on 2023-01-11
ShareRelated Documents
End of preview
Want to access all the pages? Upload your documents or become a member.
Statistics Study Material
|7
|1378
|58
Business Statistics Assignment 2
|34
|6311
|80
(PDF) Money and Banking : Assignment
|16
|2370
|45
Statistics: Answers to Sample Problems
|6
|659
|139
Appropriate Statistics Solution 2022
|13
|1368
|11
Statistics Task Question Answer 2022
|11
|883
|34