Statistics for Finance and Business Name of the University Author
Added on 2020-05-16
13 Pages1870 Words280 Views
Running Head: STATISTICS FOR FINANCE AND BUSINESSStatistics for Finance and BusinessName of the StudentName of the UniversityAuthor Note
STATISTICS FOR FINANCE AND BUSINESS1SFFBTable of ContentsIntroduction......................................................................................................................................2Answer 1..........................................................................................................................................2Answer 2..........................................................................................................................................4Part a............................................................................................................................................4Part b............................................................................................................................................5Part c............................................................................................................................................6Answer 3..........................................................................................................................................6Answer 4..........................................................................................................................................7Answer 5..........................................................................................................................................8Answer 6..........................................................................................................................................9Answer 7..........................................................................................................................................9Part a............................................................................................................................................9Part b..........................................................................................................................................11Part c..........................................................................................................................................11Part d..........................................................................................................................................11Answer 8........................................................................................................................................11Answer 9........................................................................................................................................12
STATISTICS FOR FINANCE AND BUSINESS2SFFBIntroduction Analysis of performance of stocks is useful in taking a decision regarding investment inthe stocks. Stocks of an organization is evaluated on the basis of its returns and risk factors. Inthe present assignment we have compared the stocks of Boeing and IBM. Based on my rollnumber (19530373) the period of analysis of the stocks starts from 1/12/2010 and ends at31/05/2016. The source of data is yahoo finance. Moreover, stock prices of S&P 500 and US TNare also accessed for analysis of the stocks. On the basis of analysis of the stocks an investment decision may be taken. Answer 1The time trend analysis of the stocks is being presented: 12/1/20103/1/20116/1/20119/1/201112/1/20113/1/20126/1/20129/1/201212/1/20123/1/20136/1/20139/1/201312/1/20133/1/20146/1/20149/1/201412/1/20143/1/20156/1/20159/1/201512/1/20153/1/20160.00500.001000.001500.002000.002500.00Trend of S&PTime PeriodPriceFigure 1: Closing prices of S&P 500
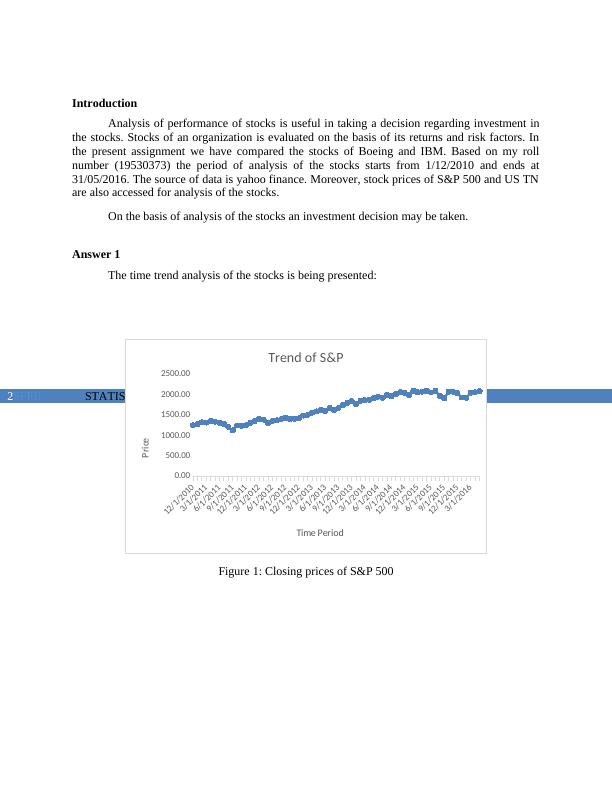
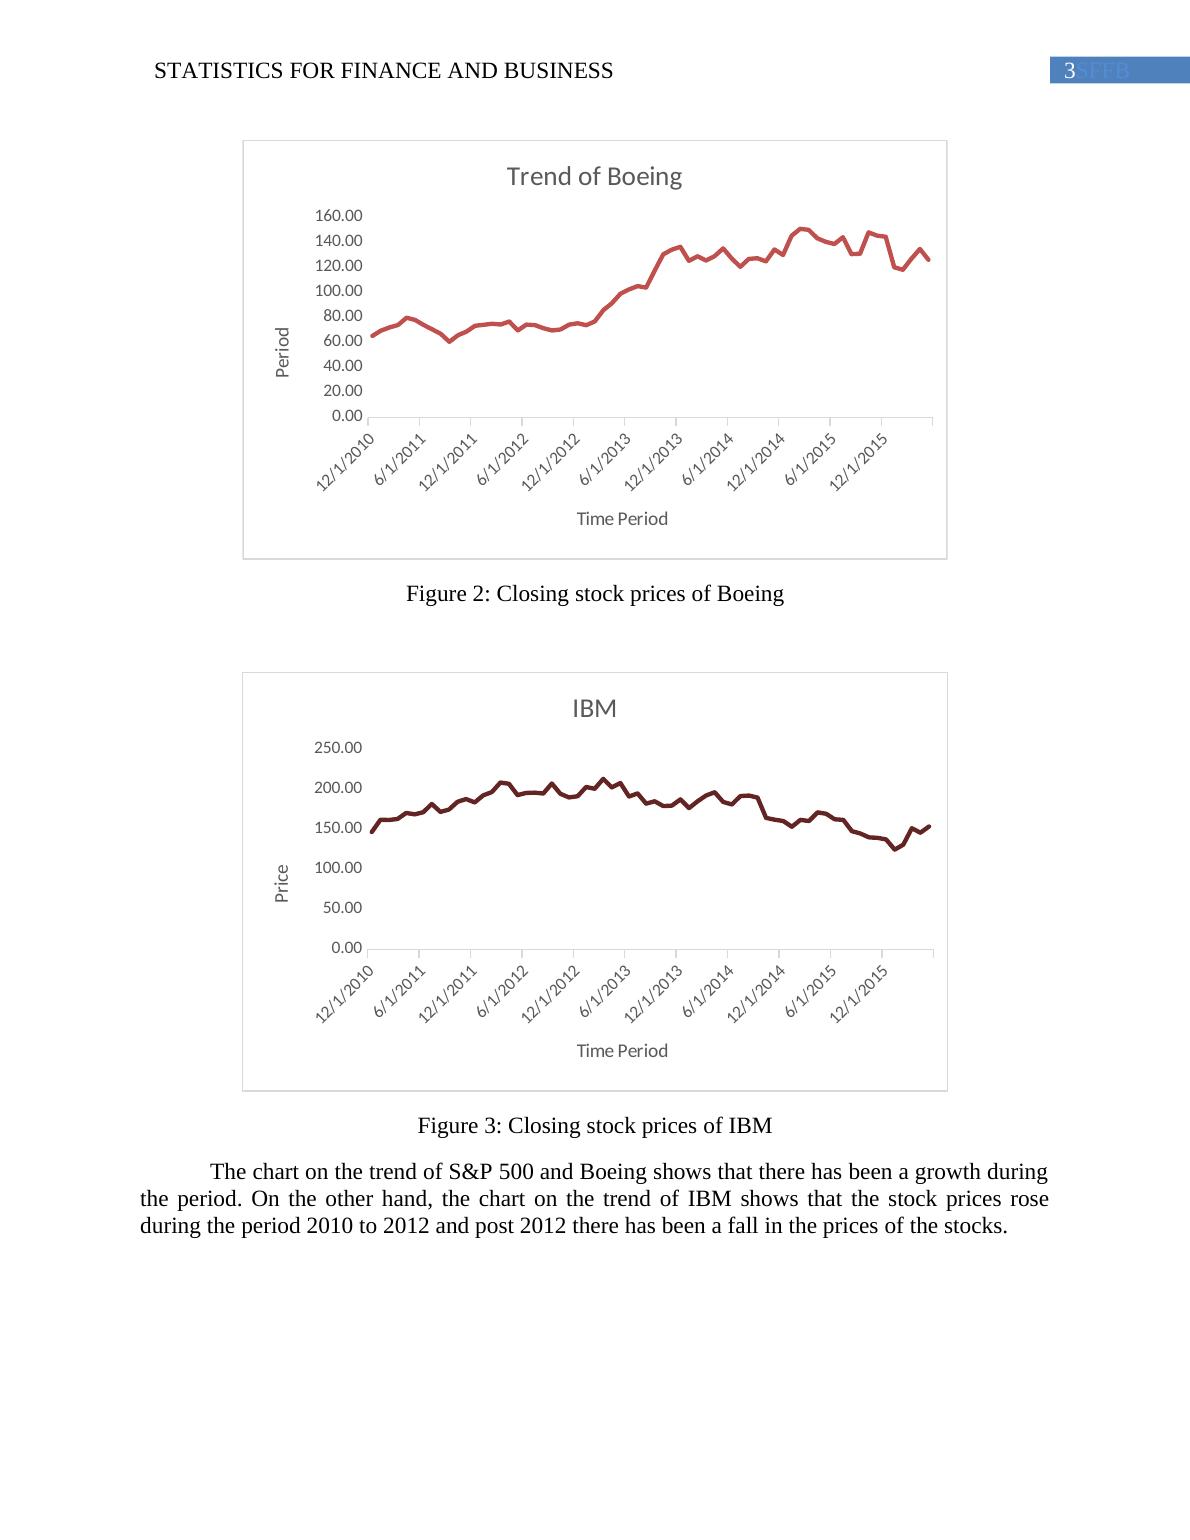
STATISTICS FOR FINANCE AND BUSINESS3SFFB12/1/20103/1/20116/1/20119/1/201112/1/20113/1/20126/1/20129/1/201212/1/20123/1/20136/1/20139/1/201312/1/20133/1/20146/1/20149/1/201412/1/20143/1/20156/1/20159/1/201512/1/20153/1/20160.0020.0040.0060.0080.00100.00120.00140.00160.00Trend of BoeingTime PeriodPeriodFigure 2: Closing stock prices of Boeing 12/1/20103/1/20116/1/20119/1/201112/1/20113/1/20126/1/20129/1/201212/1/20123/1/20136/1/20139/1/201312/1/20133/1/20146/1/20149/1/201412/1/20143/1/20156/1/20159/1/201512/1/20153/1/20160.0050.00100.00150.00200.00250.00IBMTime PeriodPriceFigure 3: Closing stock prices of IBMThe chart on the trend of S&P 500 and Boeing shows that there has been a growth duringthe period. On the other hand, the chart on the trend of IBM shows that the stock prices roseduring the period 2010 to 2012 and post 2012 there has been a fall in the prices of the stocks.
End of preview
Want to access all the pages? Upload your documents or become a member.
Related Documents
STATISTICS FOR FINANCE AND BUSINESS Statistics for Finance and Business Name of the University Authorlg...
|11
|1628
|389
Business and Finance Statistics for Business and Financelg...
|13
|3814
|251
Security Analysis Assignment IBMlg...
|11
|1769
|40
Stock Returns: Boeing & IBM Analysis Reportlg...
|14
|2616
|155
Statistics Assignment | Stock Valuationlg...
|17
|2377
|69
Statistics for Business and Finance - Analysis of Boeing and General Dynamics Stockslg...
|14
|2481
|429