logo

Statistics for Business and Finance - Analysis of Boeing and General Dynamics Stocks

14 Pages2481 Words429 Views
   

Added on  2023-06-11

About This Document

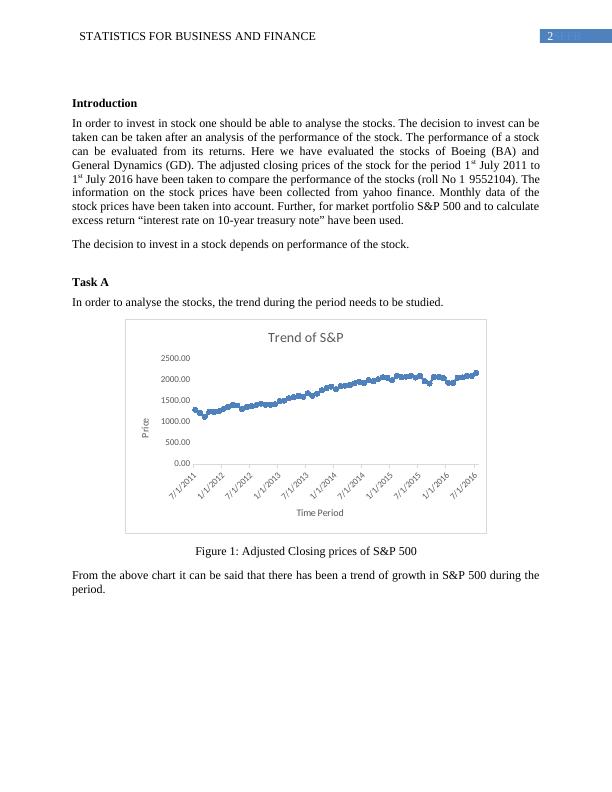
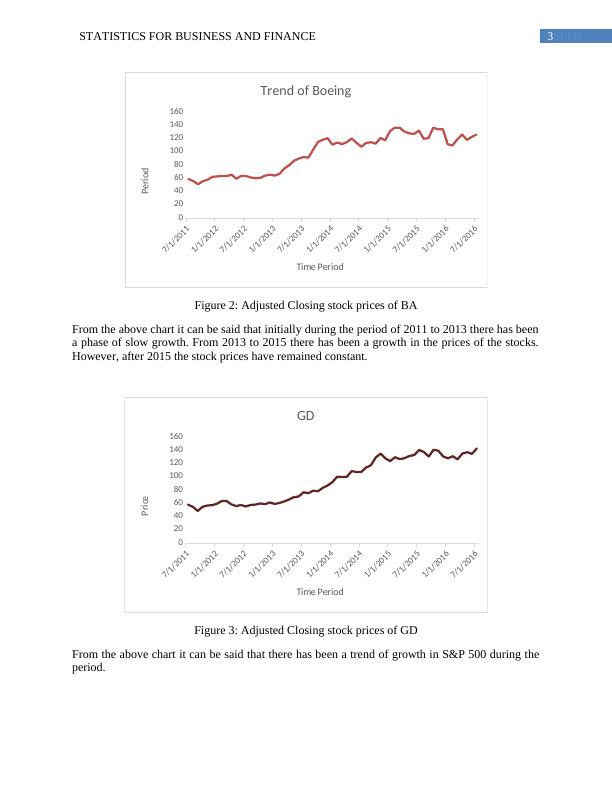
The article presents an analysis of the performance of Boeing and General Dynamics stocks in the period of 1st July 2011 to 1st July 2016. The returns on the prices of the stocks, trend analysis, summary statistics, Jarque-Berra test, one sample t-test, and F-test are used to evaluate the performance of the stocks. The article helps investors to make informed investment decisions.

Statistics for Business and Finance - Analysis of Boeing and General Dynamics Stocks

   Added on 2023-06-11

ShareRelated Documents
Running Head: STATISTICS FOR BUSINESS AND FINANCE
Statistics for Business and Finance
Name of the Student
Name of the University
Author Note
Statistics for Business and Finance - Analysis of Boeing and General Dynamics Stocks_1
1SFFBSTATISTICS FOR BUSINESS AND FINANCE
Table of Contents
Introduction......................................................................................................................................2
Task A..............................................................................................................................................2
Part 2................................................................................................................................................4
Part a............................................................................................................................................4
Part b............................................................................................................................................6
Part c............................................................................................................................................6
Part 3................................................................................................................................................7
Part 4................................................................................................................................................8
Part 5................................................................................................................................................8
Part 6................................................................................................................................................9
Part 7................................................................................................................................................9
Part a............................................................................................................................................9
Part b..........................................................................................................................................11
Part c..........................................................................................................................................11
Part d..........................................................................................................................................12
Part 8..............................................................................................................................................12
Part 9..............................................................................................................................................12
Statistics for Business and Finance - Analysis of Boeing and General Dynamics Stocks_2
2SFFBSTATISTICS FOR BUSINESS AND FINANCE
Introduction
In order to invest in stock one should be able to analyse the stocks. The decision to invest can be
taken can be taken after an analysis of the performance of the stock. The performance of a stock
can be evaluated from its returns. Here we have evaluated the stocks of Boeing (BA) and
General Dynamics (GD). The adjusted closing prices of the stock for the period 1st July 2011 to
1st July 2016 have been taken to compare the performance of the stocks (roll No 1 9552104). The
information on the stock prices have been collected from yahoo finance. Monthly data of the
stock prices have been taken into account. Further, for market portfolio S&P 500 and to calculate
excess return “interest rate on 10-year treasury note” have been used.
The decision to invest in a stock depends on performance of the stock.
Task A
In order to analyse the stocks, the trend during the period needs to be studied.
7/1/2011
1/1/2012
7/1/2012
1/1/2013
7/1/2013
1/1/2014
7/1/2014
1/1/2015
7/1/2015
1/1/2016
7/1/2016
0.00
500.00
1000.00
1500.00
2000.00
2500.00
Trend of S&P
Time Period
Price
Figure 1: Adjusted Closing prices of S&P 500
From the above chart it can be said that there has been a trend of growth in S&P 500 during the
period.
Statistics for Business and Finance - Analysis of Boeing and General Dynamics Stocks_3
3SFFBSTATISTICS FOR BUSINESS AND FINANCE
7/1/2011
1/1/2012
7/1/2012
1/1/2013
7/1/2013
1/1/2014
7/1/2014
1/1/2015
7/1/2015
1/1/2016
7/1/2016
0
20
40
60
80
100
120
140
160
Trend of Boeing
Time Period
Period
Figure 2: Adjusted Closing stock prices of BA
From the above chart it can be said that initially during the period of 2011 to 2013 there has been
a phase of slow growth. From 2013 to 2015 there has been a growth in the prices of the stocks.
However, after 2015 the stock prices have remained constant.
7/1/2011
1/1/2012
7/1/2012
1/1/2013
7/1/2013
1/1/2014
7/1/2014
1/1/2015
7/1/2015
1/1/2016
7/1/2016
0
20
40
60
80
100
120
140
160
GD
Time Period
Price
Figure 3: Adjusted Closing stock prices of GD
From the above chart it can be said that there has been a trend of growth in S&P 500 during the
period.
Statistics for Business and Finance - Analysis of Boeing and General Dynamics Stocks_4

End of preview

Want to access all the pages? Upload your documents or become a member.

Related Documents
Investment Finance
|10
|1796
|202

Statistical Analysis and Comparison between Stock Prices of Boeing Company and General Dynamics
|12
|4094
|443

Comparison of Boeing Company (BA) and General Dynamics (GD) Stock Prices: Analysis and Findings
|15
|4454
|391

Statistics for Finance and Business Name of the University Author
|13
|1870
|280

Statistics of Business and Finance
|9
|1388
|439

Stock Returns: Boeing & IBM Analysis Report
|14
|2616
|155