University Statistics for Business Data Analytics Assignment
VerifiedAdded on 2019/10/31
|10
|1325
|366
Homework Assignment
AI Summary
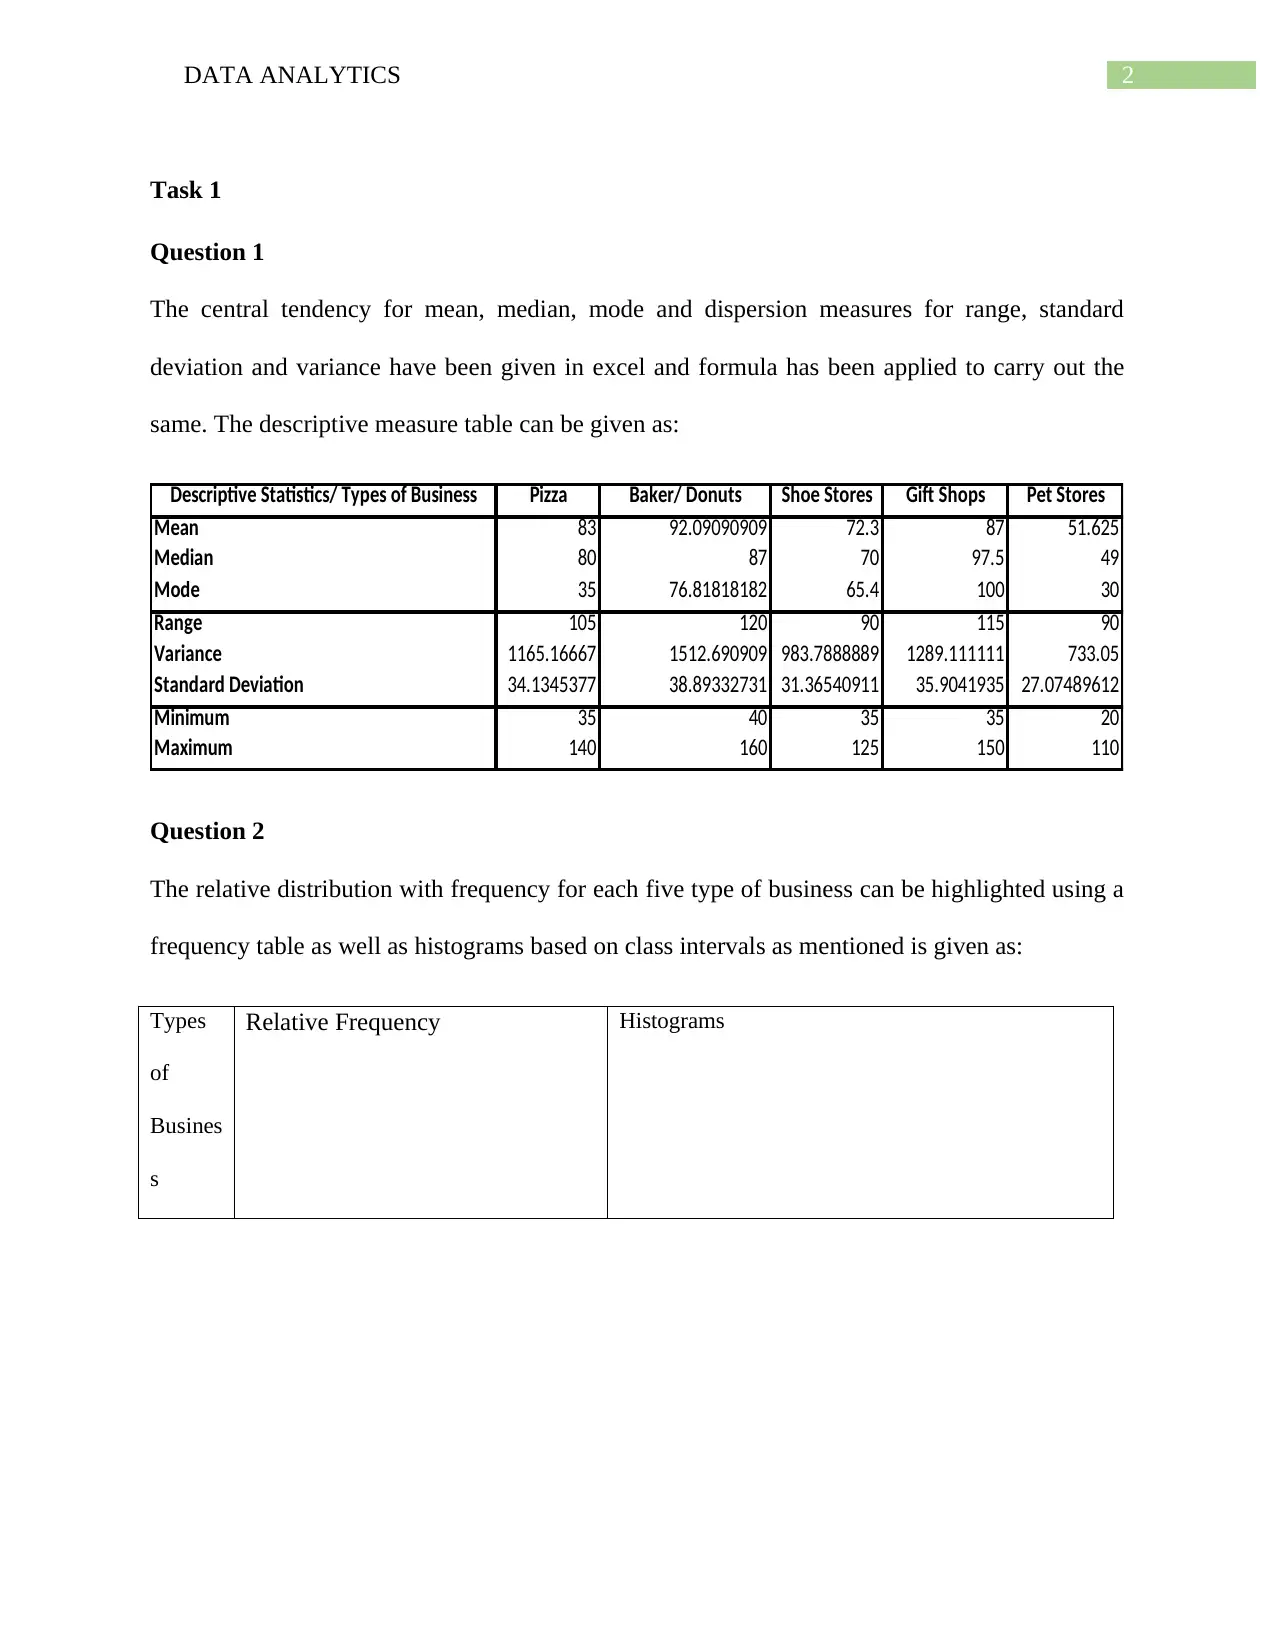
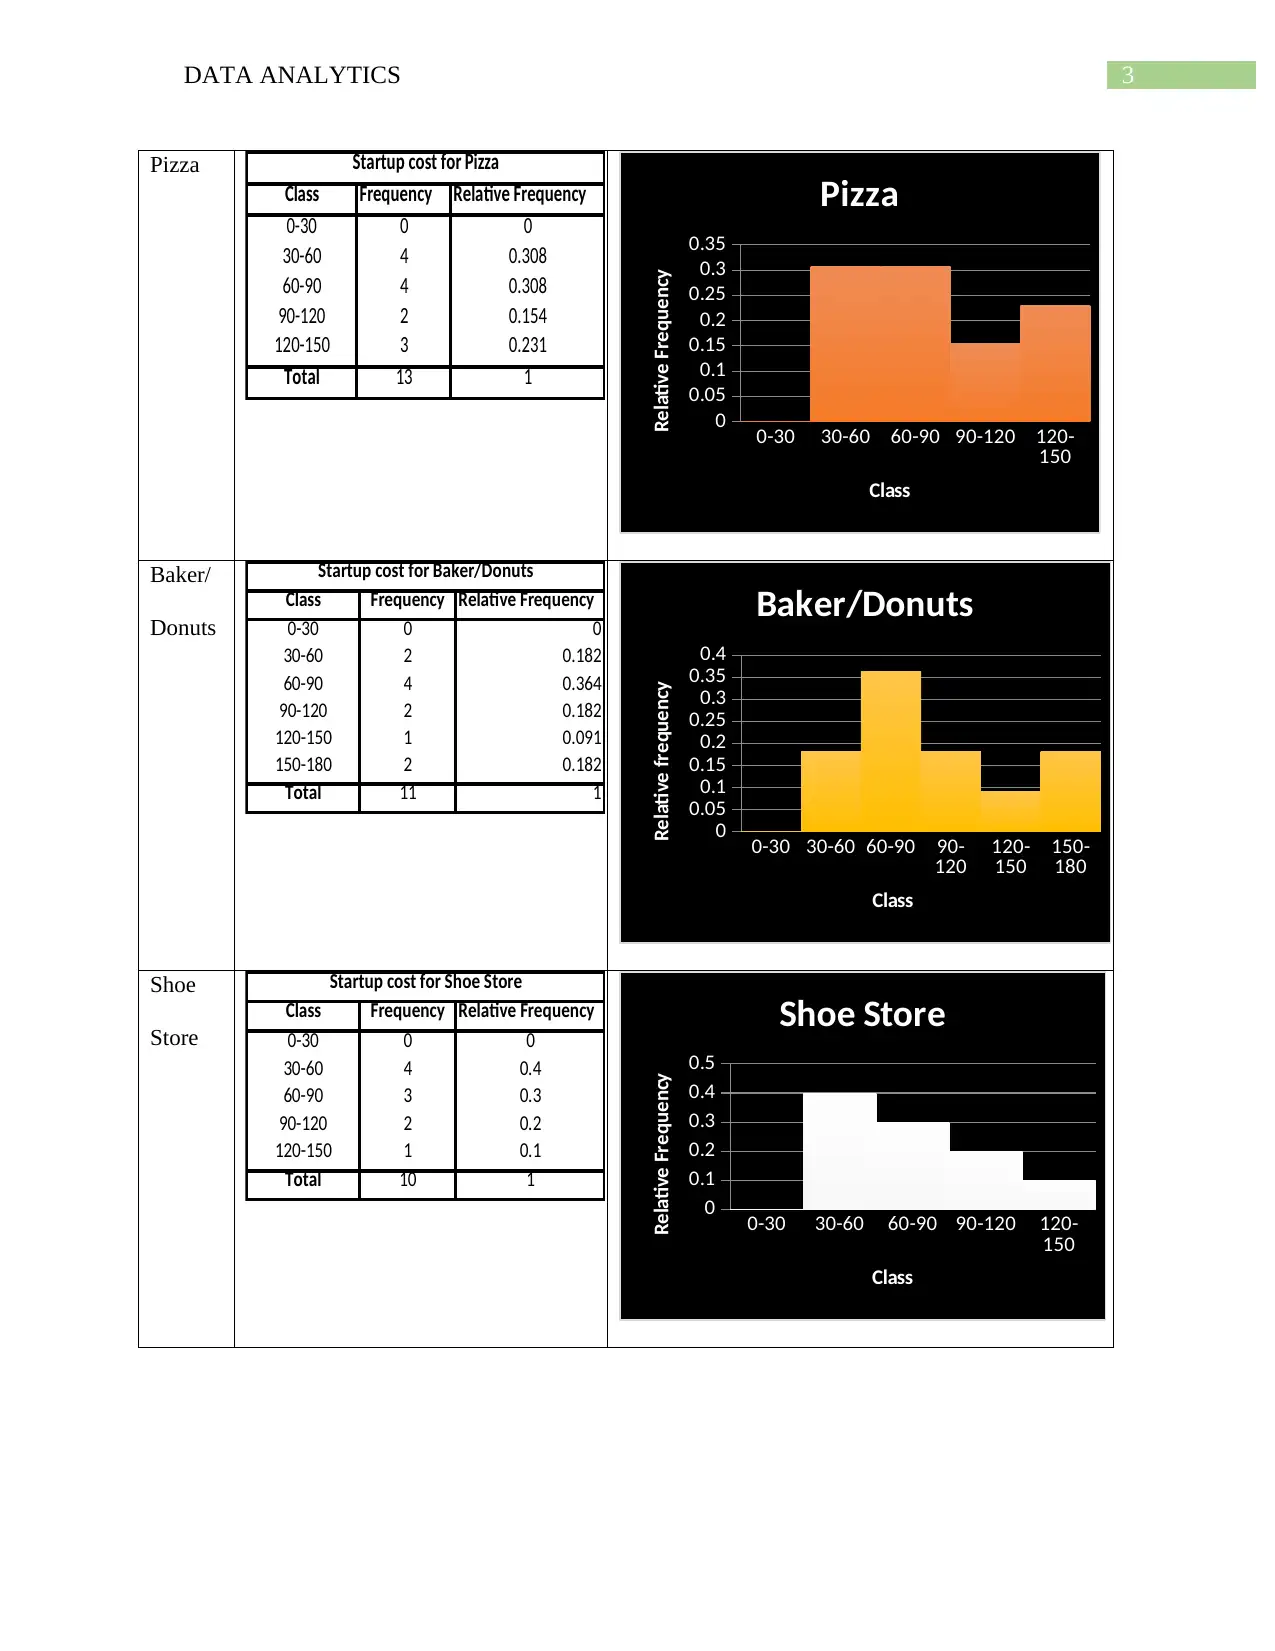
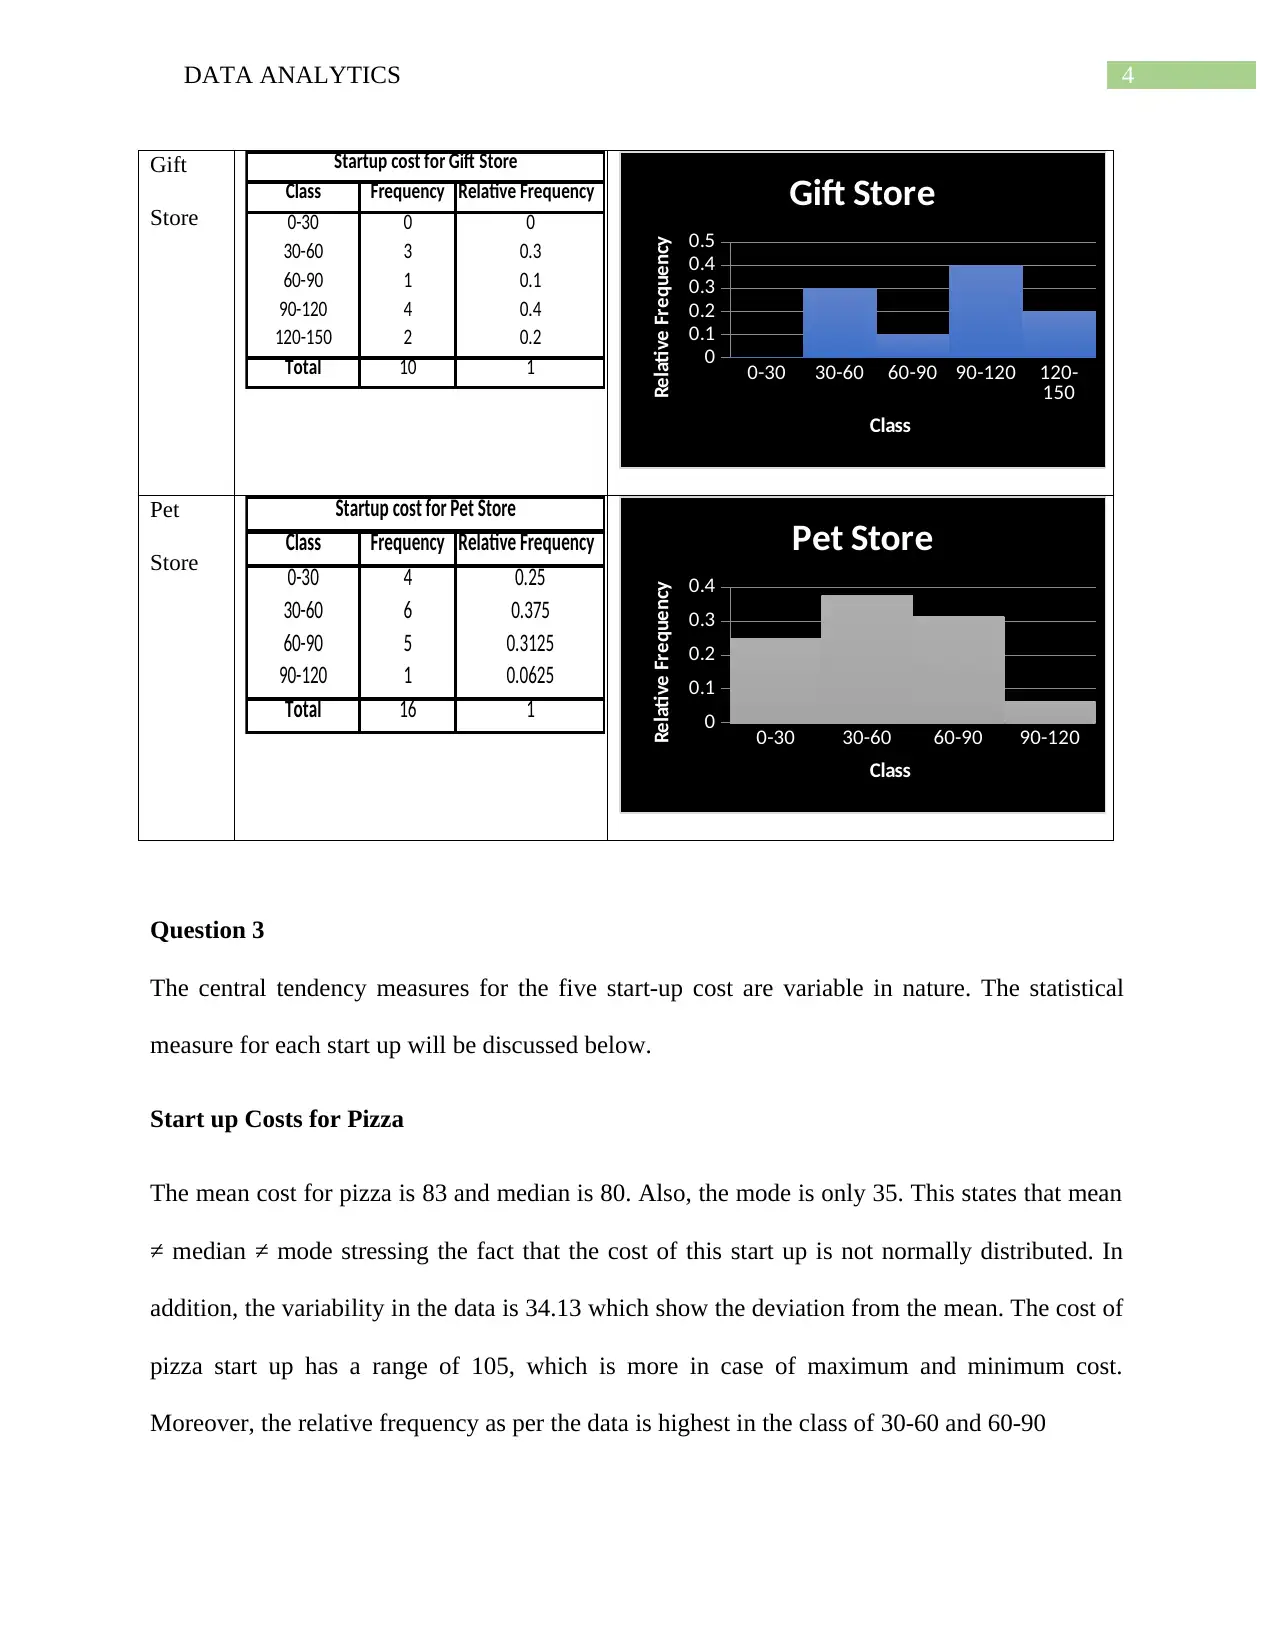
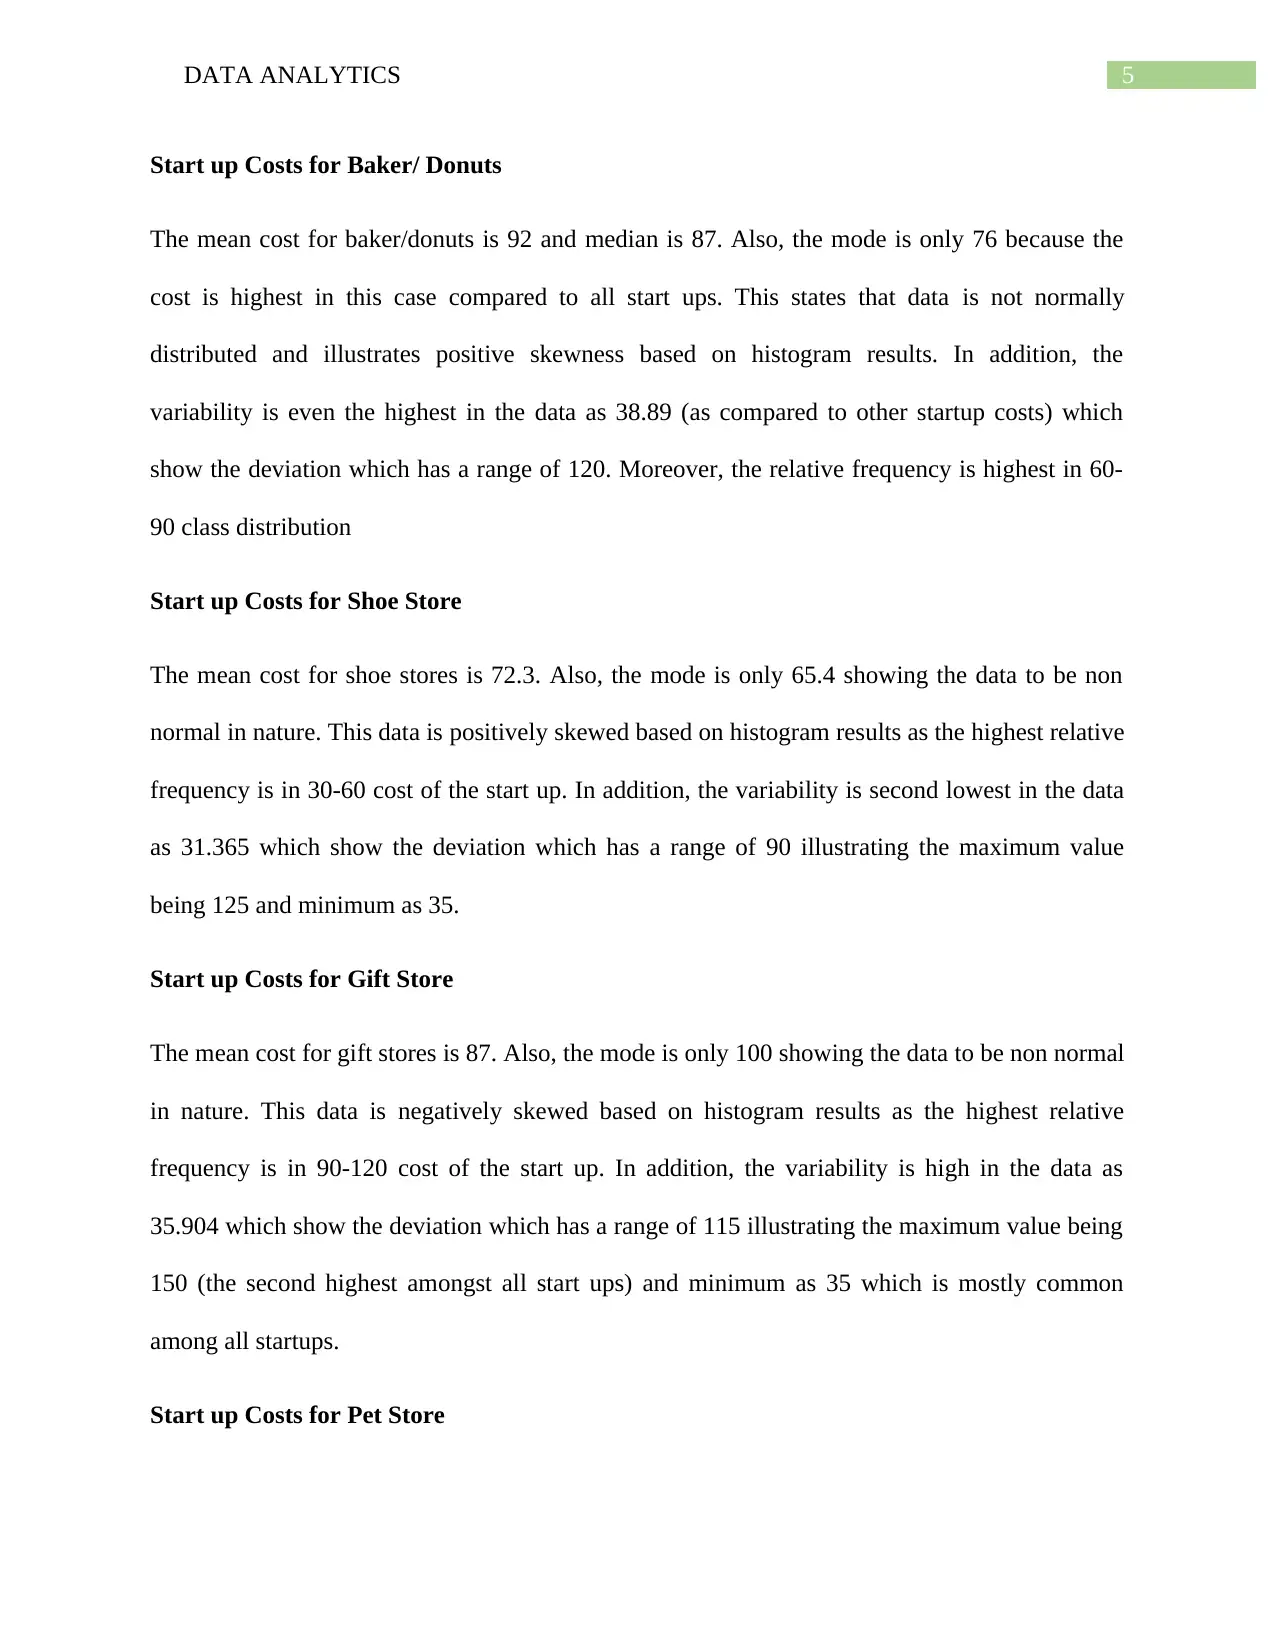
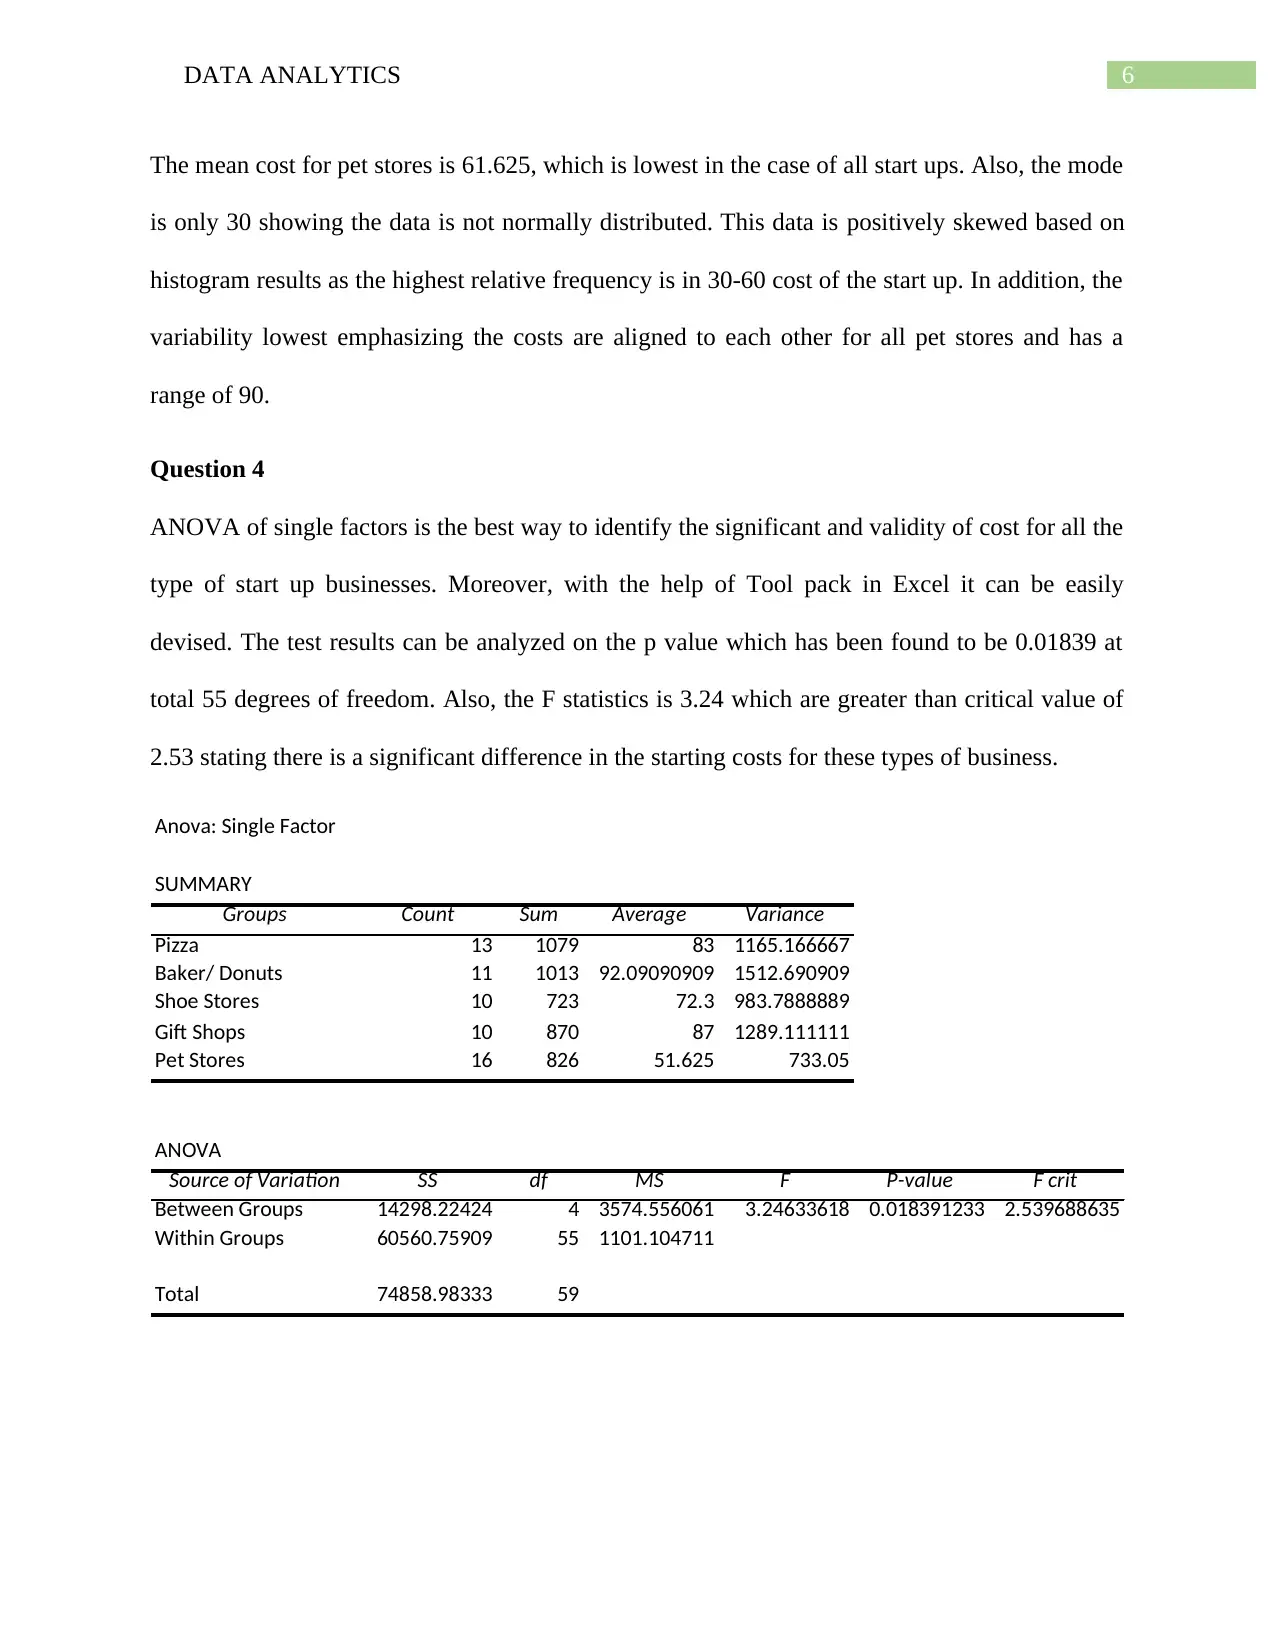
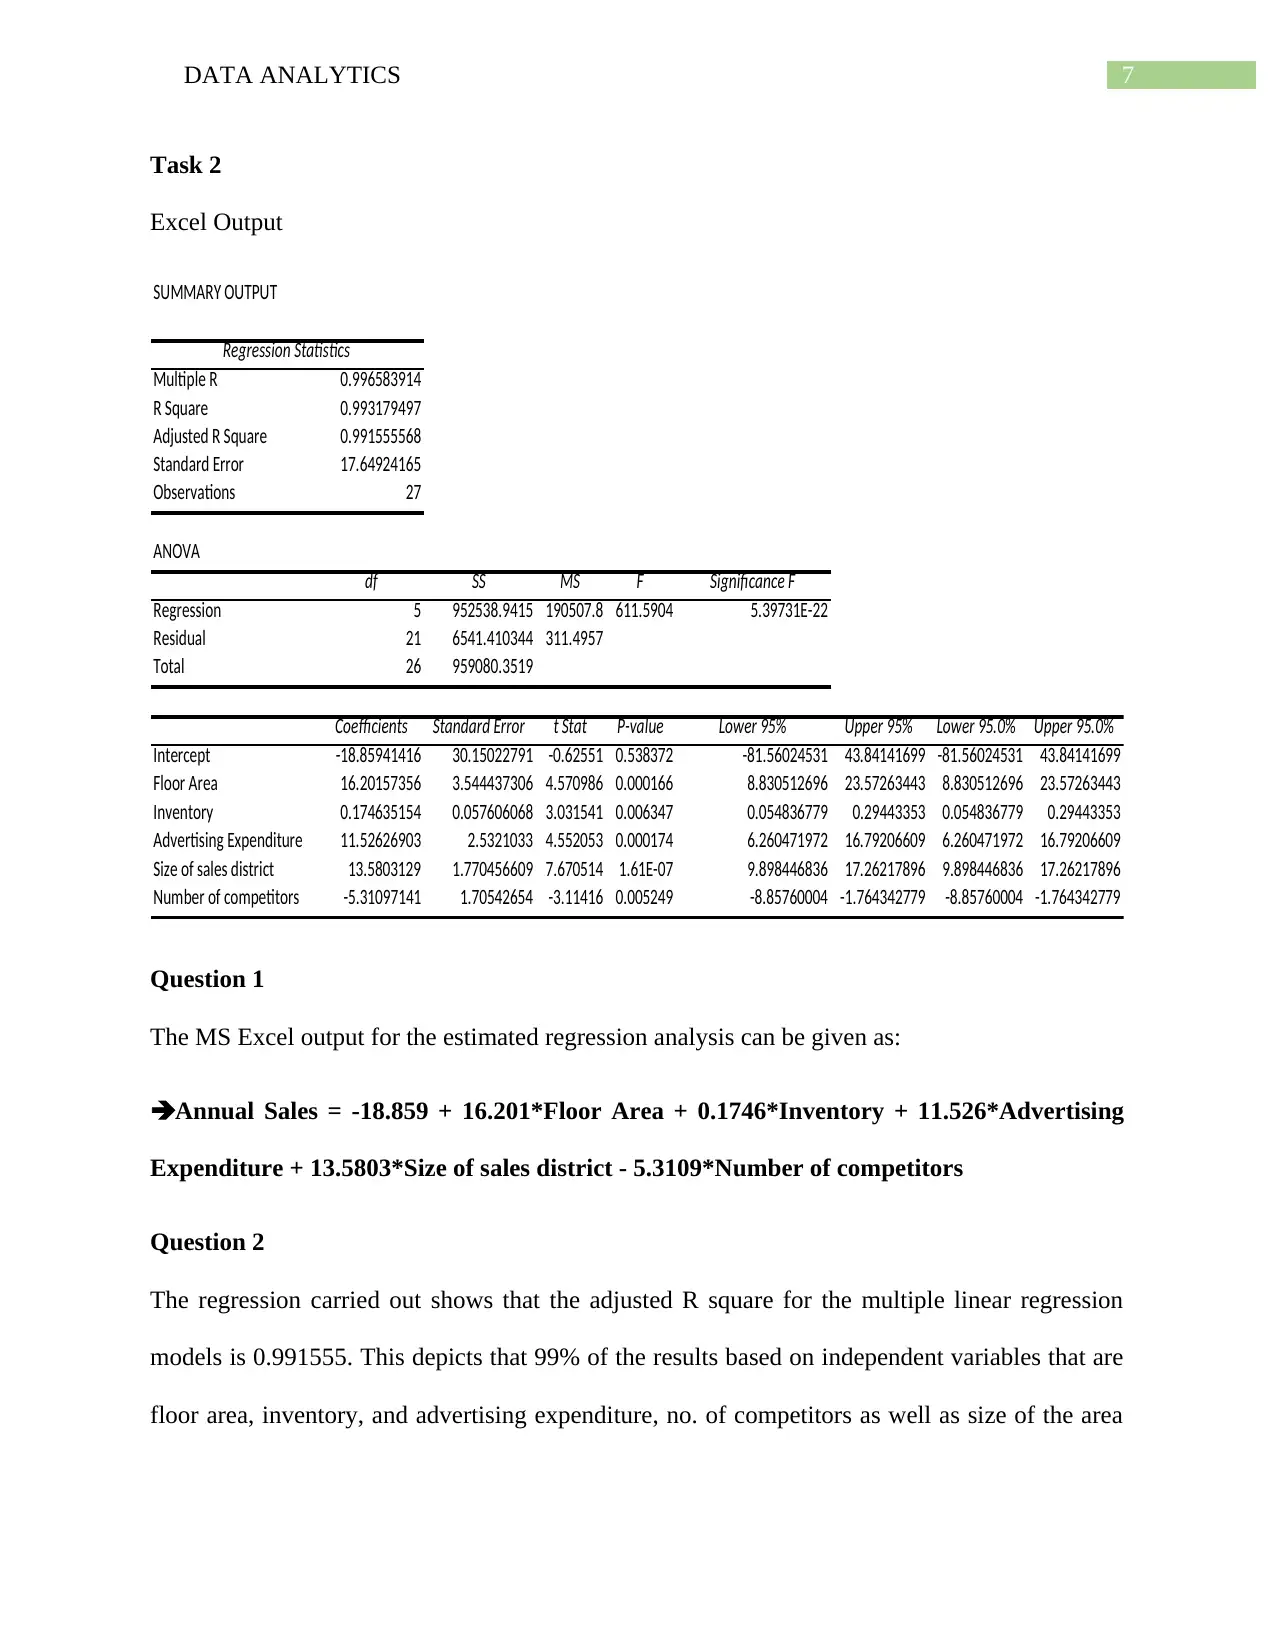
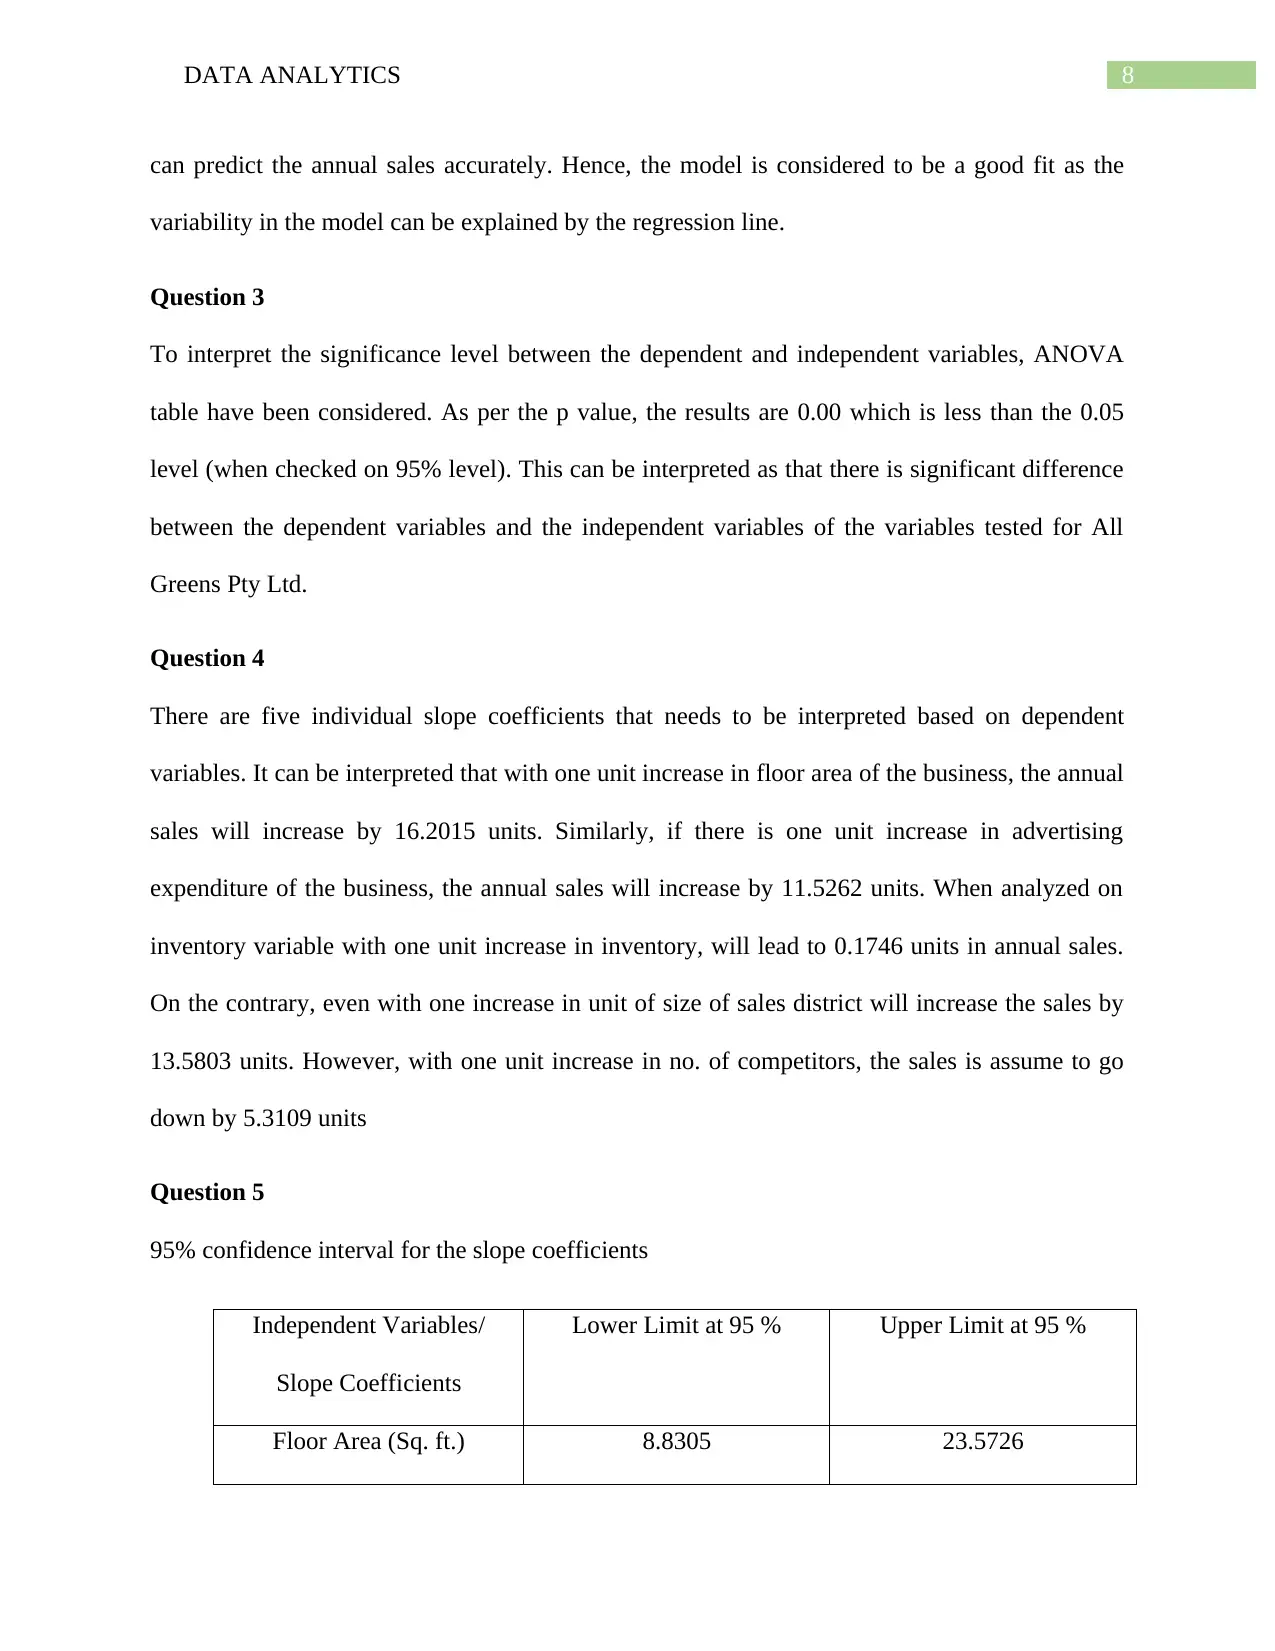
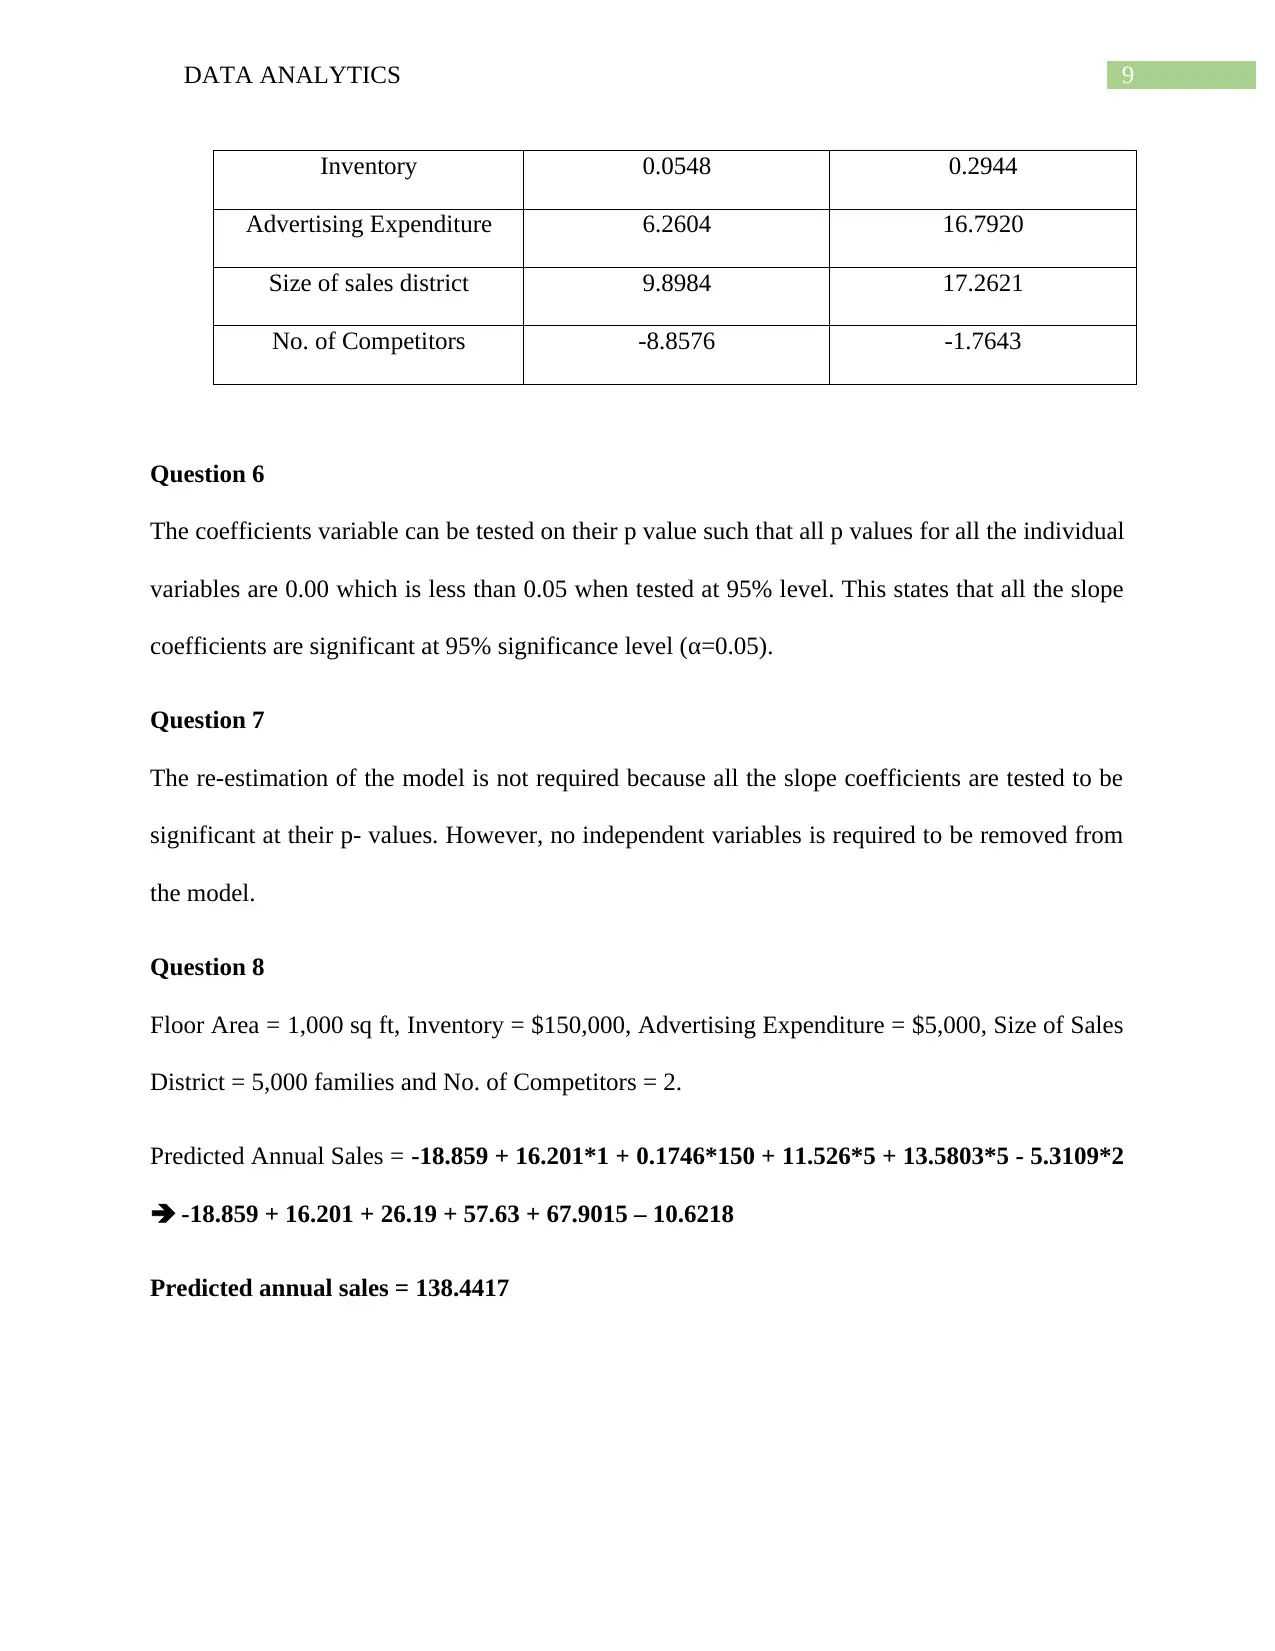
This assignment solution focuses on applying statistical analysis to business data. Task 1 involves descriptive statistics, including measures of central tendency (mean, median, mode) and dispersion (range, standard deviation, variance) for different types of businesses, utilizing Excel for calculations. It also includes frequency tables and histograms to illustrate relative distributions. Furthermore, the assignment explores the statistical measures for the start-up costs of various businesses, comparing mean, median, and mode to determine data distribution. ANOVA is used to identify the significance and validity of the cost for all types of start-up businesses. Task 2 delves into regression analysis, presenting an estimated regression model to predict annual sales based on floor area, inventory, advertising expenditure, size of sales district, and number of competitors. The solution interprets the adjusted R-square, significance levels, and individual slope coefficients, including the construction of confidence intervals. The document concludes with a predicted annual sales calculation using provided values for the independent variables.
1 out of 10
Related Documents


Your All-in-One AI-Powered Toolkit for Academic Success.
+13062052269
info@desklib.com
Available 24*7 on WhatsApp / Email
![[object Object]](/_next/static/media/star-bottom.7253800d.svg)
Copyright © 2020–2026 A2Z Services. All Rights Reserved. Developed and managed by ZUCOL.