Applied Statistics in Business: Data Analysis and Hypothesis Testing
VerifiedAdded on 2023/06/05
|13
|1286
|55
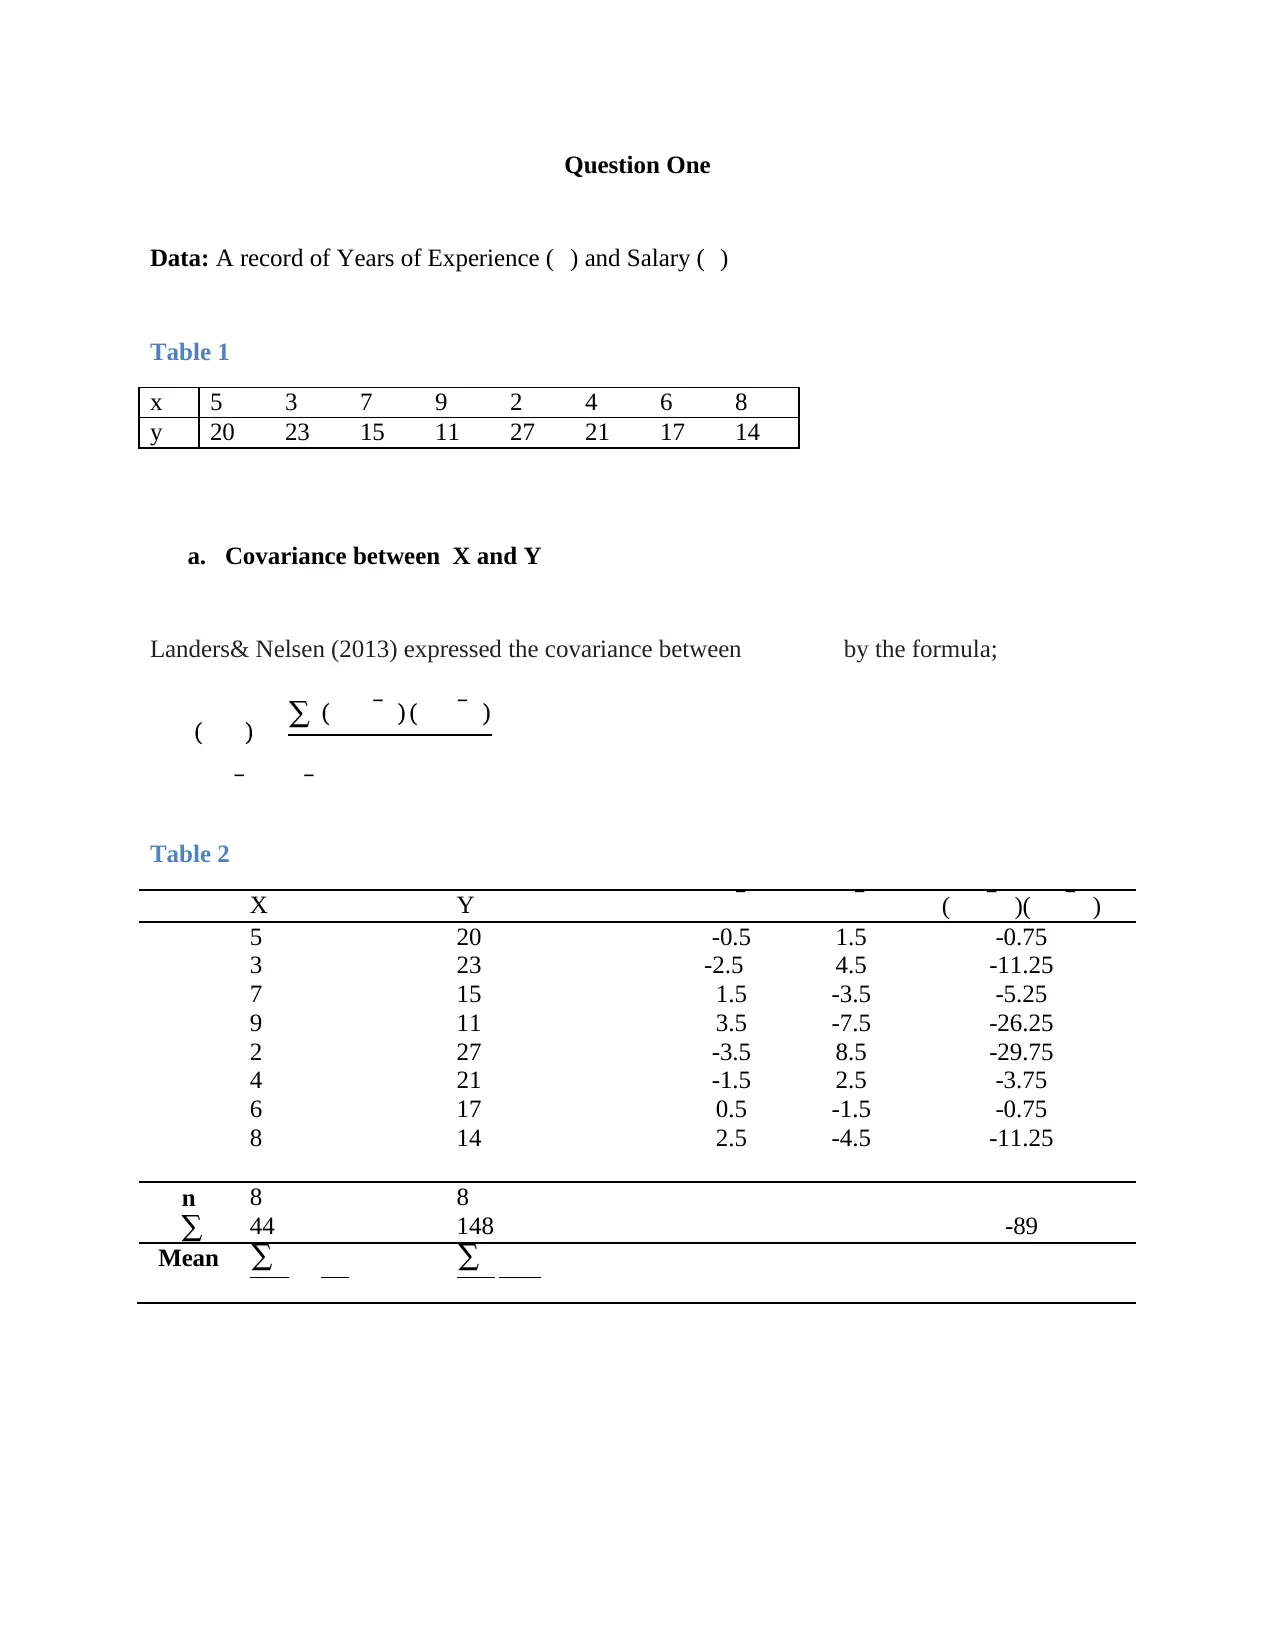
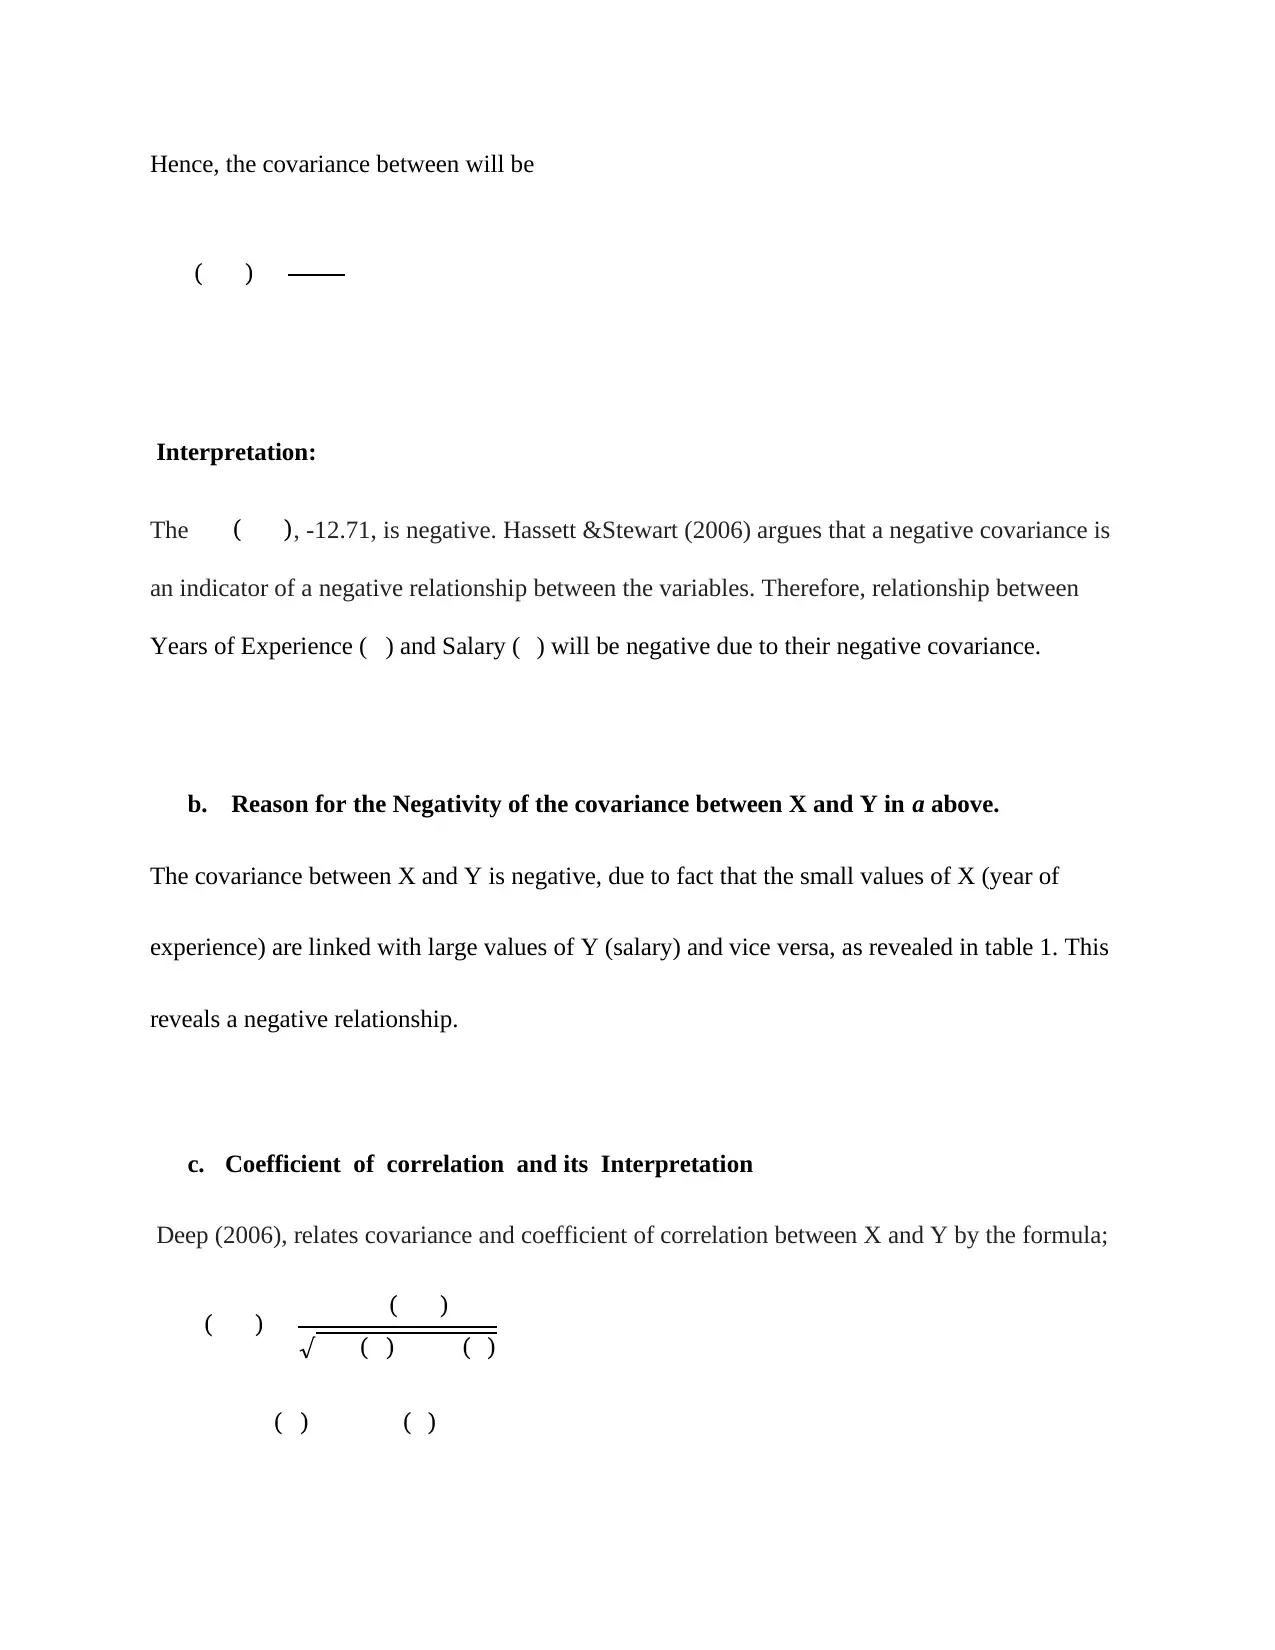
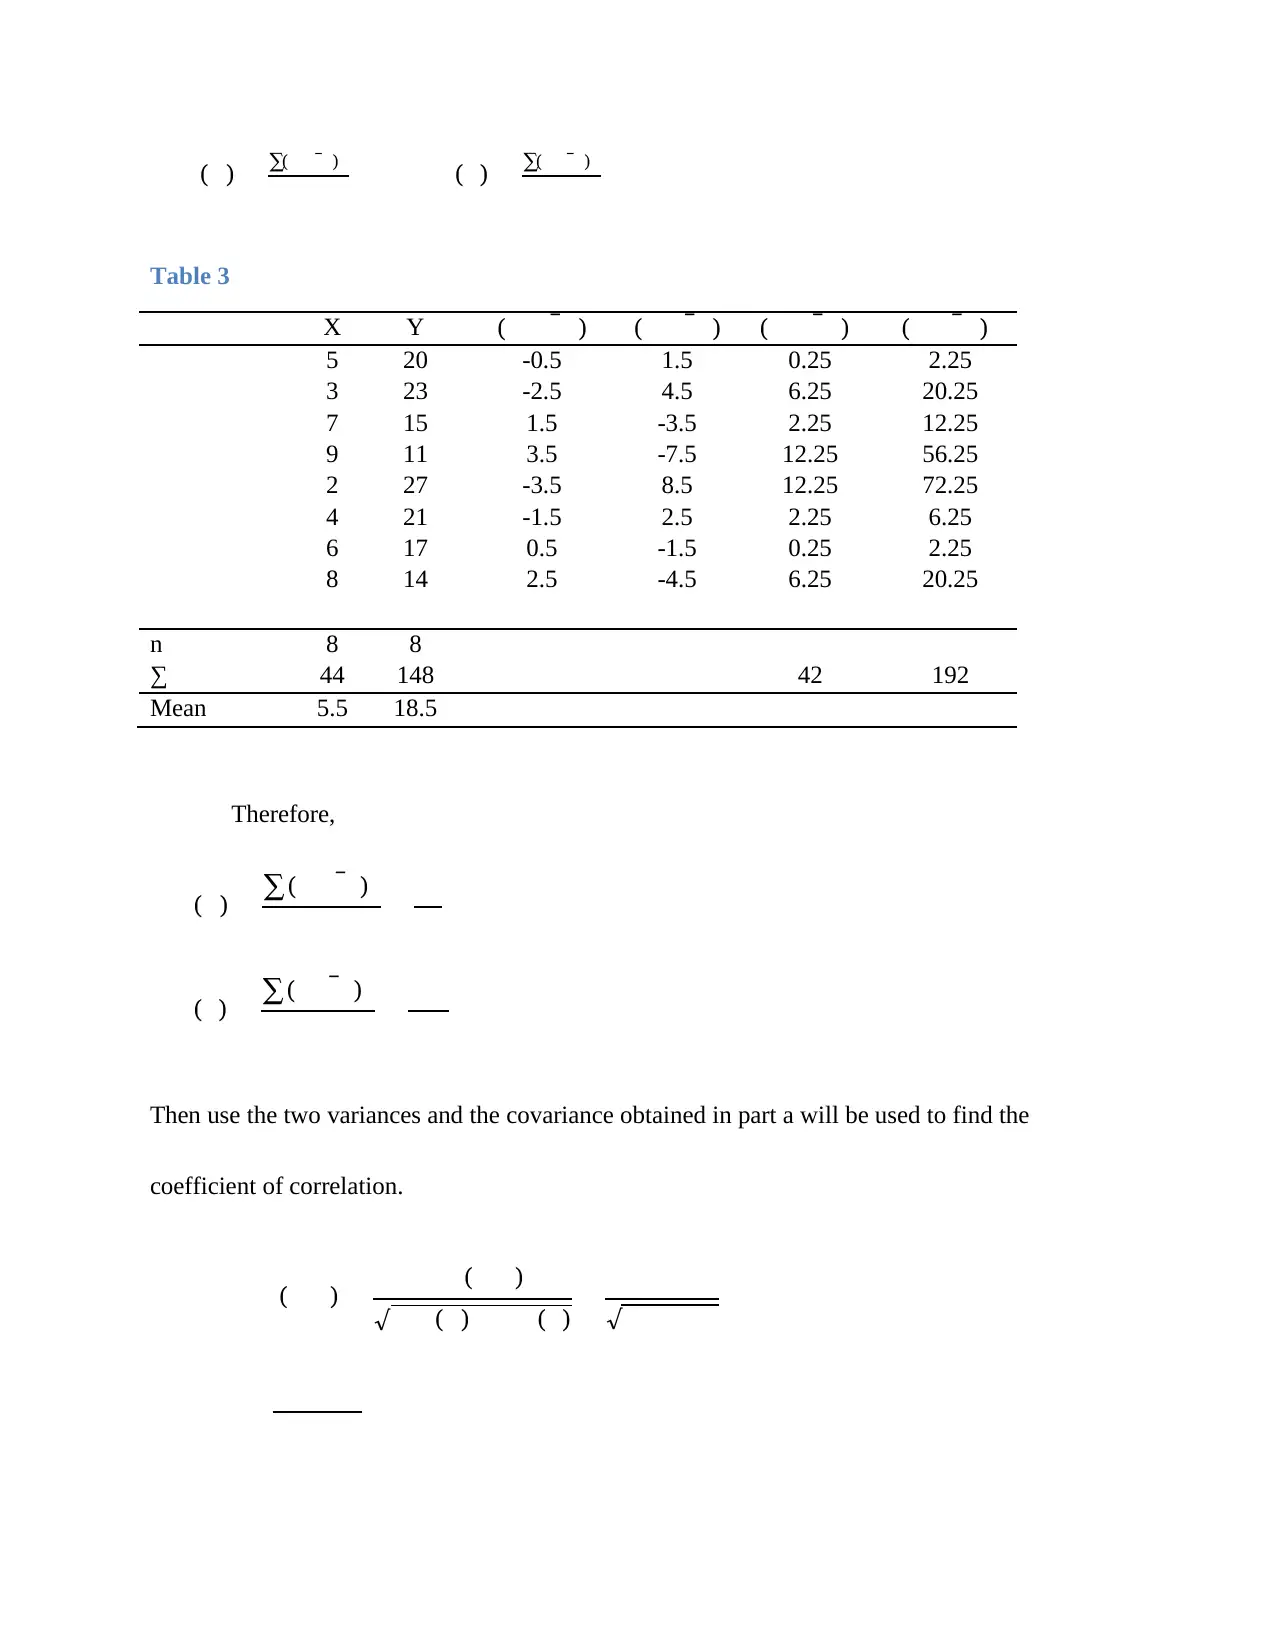
Homework Assignment
AI Summary
This document presents a comprehensive solution to a business statistics assignment, covering various statistical concepts and their application in business scenarios. The assignment includes problems related to covariance and correlation analysis, where the relationship between years of experience and salary is analyzed. It also delves into hypothesis testing, specifically focusing on Type II errors and the power of the test. Furthermore, the solution explores exponential distribution, calculating probabilities related to customer waiting times. The document provides detailed calculations and interpretations for each problem, offering a clear understanding of the statistical methods employed. Students can find more solved assignments and past papers on Desklib to aid in their studies.

1 out of 13
Related Documents


Your All-in-One AI-Powered Toolkit for Academic Success.
+13062052269
info@desklib.com
Available 24*7 on WhatsApp / Email
![[object Object]](/_next/static/media/star-bottom.7253800d.svg)
Copyright © 2020–2026 A2Z Services. All Rights Reserved. Developed and managed by ZUCOL.