Statistics for Business: Comparing Google and Amazon Stock Performance
VerifiedAdded on 2022/08/14
|4
|601
|13
Homework Assignment
AI Summary
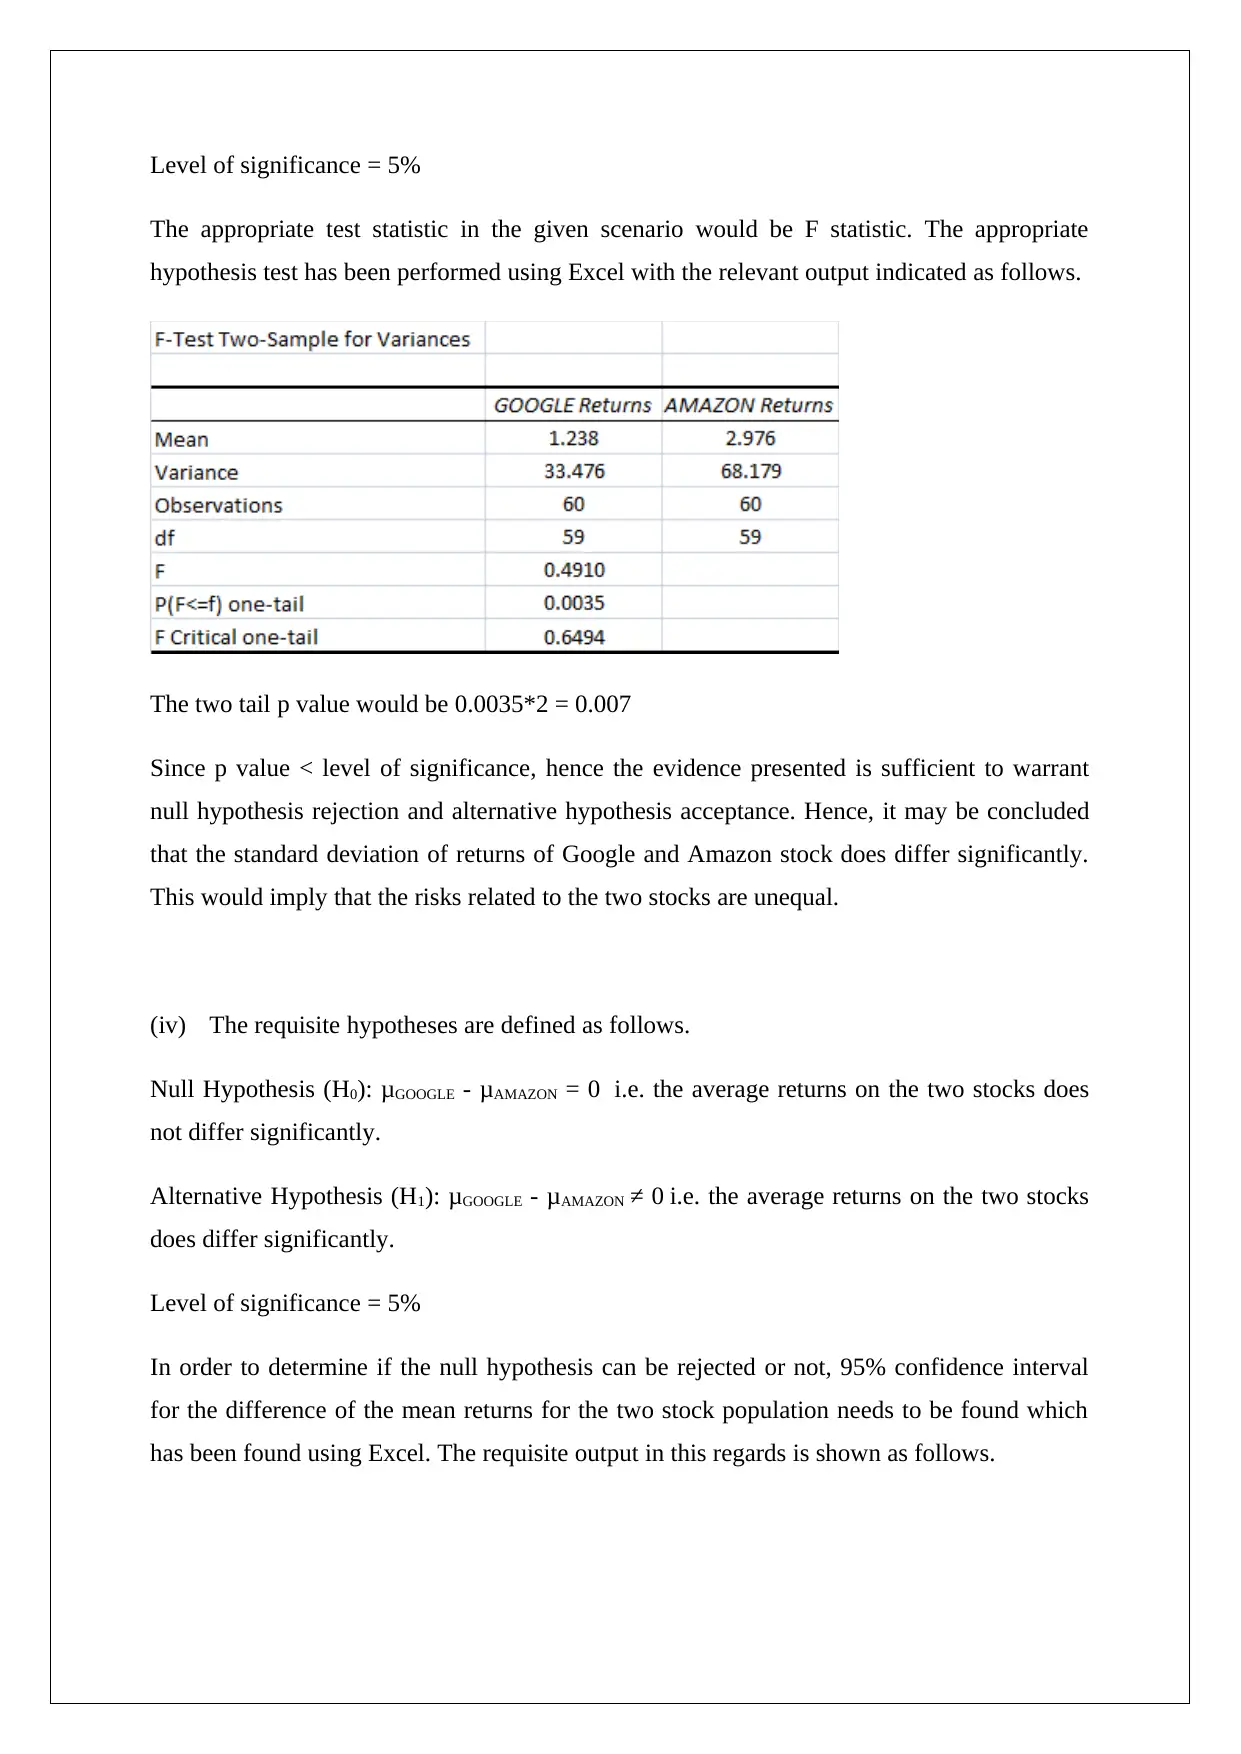
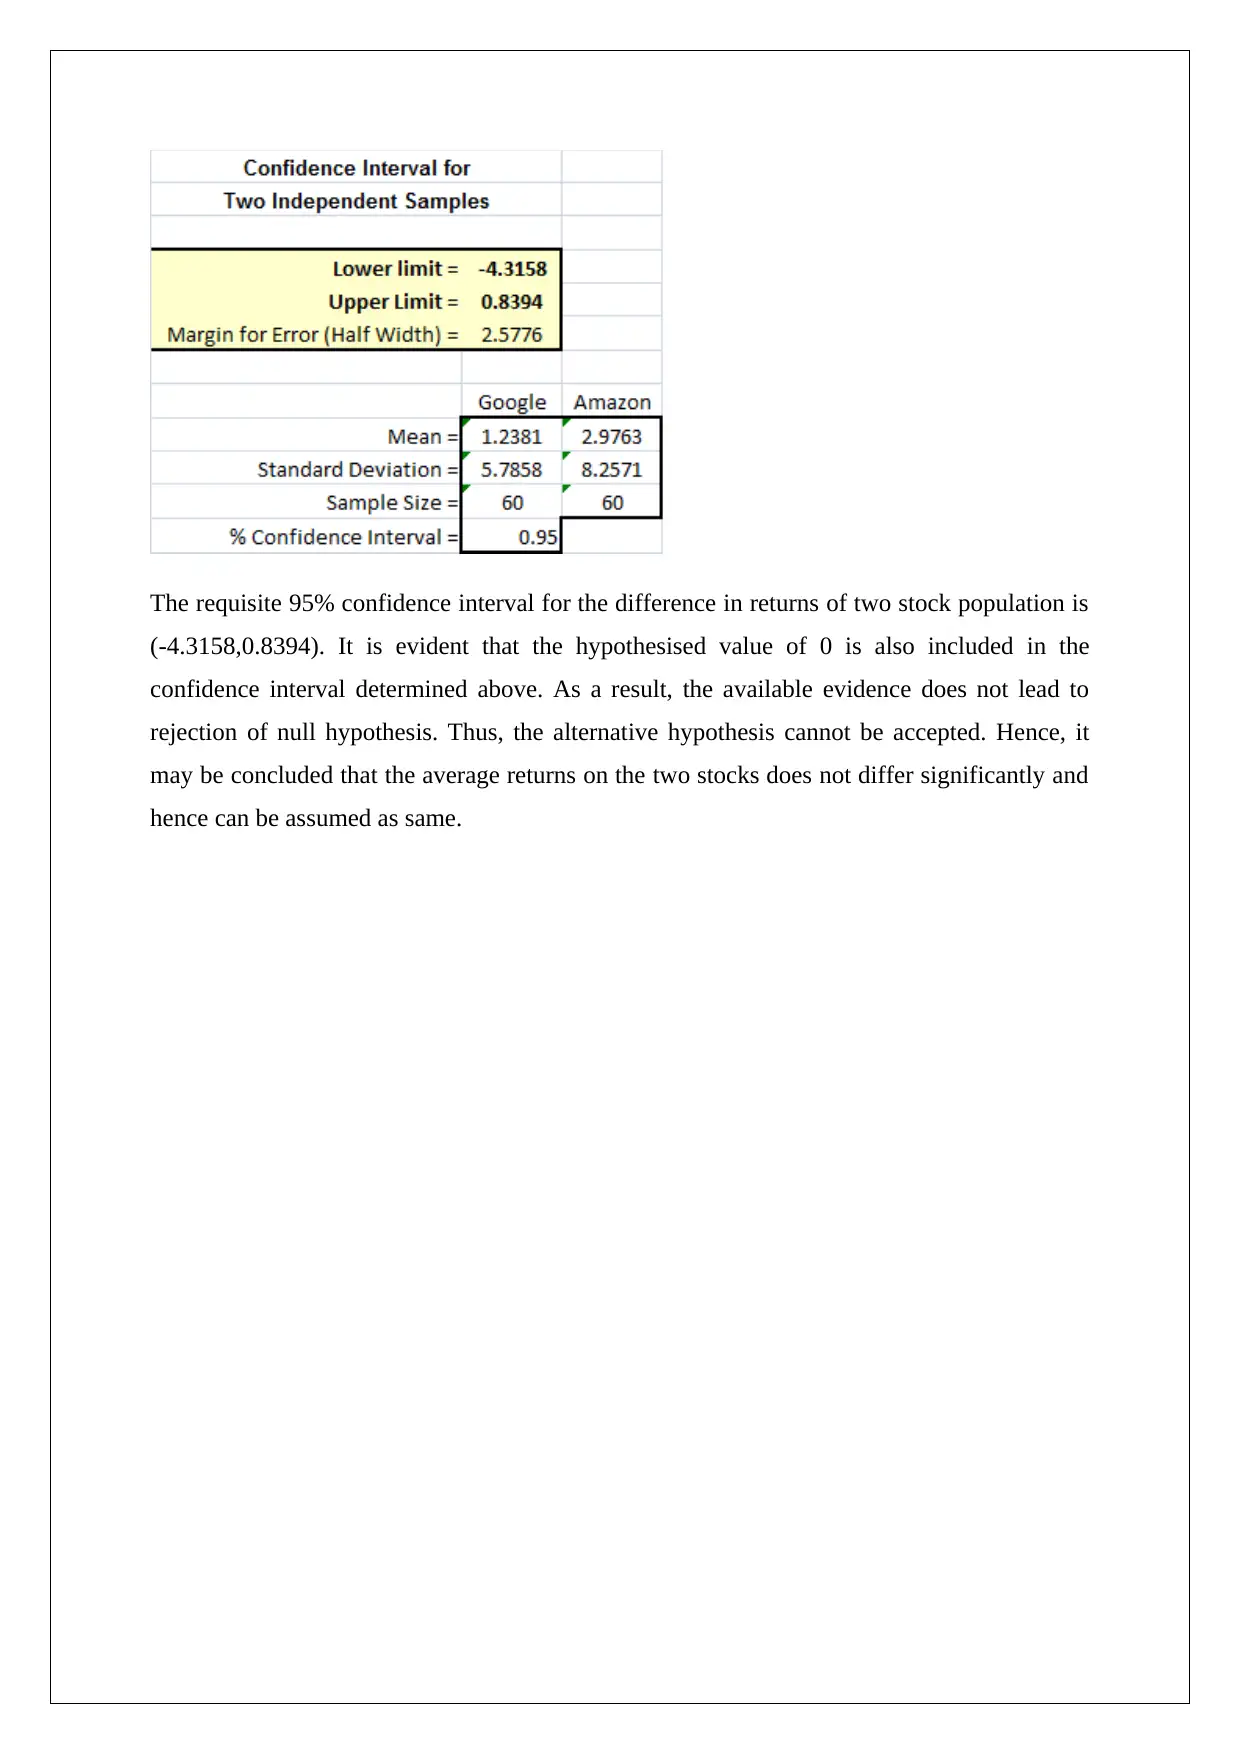
This assignment presents a comprehensive statistical analysis of Google and Amazon stock returns. It begins by defining the requisite hypotheses, including null and alternative hypotheses, and sets the level of significance. The solution employs t-tests to compare the average return of Google stock against a benchmark, and F-tests to compare the standard deviations of returns between Google and Amazon stocks. Furthermore, it calculates a 95% confidence interval for the difference in mean returns of the two stocks to determine if the returns differ significantly. The analysis includes p-value comparisons against the level of significance to either reject or accept the null hypotheses. The statistical tests and their corresponding results are presented with clear explanations and conclusions regarding the stock performance and associated risks. The assignment aims to provide a robust framework for statistical inference and decision-making in the context of financial data analysis.

1 out of 4
Related Documents


Your All-in-One AI-Powered Toolkit for Academic Success.
+13062052269
info@desklib.com
Available 24*7 on WhatsApp / Email
![[object Object]](/_next/static/media/star-bottom.7253800d.svg)
Copyright © 2020–2026 A2Z Services. All Rights Reserved. Developed and managed by ZUCOL.