TASK STATISTICS FOR MANAGEMENT TABLE OF CONTENTS INTRODUCTION
Added on 2020-06-04
21 Pages4763 Words104 Views
STATISTICS FOR MANAGEMENT

TABLE OF CONTENTS
INTRODUCTION...........................................................................................................................1
TASK 1............................................................................................................................................1
(a)Testing of hypothesis..............................................................................................................1
(b)Identification of difference between male and female income level in private sector............2
© Earning time chart for year 2009 to 2016................................................................................3
d) Determining annual growth rate..............................................................................................3
.....................................................................................................................................................4
TASK 2............................................................................................................................................5
Section A.........................................................................................................................................5
2.1 Graphical presentation of data...............................................................................................5
2.2 Analysis of data.....................................................................................................................5
2.3 Report on analysis of students performance in the exam......................................................8
Section B..........................................................................................................................................9
2.4 Line of best fit........................................................................................................................9
TASK 3..........................................................................................................................................11
(a)Number of delieveries made in a years.................................................................................11
(b) Deliveries made on each round............................................................................................11
©Economic order quantity.........................................................................................................11
(d) Comparison of EOQ and cost..............................................................................................12
TASK 4..........................................................................................................................................14
4.1 Evaluation of figures by using different charts for number of houses with different
bedrooms....................................................................................................................................14
4.2 Relationship between number of bedrooms and their prices in varied streets....................16
CONCLUSION..............................................................................................................................17
REFERENCES..............................................................................................................................18
Figure 1Earning time chart from year 2009 to 2016.......................................................................3
Figure 2Graphical representation of percentage change in variable................................................4
Figure 3Student marks trends..........................................................................................................5
Figure 4Number of bedrooms in varied areas...............................................................................14
Figure 5Number of homes having specific number of bedrooms in Church Lane.......................14
Figure 6Number of homes having specific number of bedrooms in Church Lane.......................15
Figure 7Number of homes having specific number of bedrooms in Church Lane.......................15
Figure 8Number of bedrooms and house prices............................................................................16
Table 1T table..................................................................................................................................1
Table 2T test for male and female income in private sector............................................................2
Table 3Percentage change in income level in public and private sector across male and female...3
Table 4Calculation of mean and standard deviation........................................................................5
Table 5Number of bottles transported...........................................................................................11
Table6 Calculation of economic order quantity............................................................................11
Table 7 Cost at different level of EOQ..........................................................................................12
INTRODUCTION
Analytics is the one of the growing domain in the most of nations of the world. In
current time period descriptive statistics tools are applied on dataset. By analyzing facts and
figures lots of facts are identified. Apart from this, charts in respect to different variables are
prepared in the report and same are analyzed in proper manner. In middle part of the report
varied calculations like economic order quantity are performed and on that basis varied facts are
identified. Apart from this, different areas houses data in terms of bedrooms are analyzed by
preparing pie and bar charts. Trends that prevailed in these areas are identified through charts. It
can be said that extensive analysis is done in the present research study. At end of the research
report, coorelation analysis is done and by doing so relationship is identified between multiple
variables. Along with this, conclusion section is also prepared and in this way research work is
carried out.
TASK 1
(a)Testing of hypothesis
H0: There is no significent difference betweeen male income level in public sector and female
income level in public sector.
H1: There is significent difference betweeen male income level in public sector and female
income level in public sector.
Table 1T table
Male Public
sector
Female Public
sector
Mean 32276.625 26929.875
Variance 1449962.268 977868.4107
Observations 8 8
Hypothesized Mean Difference 0
df 13
t Stat 9.705673424
P(T<=t) one-tail 1.2709E-07
t Critical one-tail 1.770933396
P(T<=t) two-tail 2.54179E-07
t Critical two-tail 2.160368656
Interpretation
1 | P a g e
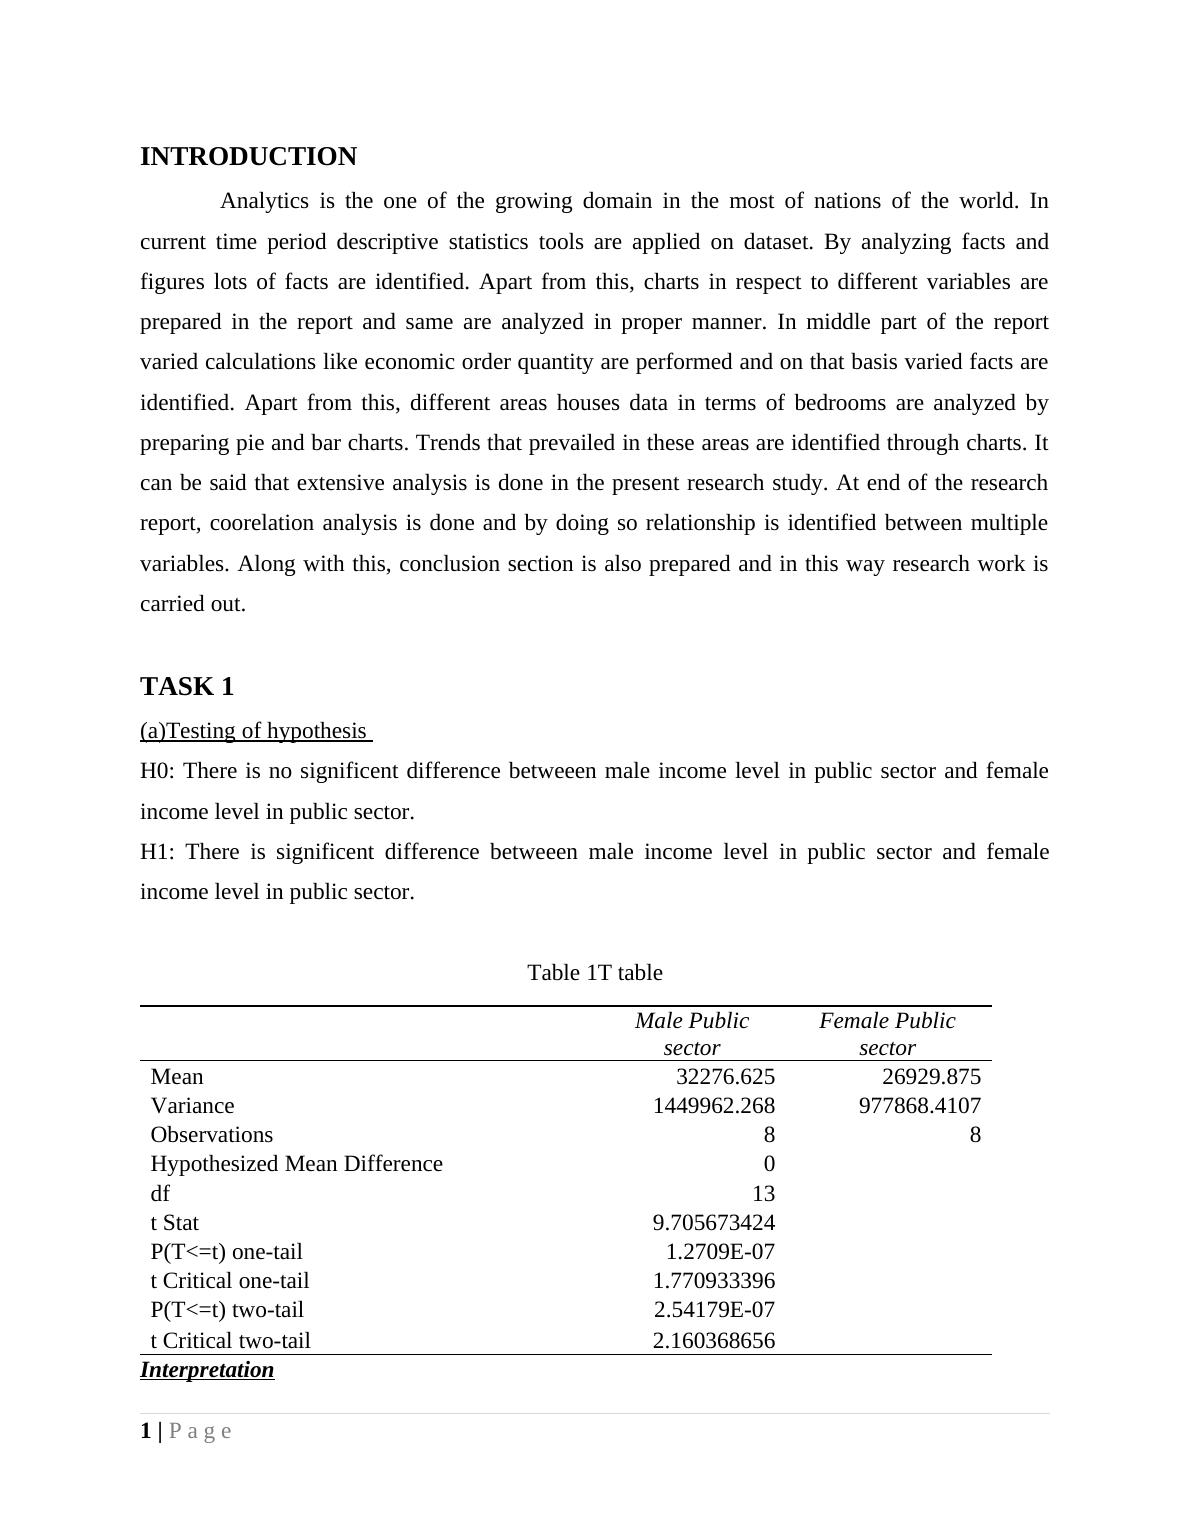
T test is the one of the important method that is used to identify whether there is
significent difference between multiple variables. It can be observed that value of level of
significence is 2.16>0.05 and this is indicating that there is no significent mean difference
between variables. It can be said that almost same salary is issued to male and female at the
workplace. Mean value of salary in case of male is 32276.62 and same for female is 26929.87. It
can be said that higher amount of salary is paid to male relative to female. However, in temrs of
variation at 95% confidence interval there is similarity in income level of individuals. It can be
said that there is no big difference in income level of male and female. On basis of facts it can be
said that there is significent importance of t test for the individuals.
(b)Identification of difference between male and female income level in private sector
Table 2T test for male and female income in private sector
Male Private sector
Female Private
sector
Mean 28062.875 20541.25
Variance 840242.6964 988729.9286
Observations 8 8
Hypothesized Mean Difference 0
df 14
t Stat 15.73088181
P(T<=t) one-tail 1.35387E-10
t Critical one-tail 1.761310136
P(T<=t) two-tail 2.70773E-10
t Critical two-tail 2.144786688
Interpretation
It can be observed from the table that value of level of significence is 2.144>0.05 and this
is again reflecting that there is no significent difference between male and female in the private
sector in terms of income level. On average basis male are earning amount of 28062.87 in private
sector and female are earning 20541.25. It can be said that again in th private sector higher
amount of salary is offered to male then female. Thus, overall it can be said that in private sector
and public sector both male earning level is higher then same of female. So, it can be said that to
some extent there is difference between income level of both and in both sectors difference is
made in respect to gender. It can be said that there is great significence of the t test for the
analysis purpose. In T test basically t distribution is taken in to account for calculation purpose.
T distribution is similar to z distribution and there is small difference between both. Hence, it
2 | P a g e
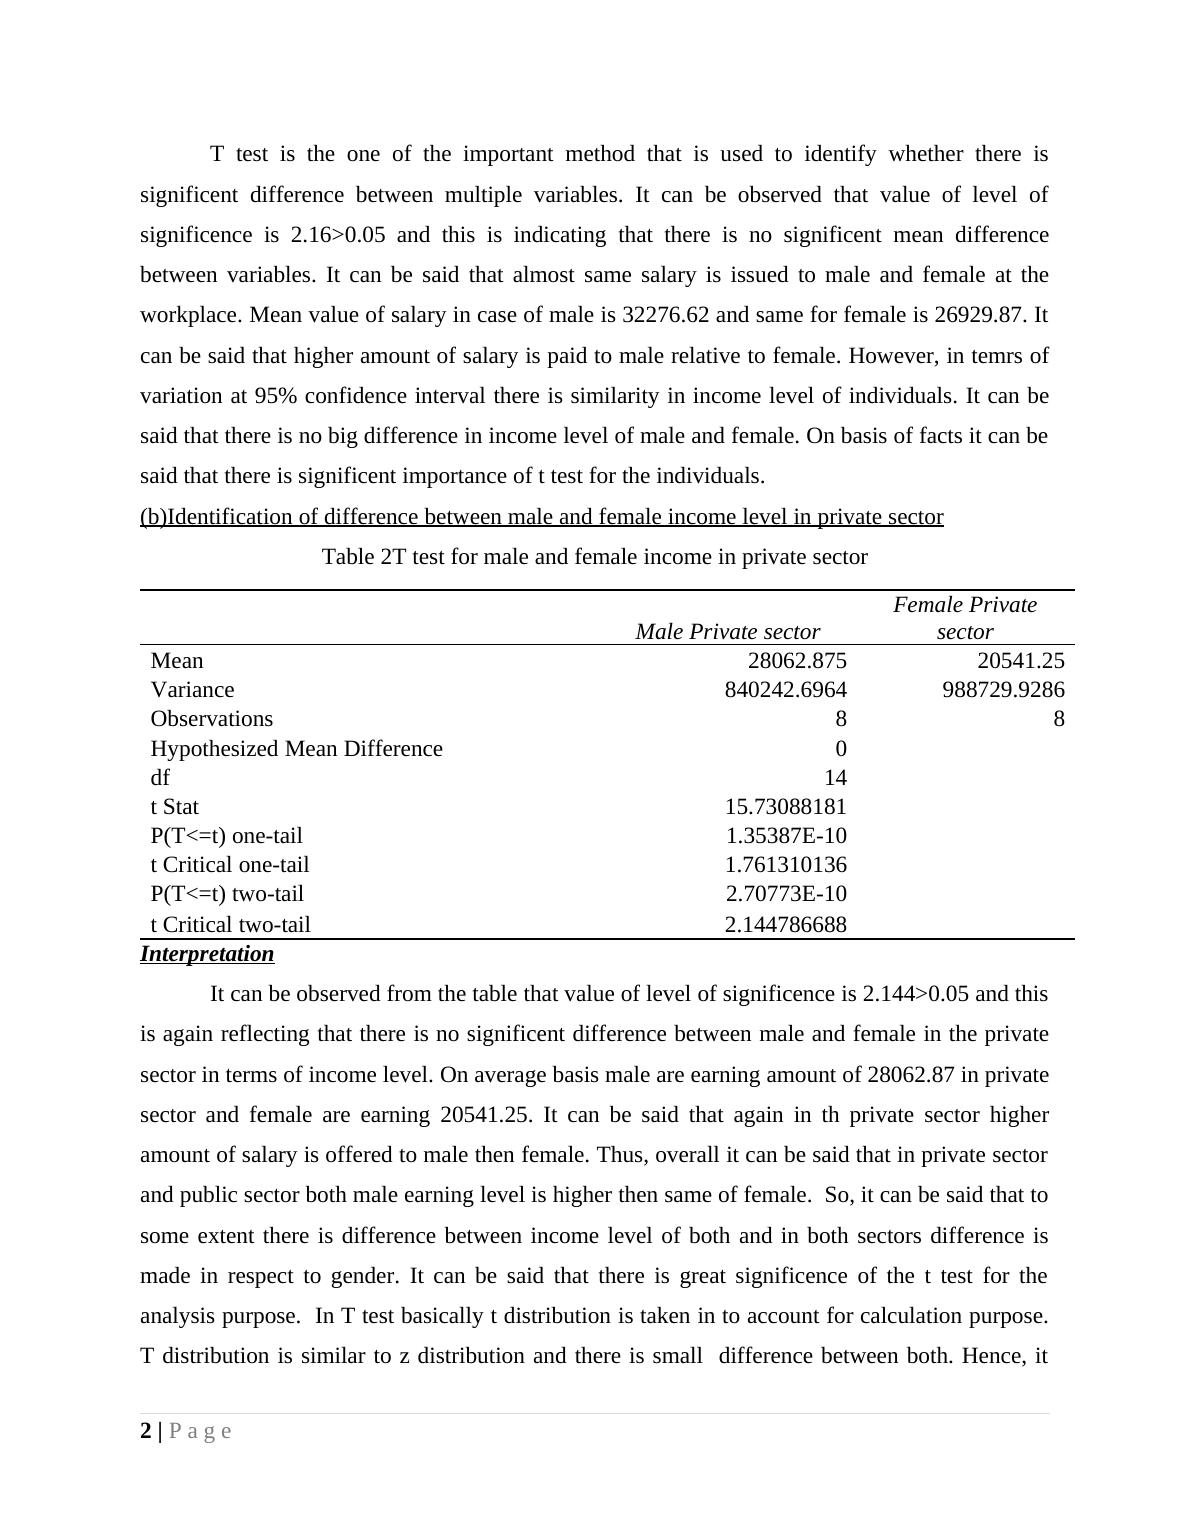
can be said that t distribution technique have wide application and due to this reaosn t test is
quite popular among the analysts.
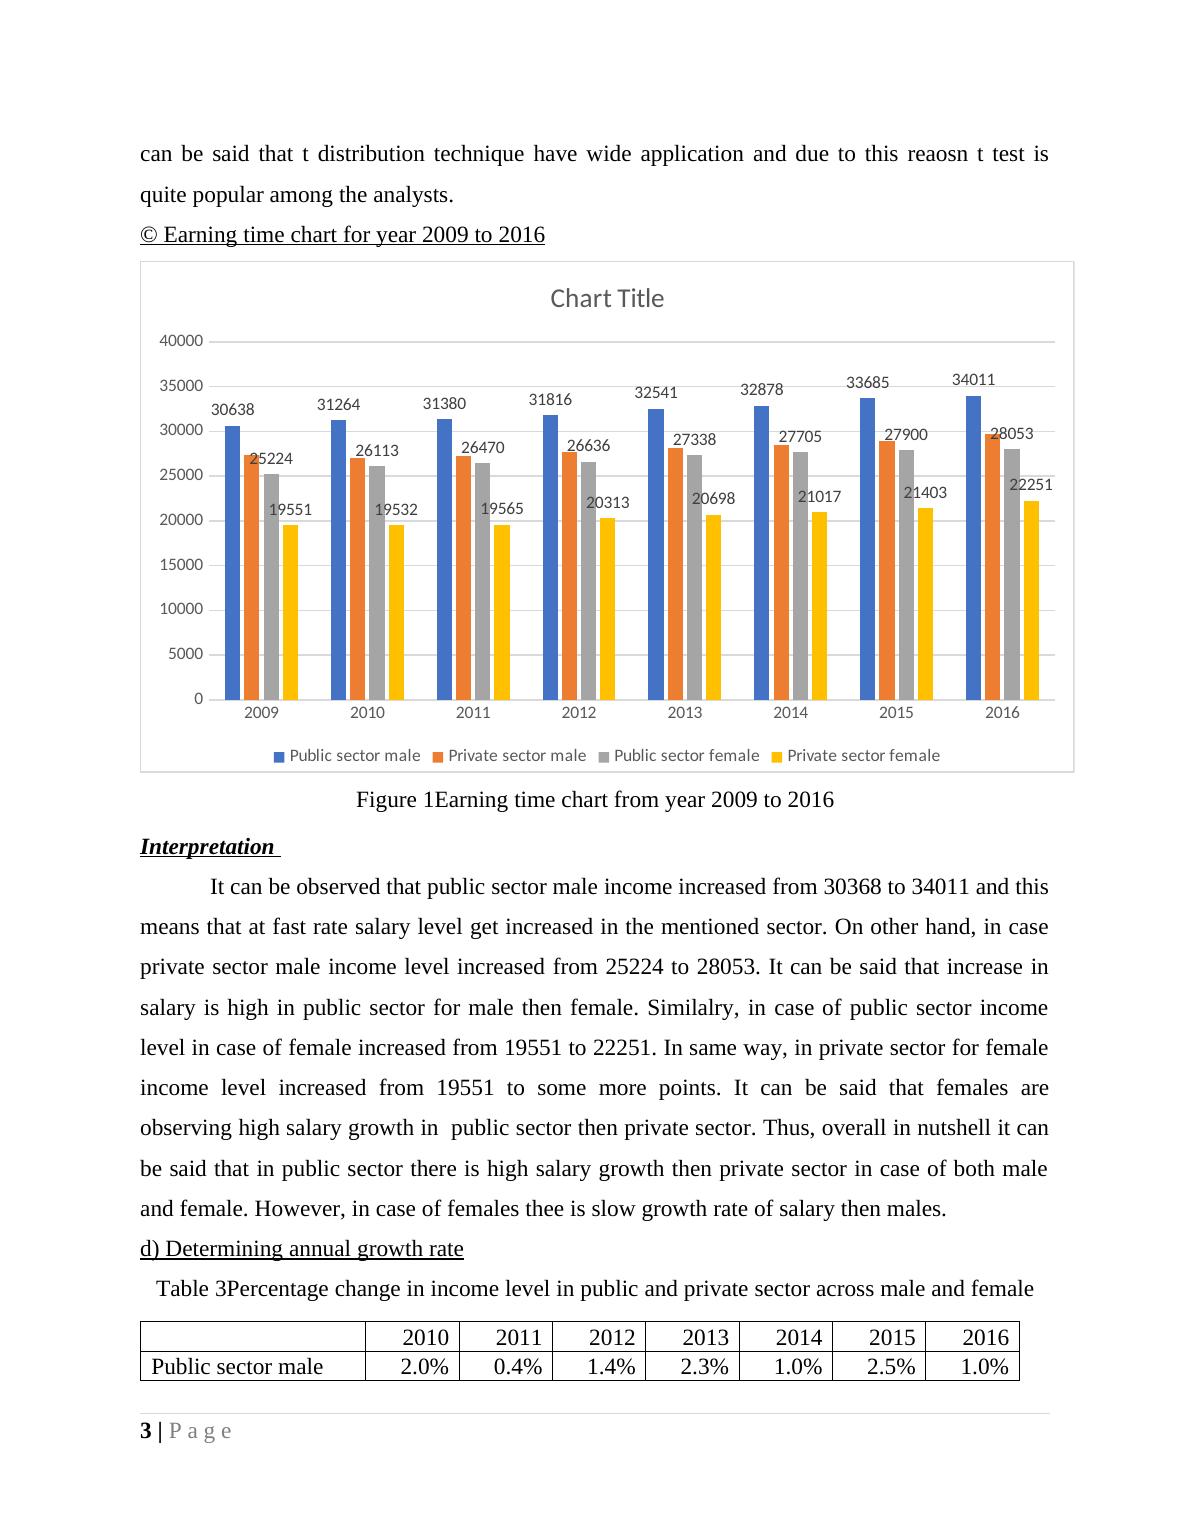
© Earning time chart for year 2009 to 2016
2009 2010 2011 2012 2013 2014 2015 2016
0
5000
10000
15000
20000
25000
30000
35000
40000
30638 31264 31380 31816 32541 32878 33685 34011
25224 26113 26470 26636 27338 27705 27900 28053
19551 19532 19565 20313 20698 21017 21403 22251
Chart Title
Public sector male Private sector male Public sector female Private sector female
Figure 1Earning time chart from year 2009 to 2016
Interpretation
It can be observed that public sector male income increased from 30368 to 34011 and this
means that at fast rate salary level get increased in the mentioned sector. On other hand, in case
private sector male income level increased from 25224 to 28053. It can be said that increase in
salary is high in public sector for male then female. Similalry, in case of public sector income
level in case of female increased from 19551 to 22251. In same way, in private sector for female
income level increased from 19551 to some more points. It can be said that females are
observing high salary growth in public sector then private sector. Thus, overall in nutshell it can
be said that in public sector there is high salary growth then private sector in case of both male
and female. However, in case of females thee is slow growth rate of salary then males.
d) Determining annual growth rate
Table 3Percentage change in income level in public and private sector across male and female
2010 2011 2012 2013 2014 2015 2016
Public sector male 2.0% 0.4% 1.4% 2.3% 1.0% 2.5% 1.0%
3 | P a g e
quite popular among the analysts.
© Earning time chart for year 2009 to 2016
2009 2010 2011 2012 2013 2014 2015 2016
0
5000
10000
15000
20000
25000
30000
35000
40000
30638 31264 31380 31816 32541 32878 33685 34011
25224 26113 26470 26636 27338 27705 27900 28053
19551 19532 19565 20313 20698 21017 21403 22251
Chart Title
Public sector male Private sector male Public sector female Private sector female
Figure 1Earning time chart from year 2009 to 2016
Interpretation
It can be observed that public sector male income increased from 30368 to 34011 and this
means that at fast rate salary level get increased in the mentioned sector. On other hand, in case
private sector male income level increased from 25224 to 28053. It can be said that increase in
salary is high in public sector for male then female. Similalry, in case of public sector income
level in case of female increased from 19551 to 22251. In same way, in private sector for female
income level increased from 19551 to some more points. It can be said that females are
observing high salary growth in public sector then private sector. Thus, overall in nutshell it can
be said that in public sector there is high salary growth then private sector in case of both male
and female. However, in case of females thee is slow growth rate of salary then males.
d) Determining annual growth rate
Table 3Percentage change in income level in public and private sector across male and female
2010 2011 2012 2013 2014 2015 2016
Public sector male 2.0% 0.4% 1.4% 2.3% 1.0% 2.5% 1.0%
3 | P a g e
End of preview
Want to access all the pages? Upload your documents or become a member.
Related Documents
Statistics for Management Researchlg...
|20
|4601
|57
Report on Statistics for Managementlg...
|20
|3454
|98
Statistical Analysis of Gross Annual Earnings in Public and Private Sectorlg...
|19
|3281
|322
Report on Charting of Variableslg...
|19
|2394
|69
Statistical Statistics for Management Table of Contents Interruptionlg...
|19
|2556
|227
Statistics for Management : Assignmentlg...
|22
|5114
|86