Statistics for Management Research
Added on 2020-07-22
20 Pages4601 Words57 Views
STATISTICS FOR MANAGEMENT

TABLE OF CONTENTSINTRODUCTION...........................................................................................................................1(a)Testing of hypothesis..............................................................................................................1(b)Identification of difference between male and female income level in private sector............2© Earning time chart for year 2009 to 2016................................................................................3(d) Determining annual growth rate............................................................................................3.....................................................................................................................................................4TASK 2............................................................................................................................................5Section A.........................................................................................................................................52.1 Graphical presentation of data...............................................................................................52.2 Analysis of data.....................................................................................................................62.3 Preparation of report and interpretation of results.................................................................9Section B........................................................................................................................................102.4 Line of best fit......................................................................................................................10TASK 3..........................................................................................................................................11(a)Number of delivery made relevant time period....................................................................11(b) Deliveries made on each round............................................................................................12©Economic order quantity.........................................................................................................12(d) Comparison of EOQ and cost..............................................................................................13TASK 4..........................................................................................................................................144.1 Data analysis by using pie and bar chart.............................................................................144.2 Relationship between number of bedrooms and their prices in varied streets....................16CONCLUSION..............................................................................................................................17REFERENCES..............................................................................................................................18
INTRODUCTIONData analysis is emerging as one of the important tool that is used by the firms formaking business decisions. In the current report, varied tools and methods are used to analyzedata. In the present research study, data related public and private sector income that that isearned by male and female is analyze and comments are made on same. In middle part of thereport, students related data is anlayzed through graphical representation and descriptivestatistics. Along with this, advantage and disadvantage of mean and mode are also explained.Apart from this, standard deviation is computed and same is analyzed. At end of the report,calculation related to economic order quantity is performed. Apart from this, relatioship betweenprice of home and number of bedrooms is also identified. In this way, entire research work iscarried out in the report. (a)Testing of hypothesisH0: There is no significent difference betweeen male income level in public sector and femaleincome level in public sector.H1: There is significent difference betweeen male income level in public sector and femaleincome level in public sector.Table 1T tableMale PublicsectorFemale PublicsectorMean32276.62526929.875Variance1449962.268977868.4107Observations88Hypothesized Mean Difference0df13t Stat9.705673424P(T<=t) one-tail1.2709E-07t Critical one-tail1.770933396P(T<=t) two-tail2.54179E-07t Critical two-tail2.160368656InterpretationT test is the one of the most important tool that is used to identify whether there issignificent mean difference between variables. It can be observed that value of level ofsignificence is 1.27>0.05 and this reflects that there is no significent mean difference between1 | P a g e
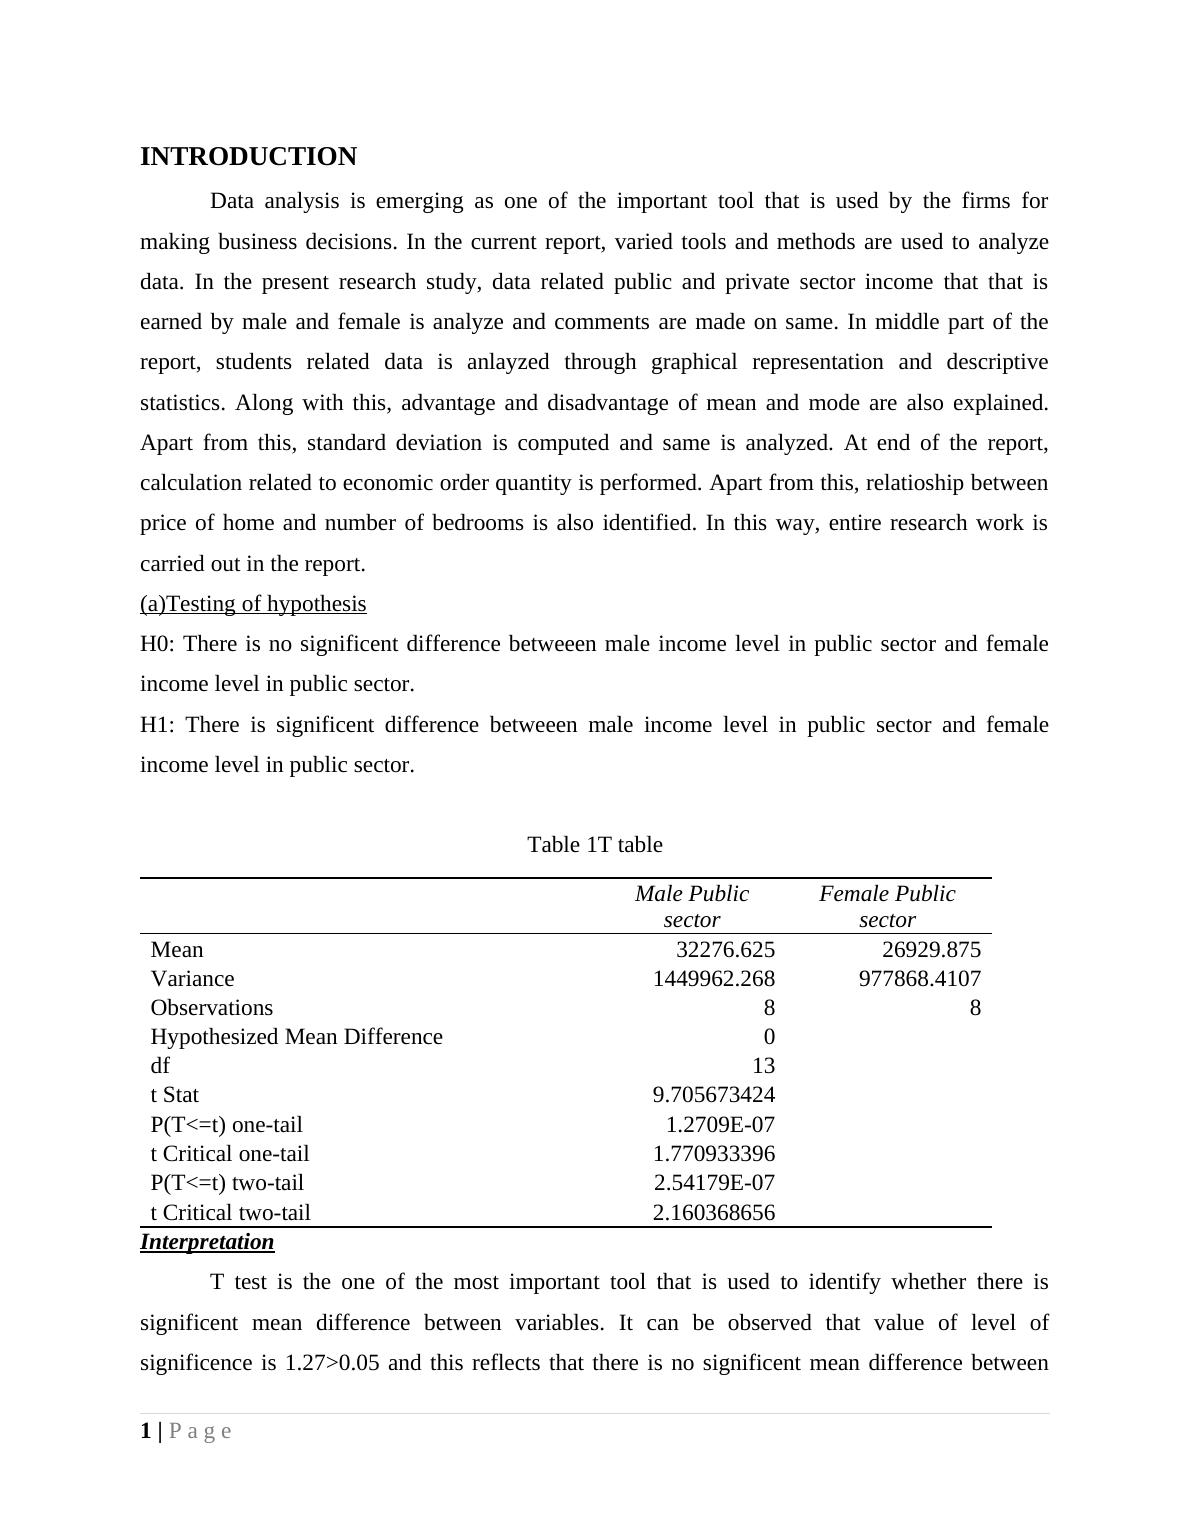
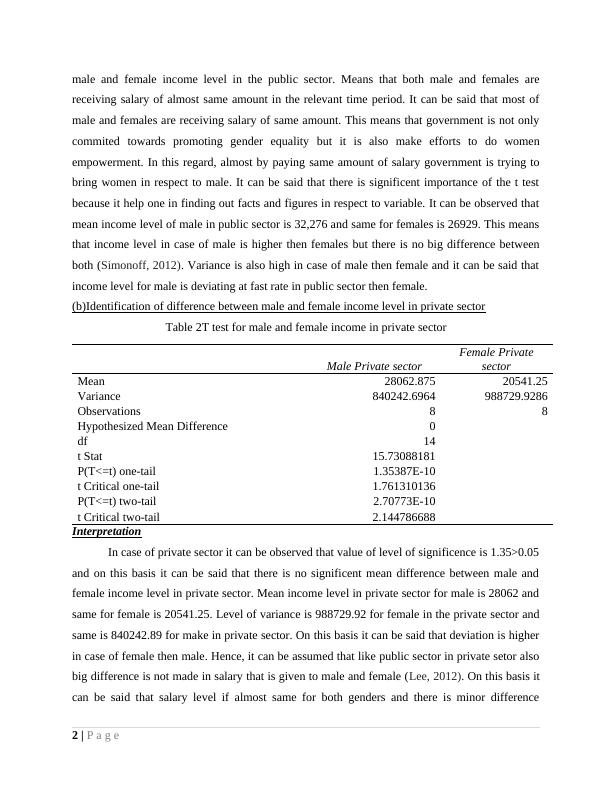
male and female income level in the public sector. Means that both male and females arereceiving salary of almost same amount in the relevant time period. It can be said that most ofmale and females are receiving salary of same amount. This means that government is not onlycommited towards promoting gender equality but it is also make efforts to do womenempowerment. In this regard, almost by paying same amount of salary government is trying tobring women in respect to male. It can be said that there is significent importance of the t testbecause it help one in finding out facts and figures in respect to variable. It can be observed thatmean income level of male in public sector is 32,276 and same for females is 26929. This meansthat income level in case of male is higher then females but there is no big difference betweenboth (Simonoff, 2012). Variance is also high in case of male then female and it can be said thatincome level for male is deviating at fast rate in public sector then female.(b)Identification of difference between male and female income level in private sectorTable 2T test for male and female income in private sectorMale Private sectorFemale PrivatesectorMean28062.87520541.25Variance840242.6964988729.9286Observations88Hypothesized Mean Difference0df14t Stat15.73088181P(T<=t) one-tail1.35387E-10t Critical one-tail1.761310136P(T<=t) two-tail2.70773E-10t Critical two-tail2.144786688InterpretationIn case of private sector it can be observed that value of level of significence is 1.35>0.05and on this basis it can be said that there is no significent mean difference between male andfemale income level in private sector. Mean income level in private sector for male is 28062 andsame for female is 20541.25. Level of variance is 988729.92 for female in the private sector andsame is 840242.89 for make in private sector. On this basis it can be said that deviation is higherin case of female then male. Hence, it can be assumed that like public sector in private setor alsobig difference is not made in salary that is given to male and female (Lee, 2012). On this basis itcan be said that salary level if almost same for both genders and there is minor difference2 | P a g e
End of preview
Want to access all the pages? Upload your documents or become a member.
Related Documents
TASK STATISTICS FOR MANAGEMENT TABLE OF CONTENTS INTRODUCTIONlg...
|21
|4763
|104
Assignment Statistics for Managementlg...
|22
|4725
|101
Statistical Analysis of Management Payslg...
|18
|3592
|347
Statistics for Management Assignment Reportlg...
|23
|5182
|42
Statistics For Management TABLE OF CONTENTS INTRODUCTION 1 TASK 11 A) Hypothesis testing on income of employees in public sector 3 D) Annual growth rate 3 TASK 24 2.1 Presenting pictorial form of datalg...
|20
|3380
|304
Assignment on Statistics PDFlg...
|20
|3514
|85