Statistics for Management : Assignment
18 Pages3053 Words141 Views
Added on 2020-11-12
Statistics for Management : Assignment
Added on 2020-11-12
ShareRelated Documents
STATISTICS FORMANAGEMENT
Table of ContentsINTRODUCTION...........................................................................................................................1TASK 1............................................................................................................................................1(a) Testing Hypothesis for mean earnings in public sector....................................................1(b) Testing Hypothesis for mean earnings in private sector...................................................2(c) Producing Earnings-Time Chart for each group...............................................................3(d) Determination of Annual Growth Rate for each segment................................................5TASK 2............................................................................................................................................6a) Using an ogive to estimate the median hourly earnings and the quartiles.........................6b) Calculation of mean and standard deviation for hourly earnings......................................8c) Comparison between the earning in the two regions:......................................................10TASK 3..........................................................................................................................................10a) Calculation of economic order quantity...........................................................................11b) Calculation of reorder quantity of Tee shirts...................................................................11c) Calculation of the inventory policy cost...........................................................................12d) Calculation of current level service to the customers......................................................12e) Calculation of Re order level............................................................................................12TASK 4 .........................................................................................................................................13(a) Graphical representation to show changes in price index as per CPI, CPIH and RPI:...13(b) Creating Ogive using table 1..........................................................................................14CONCLUSION..............................................................................................................................15REFERENCES..............................................................................................................................16
INTRODUCTIONBusiness statistics can be defined as procedure to make appropriate decisions in the caseof uncertainty. It is used in various aspects of business like econometrics, financial analysis,production, auditing and more, including marketing research and service improvement (Al-Omari, 2016). The present report covers an in-depth knowledge related to data collection, centraltendency, ogive curve, dispersion and variability, for analysing a business situation. Here,different types of data are shown in graphical manner to identify the spotting trends as well asdifferent patterns related to different variables. Furthermore, recommendations also provide asper findings within each section.TASK 1A hypothesis can be defined as a proposed statement for analysing a particular businesssituation (Armstrong and Taylor, 2014). Having a good hypothesis aid decision-makers infinding new ways for achievement of business objectives. In statistics, hypothesis is made tomeasure variability of a proposed statement. For this purpose, various methods can be used likedispersion, measures of central tendency, variability and more. While, hypothesis testing is usedto analyse whether an assumption made for a particular data is either rejected or accepted. Forthis purpose, two events are made as null hypothesis (H0) and alternative hypothesis (H1). (a) Testing Hypothesis for mean earnings in public sectorAs per given case scenario, a study is undertaken where earning of 1000 persons aredescribed according to gender basis, who are chosen on random basis from a large population.Here, assumptions are made for analysing whether average annual gross earnings of given dataof men and women’s salary followed a normal distribution or not. For this purpose, a comparisonis made on data on the basis of men and women in following manner: Null Hypothesis (H0): Earnings of men in public sector is not considered as significantas of women.Alternative Hypothesis (H1): Earnings of men in public sector is considered assignificant as of women.1
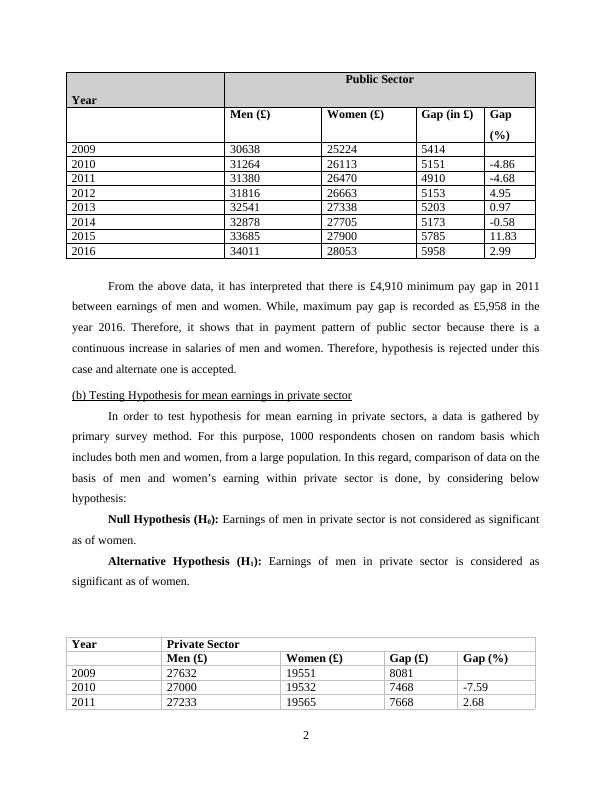
YearPublic SectorMen (£)Women (£)Gap (in £)Gap(%)200930638252245414201031264261135151-4.86201131380264704910-4.682012318162666351534.952013325412733852030.97201432878277055173-0.5820153368527900578511.832016340112805359582.99From the above data, it has interpreted that there is £4,910 minimum pay gap in 2011between earnings of men and women. While, maximum pay gap is recorded as £5,958 in theyear 2016. Therefore, it shows that in payment pattern of public sector because there is acontinuous increase in salaries of men and women. Therefore, hypothesis is rejected under thiscase and alternate one is accepted. (b) Testing Hypothesis for mean earnings in private sectorIn order to test hypothesis for mean earning in private sectors, a data is gathered byprimary survey method. For this purpose, 1000 respondents chosen on random basis whichincludes both men and women, from a large population. In this regard, comparison of data on thebasis of men and women’s earning within private sector is done, by considering belowhypothesis: Null Hypothesis (H0): Earnings of men in private sector is not considered as significantas of women.Alternative Hypothesis (H1): Earnings of men in private sector is considered assignificant as of women.YearPrivate SectorMen (£)Women (£)Gap (£)Gap (%)200927632195518081201027000195327468-7.592011272331956576682.682
End of preview
Want to access all the pages? Upload your documents or become a member.
Related Documents
Statistics for Management Assignment (Solution)lg...
|18
|2936
|430
Statistics For Management Doclg...
|19
|3164
|404
Statistics for MANAGEMENT INTRODUCTION 1 STATISTICS FOR MANAGEMENT INTRODUCTION 2 ACTIVITY 1 1 (a) Determining whether earnings of men are different from women in private sectorlg...
|21
|3804
|232
Statistics For Management Assignment Sample PDFlg...
|20
|5143
|29
(Solution) Statistics For Management PDFlg...
|17
|3567
|150
Statistics for Management - PDFlg...
|15
|3039
|334