Statistics for Management Assignment (Solution)
18 Pages2936 Words430 Views
Added on 2020-12-24
Statistics for Management Assignment (Solution)
Added on 2020-12-24
ShareRelated Documents
Statistics forManagement

Table of ContentsINTRODUCTION...........................................................................................................................1ACTIVITY 1....................................................................................................................................1a) Testing Hypothesis for mean earning in public sector............................................................1b) Testing hypothesis for mean earning in private sector...........................................................2c) Graphical representation of earning time chart for each group...............................................3d) Calculation of Annual Growth rate for each segment............................................................5ACTIVITY 2....................................................................................................................................6a) Use of ogive to estimate the median hourly earnings and the quartiles..................................6b) Calculation of Mean and Standard Deviation of hourly earning............................................8ACTIVITY 3..................................................................................................................................10a) Calculation of Economic order quantity...............................................................................10b) Calculation of re order duration of Tee Shirts......................................................................11c) Calculation of Inventory Policy Cost....................................................................................12d) Calculation of current level service to the customers...........................................................12e) Calculation of Re order level................................................................................................12ACTIVITY 4 .................................................................................................................................13(a) Graphical representation to show changes in price index as per CPI, CPIH and RPI:........13(b) Creating Ogive using table 1...............................................................................................14CONCLUSION..............................................................................................................................15REFERENCES..............................................................................................................................16
INTRODUCTIONBusiness statistics is considered as a very important tool for the company. It helps themanagers to find out the latest trends and develop their strategies according to that (Brozović andSchlenker, 2011). It also helps the management to analyse the growth rate of the company as itshows the past records in a graphical representation. This graphical representation helps the userto understand it easily and formulate new strategies. In the preparation of this report statisticaltools such as ogive curve, central tendencies are used to determine the use of these tools inbusiness and how this helps in decision making process.ACTIVITY 1A hypothesis is a testable statement which is used to test the relation between two ormore variable (Embrechts and Hofert, 2014). It is also used to identify the validity of therelationship between the variables. Hypothesis helps the mangers to take decisions for thebenefits of the organisation. It is used by the organisation to measure the validity of thestatement. Various methods such as measure of central tendency, dispersion, etc. are used tomeasure the hypothesis. It is used to analyse the assumption which is made for a particular set ofdata that whether the hypothesis is accepted or rejected. Two events as null hypothesis(H0) andalternative hypothesis(H1) are made to validate the statement.a) Testing Hypothesis for mean earning in public sector.As per the case, a study is conducted on the earning of 1000 persons on the basis ofgender, for this purpose the sample is selected on a random basis. In this case the assumption ismade for the analysis of the average annual gross earning of men and women's salary. For theanalysis of the above given scenario following assumptions are made:Null Hypothesis (H0): it is considered as the earning of men in public sector is notsignificant to the earning of the women in public sector.Alternative Hypothesis (H1): It is considered that the earning of men in public sector issignificant to the earning of women.1

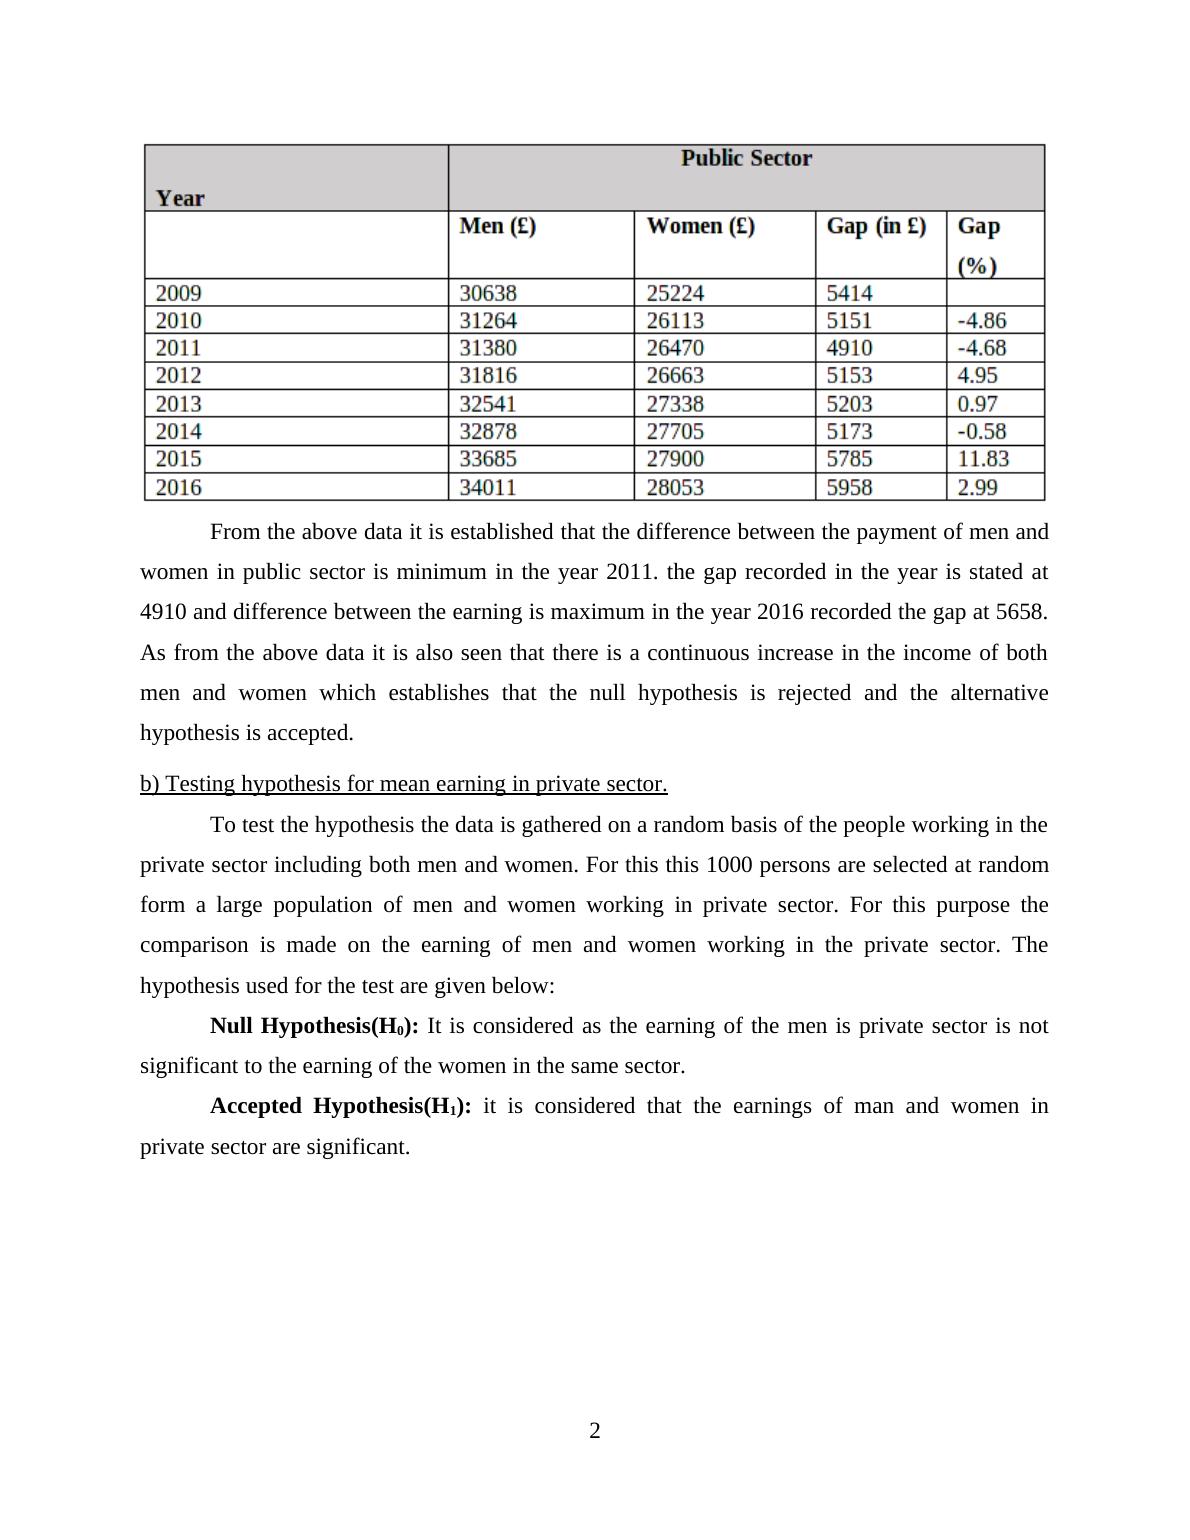
From the above data it is established that the difference between the payment of men andwomen in public sector is minimum in the year 2011. the gap recorded in the year is stated at4910 and difference between the earning is maximum in the year 2016 recorded the gap at 5658.As from the above data it is also seen that there is a continuous increase in the income of bothmen and women which establishes that the null hypothesis is rejected and the alternativehypothesis is accepted. b) Testing hypothesis for mean earning in private sector.To test the hypothesis the data is gathered on a random basis of the people working in theprivate sector including both men and women. For this this 1000 persons are selected at randomform a large population of men and women working in private sector. For this purpose thecomparison is made on the earning of men and women working in the private sector. Thehypothesis used for the test are given below:Null Hypothesis(H0): It is considered as the earning of the men is private sector is notsignificant to the earning of the women in the same sector.Accepted Hypothesis(H1): it is considered that the earnings of man and women inprivate sector are significant.2
End of preview
Want to access all the pages? Upload your documents or become a member.
Related Documents
Statistics For Management Doclg...
|19
|3164
|404
Statistics for Management : Assignmentlg...
|18
|3053
|141
(Solution) Statistics For Management PDFlg...
|17
|3567
|150
Statistics for Management - PDFlg...
|15
|3039
|334
Statistics for MANAGEMENT INTRODUCTION 1 STATISTICS FOR MANAGEMENT INTRODUCTION 2 ACTIVITY 1 1 (a) Determining whether earnings of men are different from women in private sectorlg...
|21
|3804
|232
Statistics for Management Assignment - (Doc)lg...
|17
|2657
|56