(Solved) Assignment on Statistics for Management
22 Pages4657 Words92 Views
Added on 2021-01-02
(Solved) Assignment on Statistics for Management
Added on 2021-01-02
ShareRelated Documents
STATISTICS FORMANAGEMENT
Table of ContentsINTRODUCTION...........................................................................................................................3ACTIVITY 1....................................................................................................................................3P1Process and nature of business and economic data with different published sources........3P2 Data form variety of sources using various methods of analysis......................................6M1 Evaluation of sources other than the NSO with regard to the gender pay gap................9Activity 2.........................................................................................................................................9P3 Evaluation of qualitative and quantitative data from a range of examples and appropriatestatistical methods..................................................................................................................9M2 Differences in statistical application in activity 2..........................................................13D1 Difference between descriptive, exploratory and confirmatory analysis with examples 13ACTIVITY 3..................................................................................................................................15P4 Statistical methods used in business planning, inventory management and capacitymanagement..........................................................................................................................15M3 the use of the statistical methods used in activity 3.......................................................16D2 Recommendation and judgements made in activity 3....................................................16ACTIVITY 4..................................................................................................................................17P5 Use of adequate charts and tables to execute the findings for a various variables.........17M4 Justification regarding graphical representations used in activity 1 and 2....................20D3 Use of graphical and tabular representations used in 1 and 2 activities.........................20CONCLUSION..............................................................................................................................20REFRENCES ................................................................................................................................22
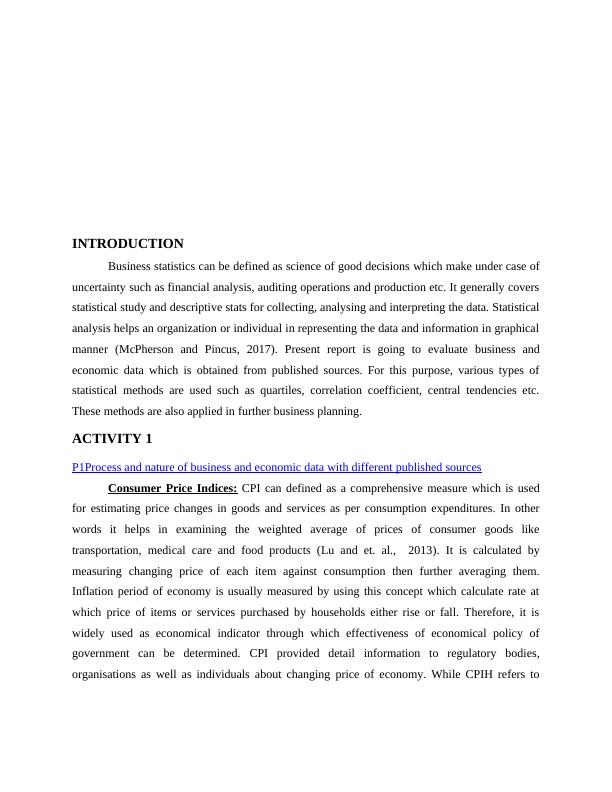
INTRODUCTIONBusiness statistics can be defined as science of good decisions which make under case ofuncertainty such as financial analysis, auditing operations and production etc. It generally coversstatistical study and descriptive stats for collecting, analysing and interpreting the data. Statisticalanalysis helps an organization or individual in representing the data and information in graphicalmanner (McPherson and Pincus, 2017). Present report is going to evaluate business andeconomic data which is obtained from published sources. For this purpose, various types ofstatistical methods are used such as quartiles, correlation coefficient, central tendencies etc.These methods are also applied in further business planning. ACTIVITY 1P1Process and nature of business and economic data with different published sourcesConsumer Price Indices: CPI can defined as a comprehensive measure which is usedfor estimating price changes in goods and services as per consumption expenditures. In otherwords it helps in examining the weighted average of prices of consumer goods liketransportation, medical care and food products (Lu and et. al., 2013). It is calculated bymeasuring changing price of each item against consumption then further averaging them.Inflation period of economy is usually measured by using this concept which calculate rate atwhich price of items or services purchased by households either rise or fall. Therefore, it iswidely used as economical indicator through which effectiveness of economical policy ofgovernment can be determined. CPI provided detail information to regulatory bodies,organisations as well as individuals about changing price of economy. While CPIH refers to
consumer price index in terms of housing and considered as most comprehensive measure ofinflation. Statistical data in terms of CPI indexYear JanFeb Mar AprilMay JunJuly2007103.2103.7104.2104.5104.8105104.42008105.5106.3106.7107.6108.31091092009108.7109.6109.8110.1110.7111110.92010112.4112.9113.5114.2114.4114.6114.32011116.9117.8118.1119.3119.5119.4119.42012121.1121.8122.2122.8122.3122.5123.12013124.4125.2125.6125.9126.1125.9125.82014126.7127.4127.7128.1128128.3127.82015127.1127.4127.6128128.2128.21282016127.4127.7128.3128.3128.5128.8129.22017129.8130.7131.2131.7132.2132.2132.1Aug Sep OctNovDecTotal104.7104.8105.3105.6106.21256.4109.7110.3110109.9109.51301.8111.4111.5111.7112112.61330114.9114.9115.2115.6116.81373.7120.1120.9121121.2121.71435.3123.5124.4126.8126.9127.51484.9126.4126.8126.9127127.51513.5128.3128.4128.5128.2128.21535.6128.4128.2128.4128.3128.51536.3129.2129.4129.5129.8130.41546.5132.9133.2133.4133.9134.31587.6Year Total20071256.420081301.820091330
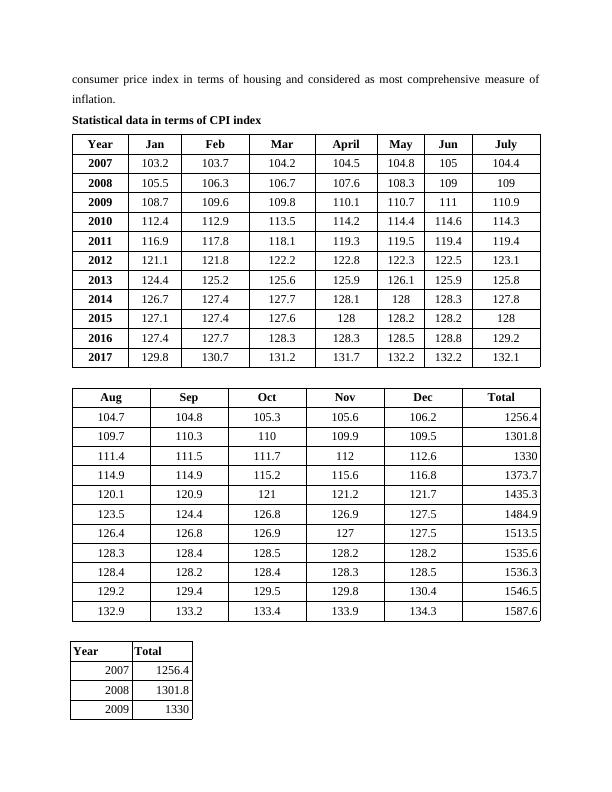
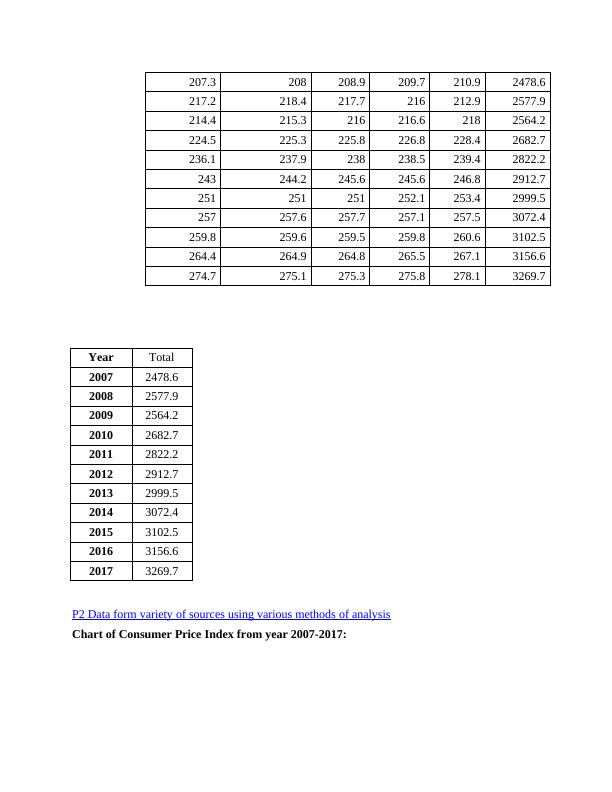
20101373.720111435.320121484.920131513.520141535.620151536.320161546.520171587.6Retail Price Index:It provides a list of price of particular goods and services which entail the changing rateof cost of living changes on monthly basis (Lam, 2012). It also refers as a primary tool fordetermining the way people are experiencing fall or rise in price rates. Therefore, it can becalculated as a weighted average of price of those household goods which are bought by endcustomers. Statistical data in terms of RPI IndexYear JanFeb Mar AprilMay JunJuly2007201.3203.1204.4205.4206.2207.3206.12008209.8211.4212.1214215.1216.8216.52009210.1211.4211.3211.5212.8213.4213.42010217.9219.2220.7222.8223.6224.1223.62011229231.3232.5234.4235.2235.2234.72012238239.9240.8242.5242.4241.8242.12013245.8247.6248.7249.5250249.7249.72014252.6254.2254.8255.7255.9256.32562015255.4256.7257.1258258.5258.9258.62016258.8260261.1261.4262.1263.1263.42017265.5268.4269.3270.6271.7272.3272.9Aug Sep OctNovDecTotal
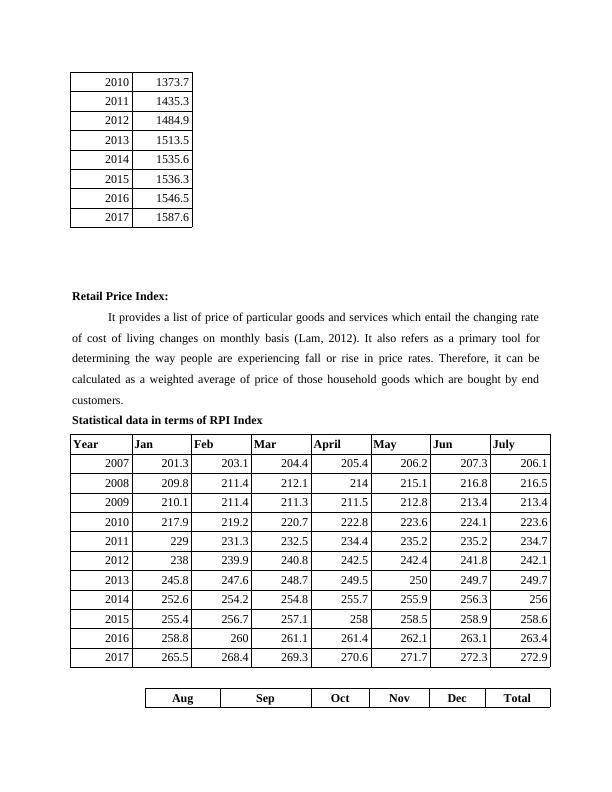
207.3208208.9209.7210.92478.6217.2218.4217.7216212.92577.9214.4215.3216216.62182564.2224.5225.3225.8226.8228.42682.7236.1237.9238238.5239.42822.2243244.2245.6245.6246.82912.7251251251252.1253.42999.5257257.6257.7257.1257.53072.4259.8259.6259.5259.8260.63102.5264.4264.9264.8265.5267.13156.6274.7275.1275.3275.8278.13269.7YearTotal20072478.620082577.920092564.220102682.720112822.220122912.720132999.520143072.420153102.520163156.620173269.7P2 Data form variety of sources using various methods of analysisChart of Consumer Price Index from year 2007-2017:
End of preview
Want to access all the pages? Upload your documents or become a member.
Related Documents
Statistics for Management Assignment Solved - (Doc)lg...
|20
|3601
|398
Statistics for Management: Nature, Process, and Evaluation of Datalg...
|21
|3384
|97
(PDF) Statistics for Management and Economiclg...
|20
|4422
|52
Statistical Statistics for Management Inflationlg...
|24
|3596
|221
Statistics for Management - Introductionlg...
|18
|3743
|496
Statistics for MANAGEMENT INTROUCTIONlg...
|19
|3852
|233