logo

Statistical Statistics for Management Inflation

24 Pages3596 Words221 Views
   

Added on  2020-10-22

About This Document

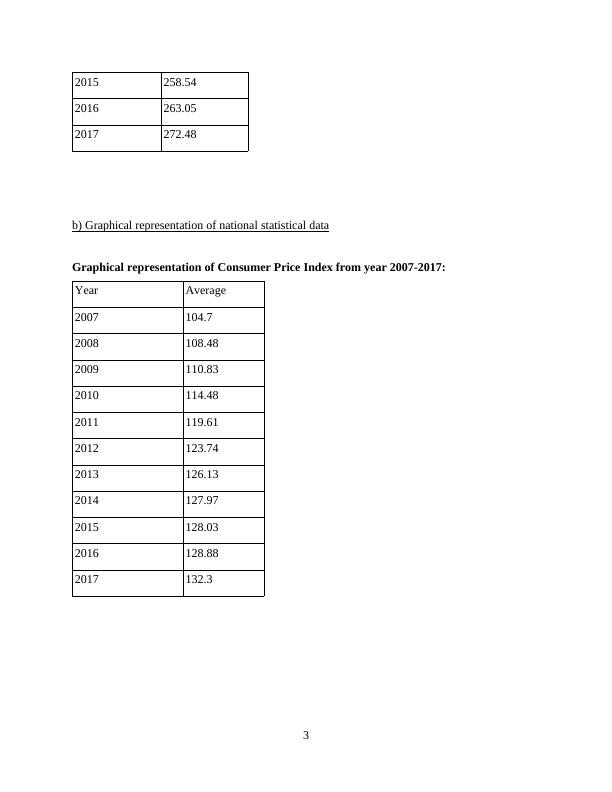
STATISTICS FOR MANAGEMENT INTRODUCTION 1 ACTIVITY 1 a) National Statistical Data 1 b) Graphical representation of national statistical data 3 c) Differences between CPI, CPIH and RPI Indices as per method 5 d) Use of collected data form Consumer Price Index to determine annual inflation5 e) Significance of calculating inflation rate6 Activity 2 7 a) O-give curve to determine Median 7 b) Mean and standard deviation for hourly earnings of London area11 c) Comparison of earning of London

Statistical Statistics for Management Inflation

   Added on 2020-10-22

ShareRelated Documents
STATISTICS FOR
MANAGEMENT
Statistical Statistics for Management Inflation_1
Table of Contents
INTRODUCTION...........................................................................................................................1
ACTIVITY 1....................................................................................................................................1
a) National Statistical Data.....................................................................................................1
b) Graphical representation of national statistical data..........................................................3
c) Differences between CPI, CPIH and RPI Indices..............................................................5
d) Use of collected data form Consumer price Index to determine annual inflation.............5
e) Significance of calculating inflation rate............................................................................6
Activity 2.........................................................................................................................................7
a) O-give curve to determine Median.....................................................................................7
b) Mean and standard deviation for hourly earnings of London area..................................11
c) Comparison of earning of London and Manchester area.................................................13
ACTIVITY 3..................................................................................................................................14
a) Economic Order Quantity (EOQ).....................................................................................14
c) Calculation of inventory policy cost................................................................................15
ACTIVITY 4..................................................................................................................................16
a) Charts and tables on the basis of office of national statistics produce line......................16
b) An O-give curve of cumulative % of staff versus hourly earning...................................18
CONCLUSION..............................................................................................................................20
REFRENCES ................................................................................................................................21
Statistical Statistics for Management Inflation_2
Statistical Statistics for Management Inflation_3
INTRODUCTION
Statistics is considered as one of the mathematical analysis that would be used in
qualifying models representations, for given set of data and actual verifications. It is generally
used to analyse, modified and draw a valid conclusions from data. An organisation or individual
can summarize business data using various methodologies of statistics (Gui and Aslam, 2017).
The report is made to analyse the concept of statistics of management for evaluating economical
data extracted from published National Statistics. These data are further represented in charts and
other forms of graphical method. Furthermore, concept of economic order quantity for inventory
management is also described in present assignment.
ACTIVITY 1
a) National Statistical Data
Consumer Price Indices:
Inflation can be defined as rate of changing price of basic commodities which influence
mostly the interest rate on mortgages, saving and more. These rates generally affects state
pension level as well as benefits of the same too. CPI refers to measure the inflation rate and
purchasing power of national currency (Qiu, Qin and Zhou, 2016). This method expresses
current price of basic goods as per difference in price of same year to previous one. It includes
bread, meat, milk and other essential household products. This will indicate effect of inflation on
current situation of marketplace. In context with CPIH, as per National Statistics, it has
evaluated that Consumer Price Index which includes housing costs of owners refers to most
encompassing measure of inflation. Thus, information provided as per CPI and CPIH helps
organisations as well as individuals in estimating the changing price of economy in future also.
Retail Price Index:
RPI is generally used by governmental bodies for several purposes like amount payable
on index-linked securities, wage negotiation, inflation rates etc. The data which is not included in
CPI such as mortgage interest payments, building insurance, house depreciation and more
included in retail price index (Gikhman and Skorokhod, 2015). It also tracks changes in the cost
of fixed or basic commodities.
1
Statistical Statistics for Management Inflation_4
Statistical data in terms of CPI index
Year Average
2007 104.7
2008 108.48
2009 110.83
2010 114.48
2011 119.61
2012 123.74
2013 126.13
2014 127.97
2015 128.03
2016 128.88
2017 132.3
Statistical data in terms of RPI Index
Year Average
2007 206.55
2008 214.83
2009 213.68
2010 223.56
2011 235.18
2012 242.73
2013 249.96
2014 256.03
2
Statistical Statistics for Management Inflation_5
2015 258.54
2016 263.05
2017 272.48
b) Graphical representation of national statistical data
Graphical representation of Consumer Price Index from year 2007-2017:
Year Average
2007 104.7
2008 108.48
2009 110.83
2010 114.48
2011 119.61
2012 123.74
2013 126.13
2014 127.97
2015 128.03
2016 128.88
2017 132.3
3
Statistical Statistics for Management Inflation_6

End of preview

Want to access all the pages? Upload your documents or become a member.

Related Documents
(Doc) Statistics for Management Assignment
|23
|4220
|39

Statistics For Management (pdf)
|15
|3242
|330

(PDF) Statistics for management | Assignment Sample
|15
|2703
|98

Statistics for Management : PDF
|20
|4443
|300

Statistics for Management Assignment Solution
|16
|3449
|157

Statistics for Management : Assignment Sample
|16
|4020
|369