Statistics for psychology Assignment
Added on 2023-04-20
13 Pages1816 Words115 Views
Running Head: Statistics for psychology Assignment
Statistics for psychology Assignment
Student’s Name
Institution Affiliation
Statistics for psychology Assignment
Student’s Name
Institution Affiliation
Statistics for psychology Assignment
Question One
a. Meaning of the following terms:
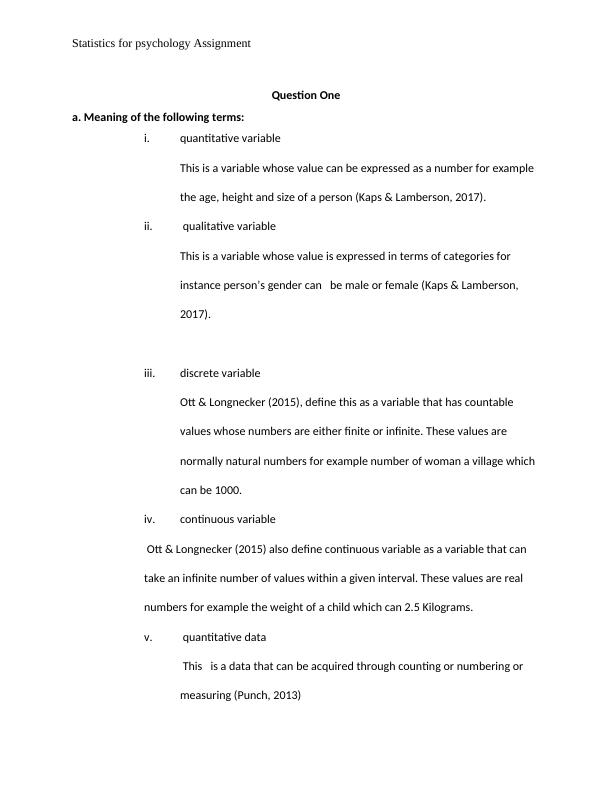
i. quantitative variable
This is a variable whose value can be expressed as a number for example
the age, height and size of a person (Kaps & Lamberson, 2017).
ii. qualitative variable
This is a variable whose value is expressed in terms of categories for
instance person’s gender can be male or female (Kaps & Lamberson,
2017).
iii. discrete variable
Ott & Longnecker (2015), define this as a variable that has countable
values whose numbers are either finite or infinite. These values are
normally natural numbers for example number of woman a village which
can be 1000.
iv. continuous variable
Ott & Longnecker (2015) also define continuous variable as a variable that can
take an infinite number of values within a given interval. These values are real
numbers for example the weight of a child which can 2.5 Kilograms.
v. quantitative data
This is a data that can be acquired through counting or numbering or
measuring (Punch, 2013)
Question One
a. Meaning of the following terms:
i. quantitative variable
This is a variable whose value can be expressed as a number for example
the age, height and size of a person (Kaps & Lamberson, 2017).
ii. qualitative variable
This is a variable whose value is expressed in terms of categories for
instance person’s gender can be male or female (Kaps & Lamberson,
2017).
iii. discrete variable
Ott & Longnecker (2015), define this as a variable that has countable
values whose numbers are either finite or infinite. These values are
normally natural numbers for example number of woman a village which
can be 1000.
iv. continuous variable
Ott & Longnecker (2015) also define continuous variable as a variable that can
take an infinite number of values within a given interval. These values are real
numbers for example the weight of a child which can 2.5 Kilograms.
v. quantitative data
This is a data that can be acquired through counting or numbering or
measuring (Punch, 2013)
Statistics for psychology Assignment
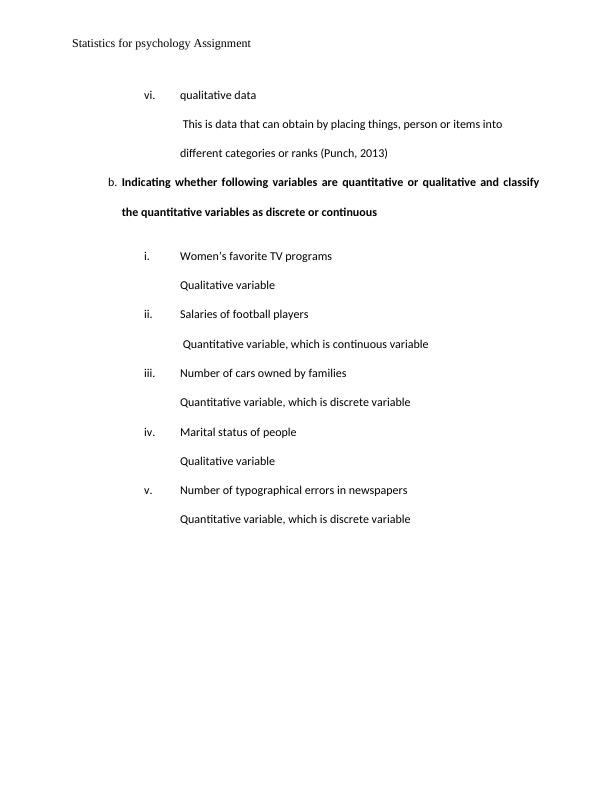
vi. qualitative data
This is data that can obtain by placing things, person or items into
different categories or ranks (Punch, 2013)
b. Indicating whether following variables are quantitative or qualitative and classify
the quantitative variables as discrete or continuous
i. Women’s favorite TV programs
Qualitative variable
ii. Salaries of football players
Quantitative variable, which is continuous variable
iii. Number of cars owned by families
Quantitative variable, which is discrete variable
iv. Marital status of people
Qualitative variable
v. Number of typographical errors in newspapers
Quantitative variable, which is discrete variable
Statistics for psychology Assignment
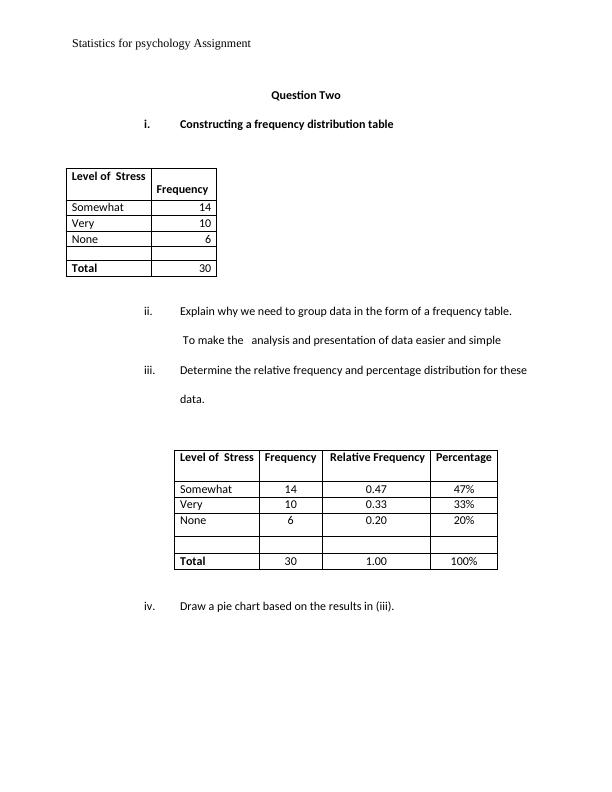
Question Two
i. Constructing a frequency distribution table
ii. Explain why we need to group data in the form of a frequency table.
To make the analysis and presentation of data easier and simple
iii. Determine the relative frequency and percentage distribution for these
data.
Level of Stress Frequency Relative Frequency Percentage
Somewhat 14 0.47 47%
Very 10 0.33 33%
None 6 0.20 20%
Total 30 1.00 100%
iv. Draw a pie chart based on the results in (iii).
Level of Stress
Frequency
Somewhat 14
Very 10
None 6
Total 30
End of preview
Want to access all the pages? Upload your documents or become a member.
Related Documents
Business Research Methodology Analysis 2022lg...
|4
|775
|38
Quantitative Data Analysis: Scale of Measurement and Descriptive Statisticslg...
|14
|1209
|441
DATA ANALYSIS 1.lg...
|3
|424
|488