Statistical Analysis of Body Temperature and Heart Rate Data Report
VerifiedAdded on 2021/06/16
|13
|1439
|24
Report
AI Summary
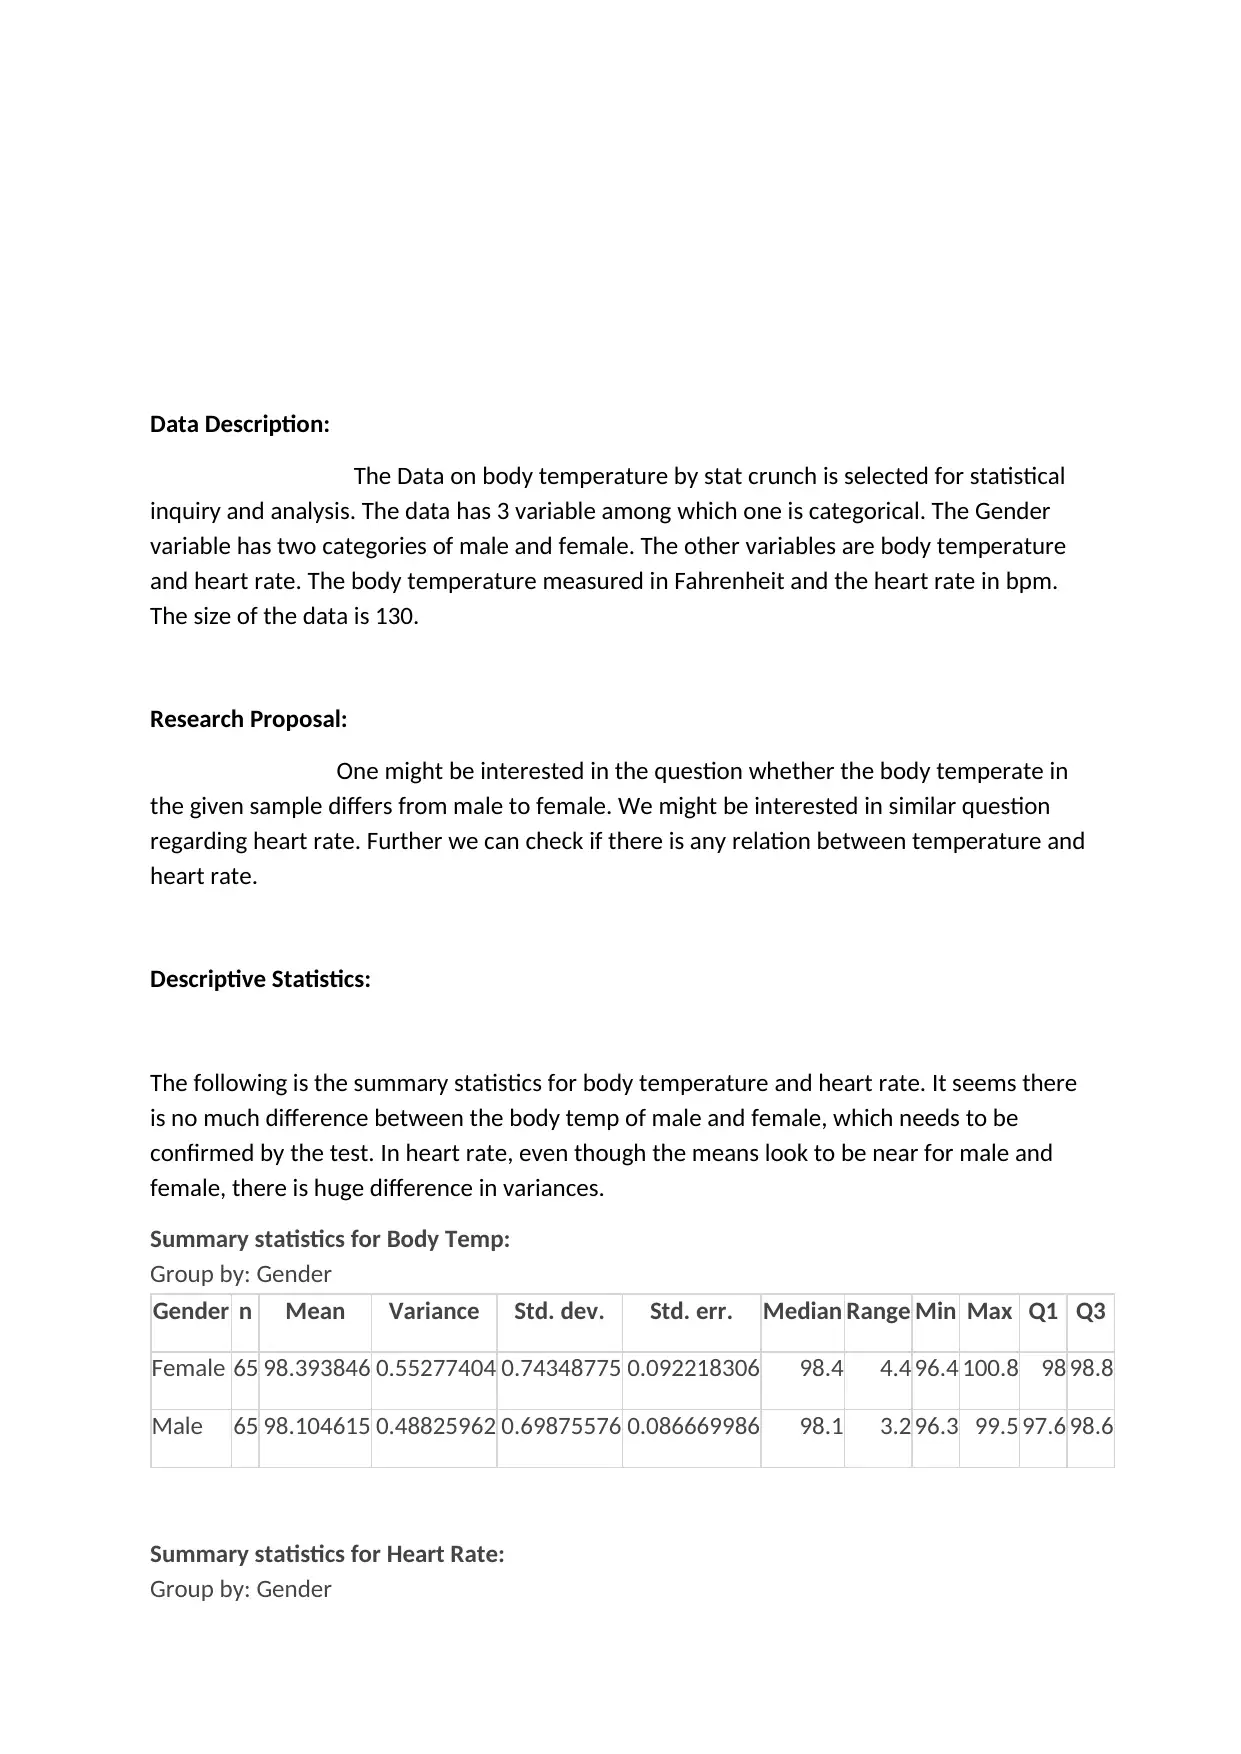
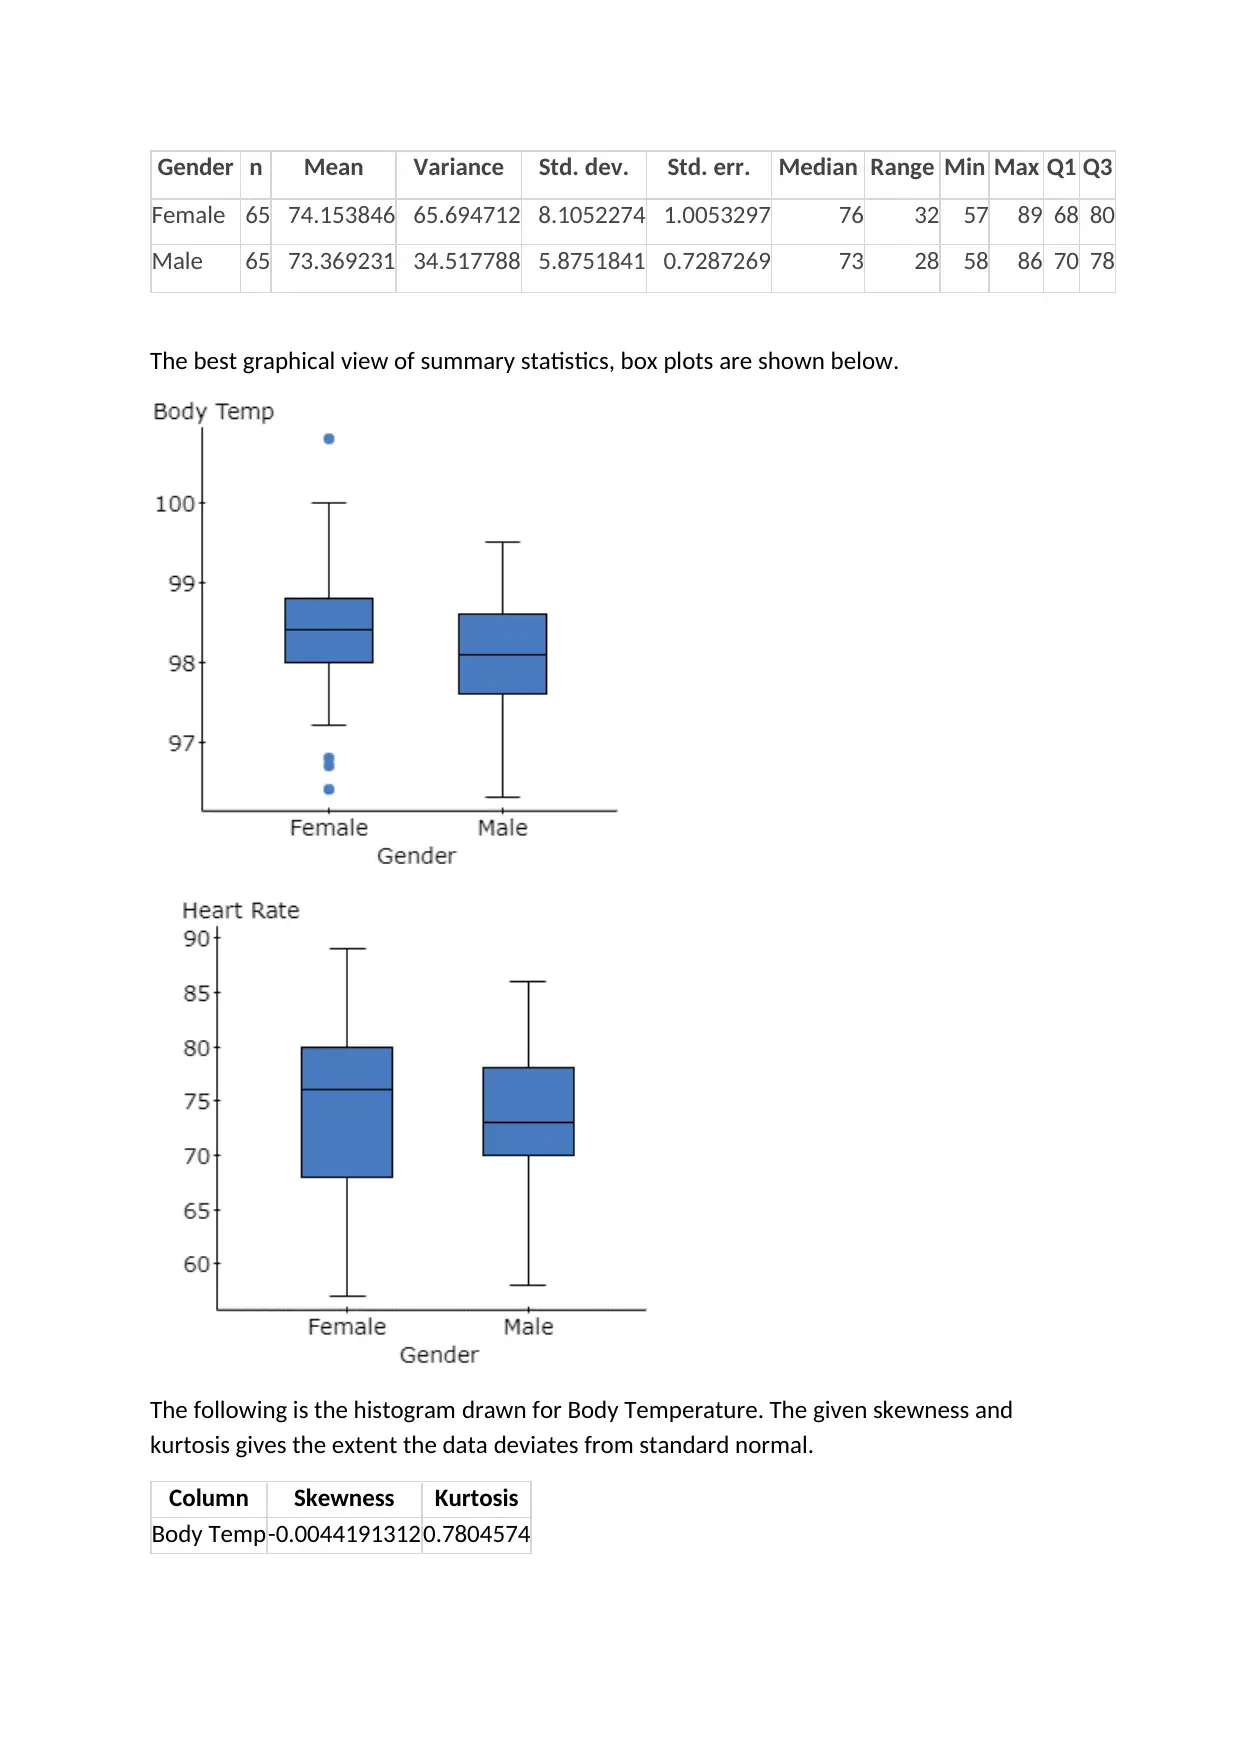
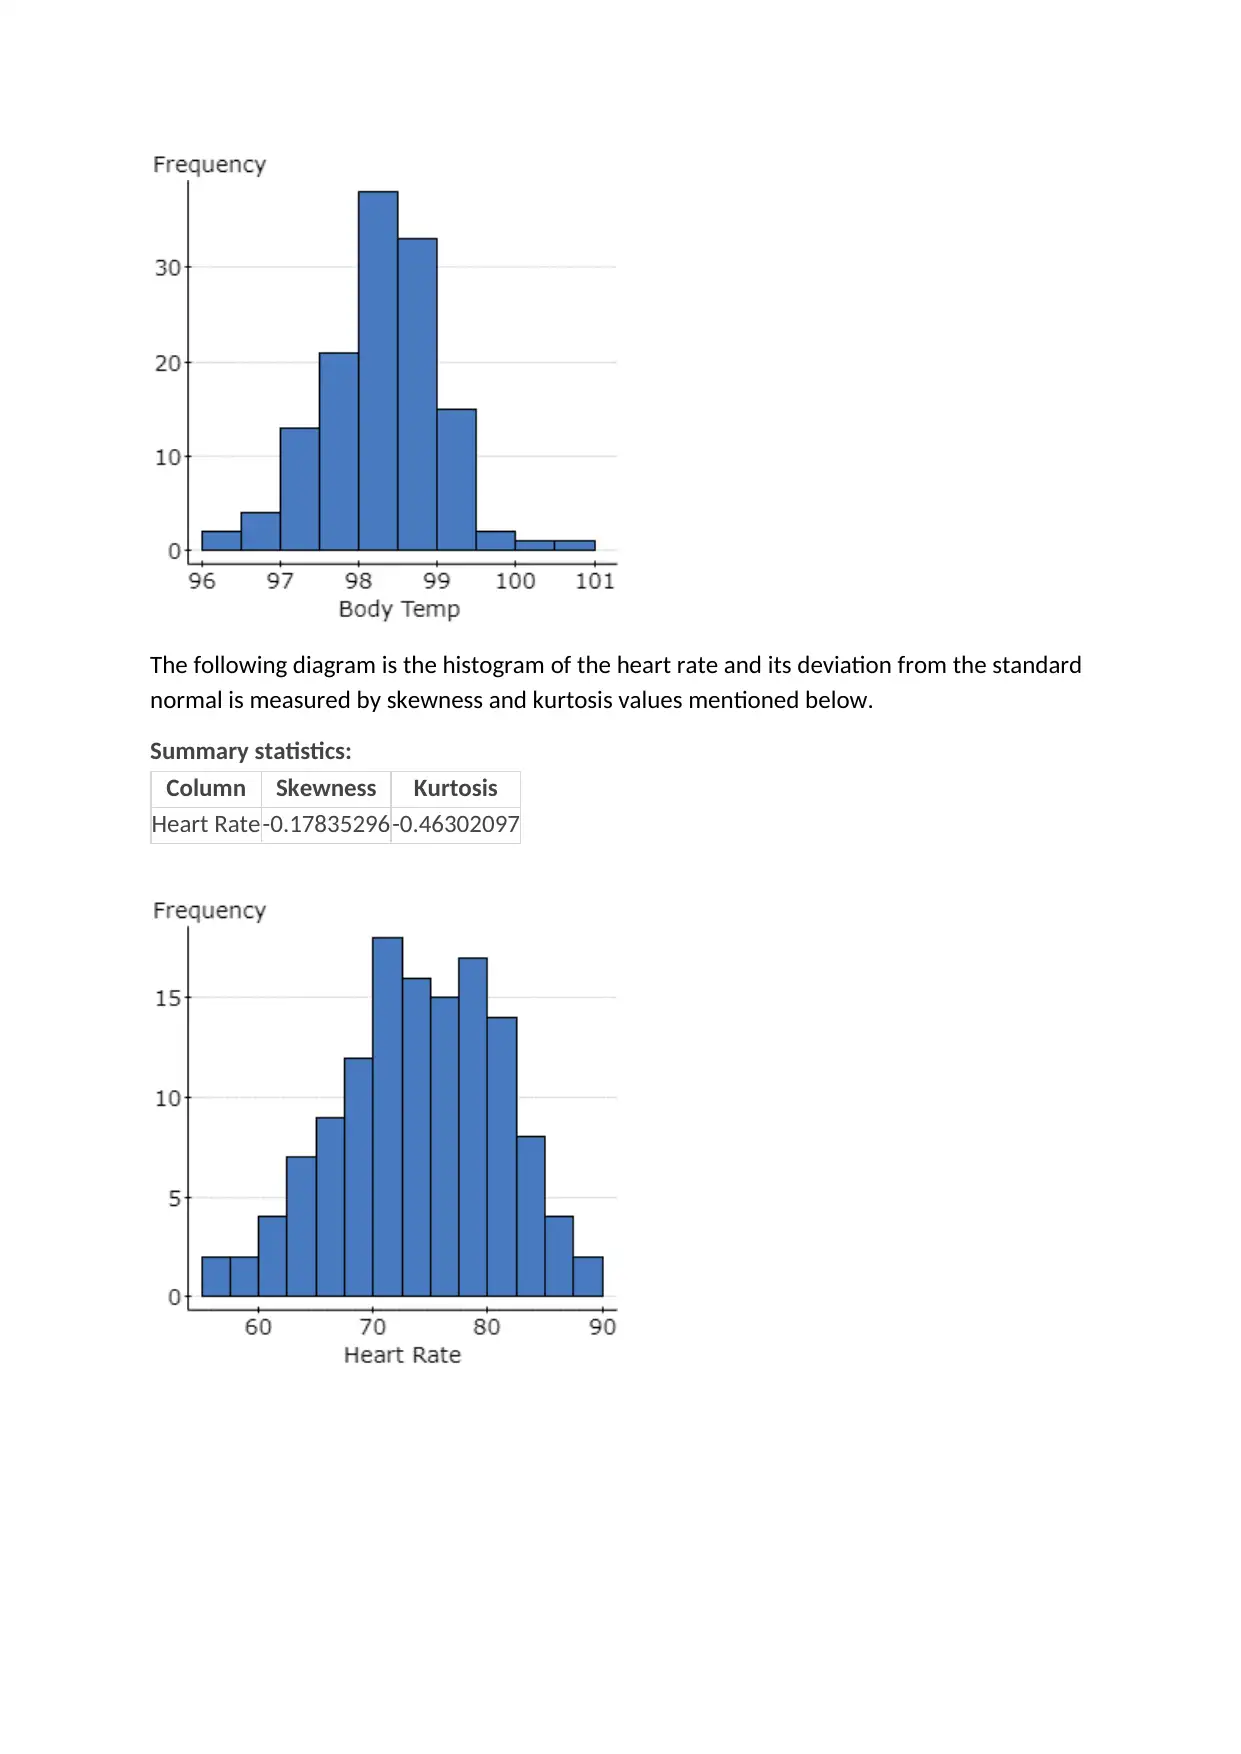
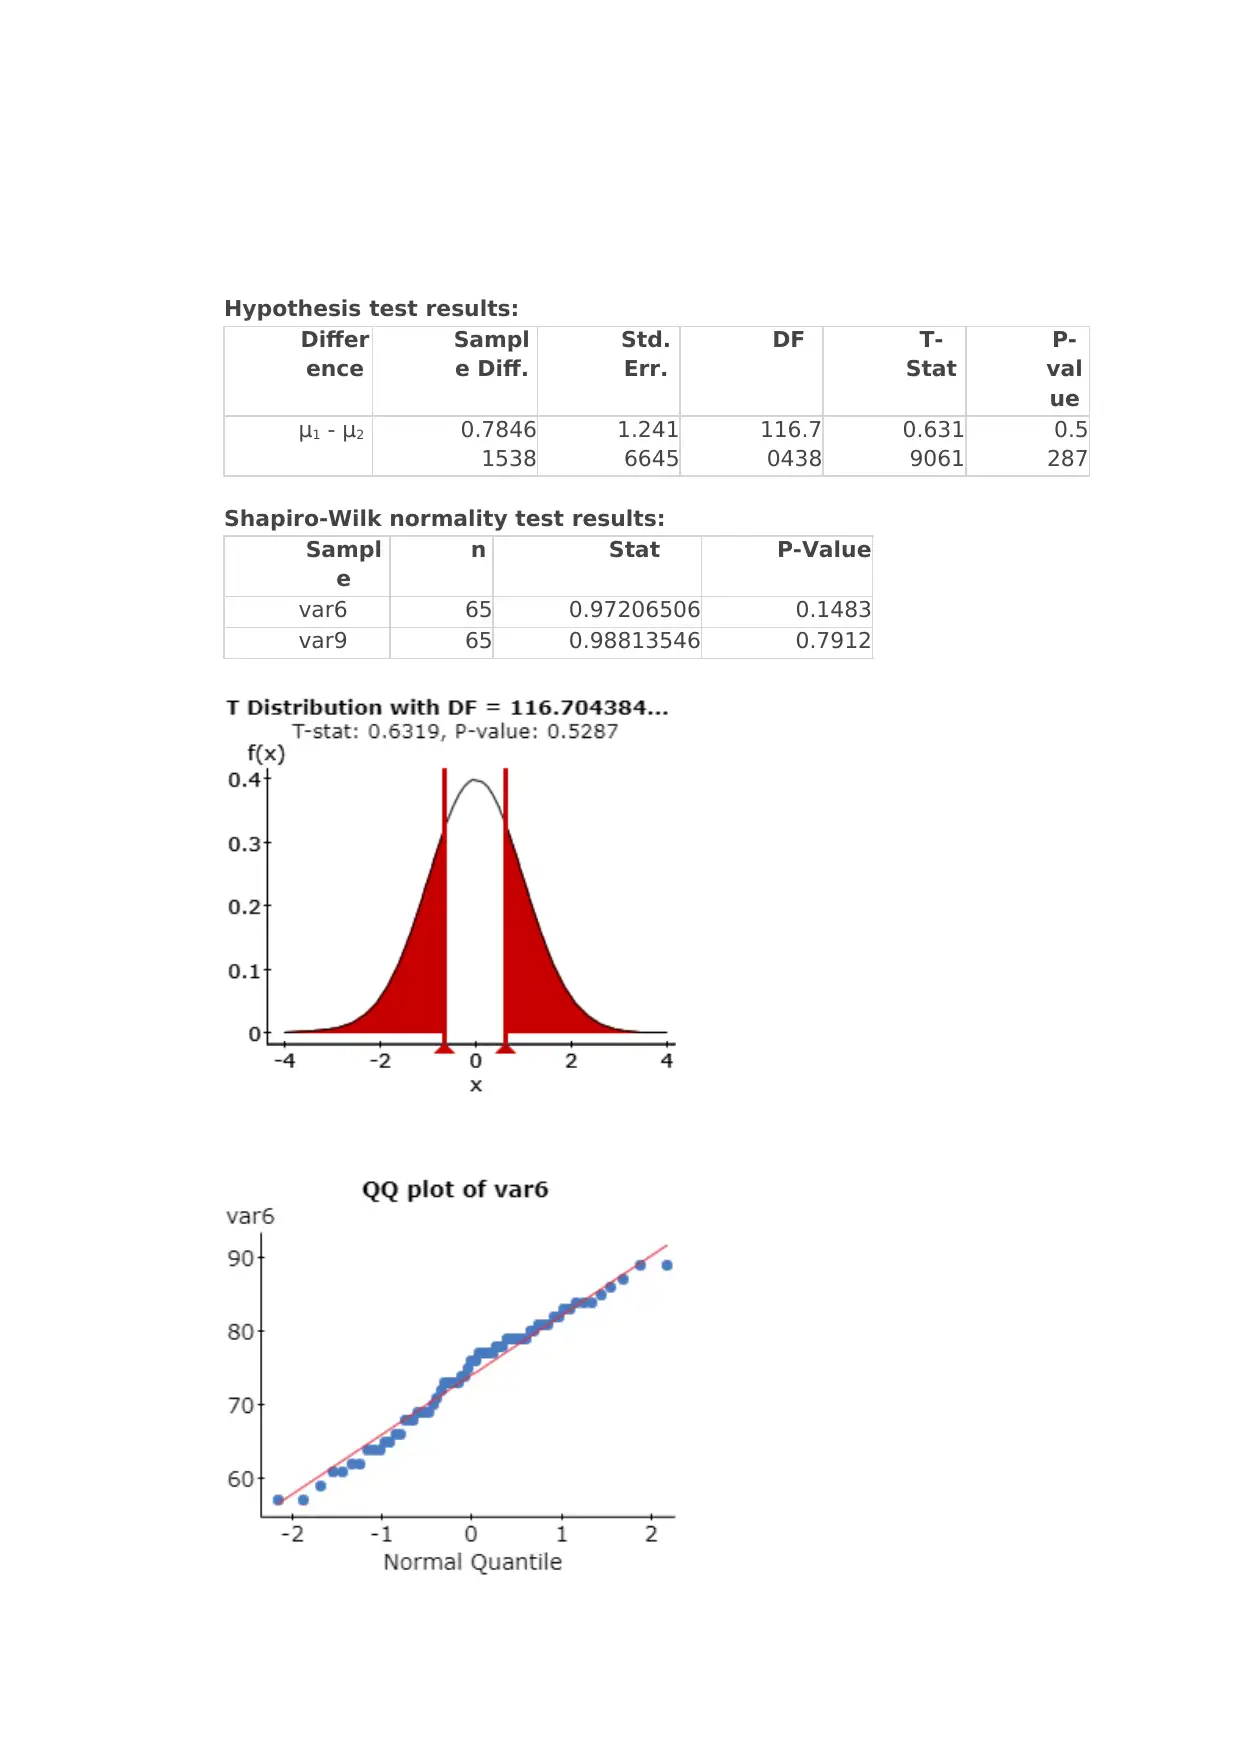
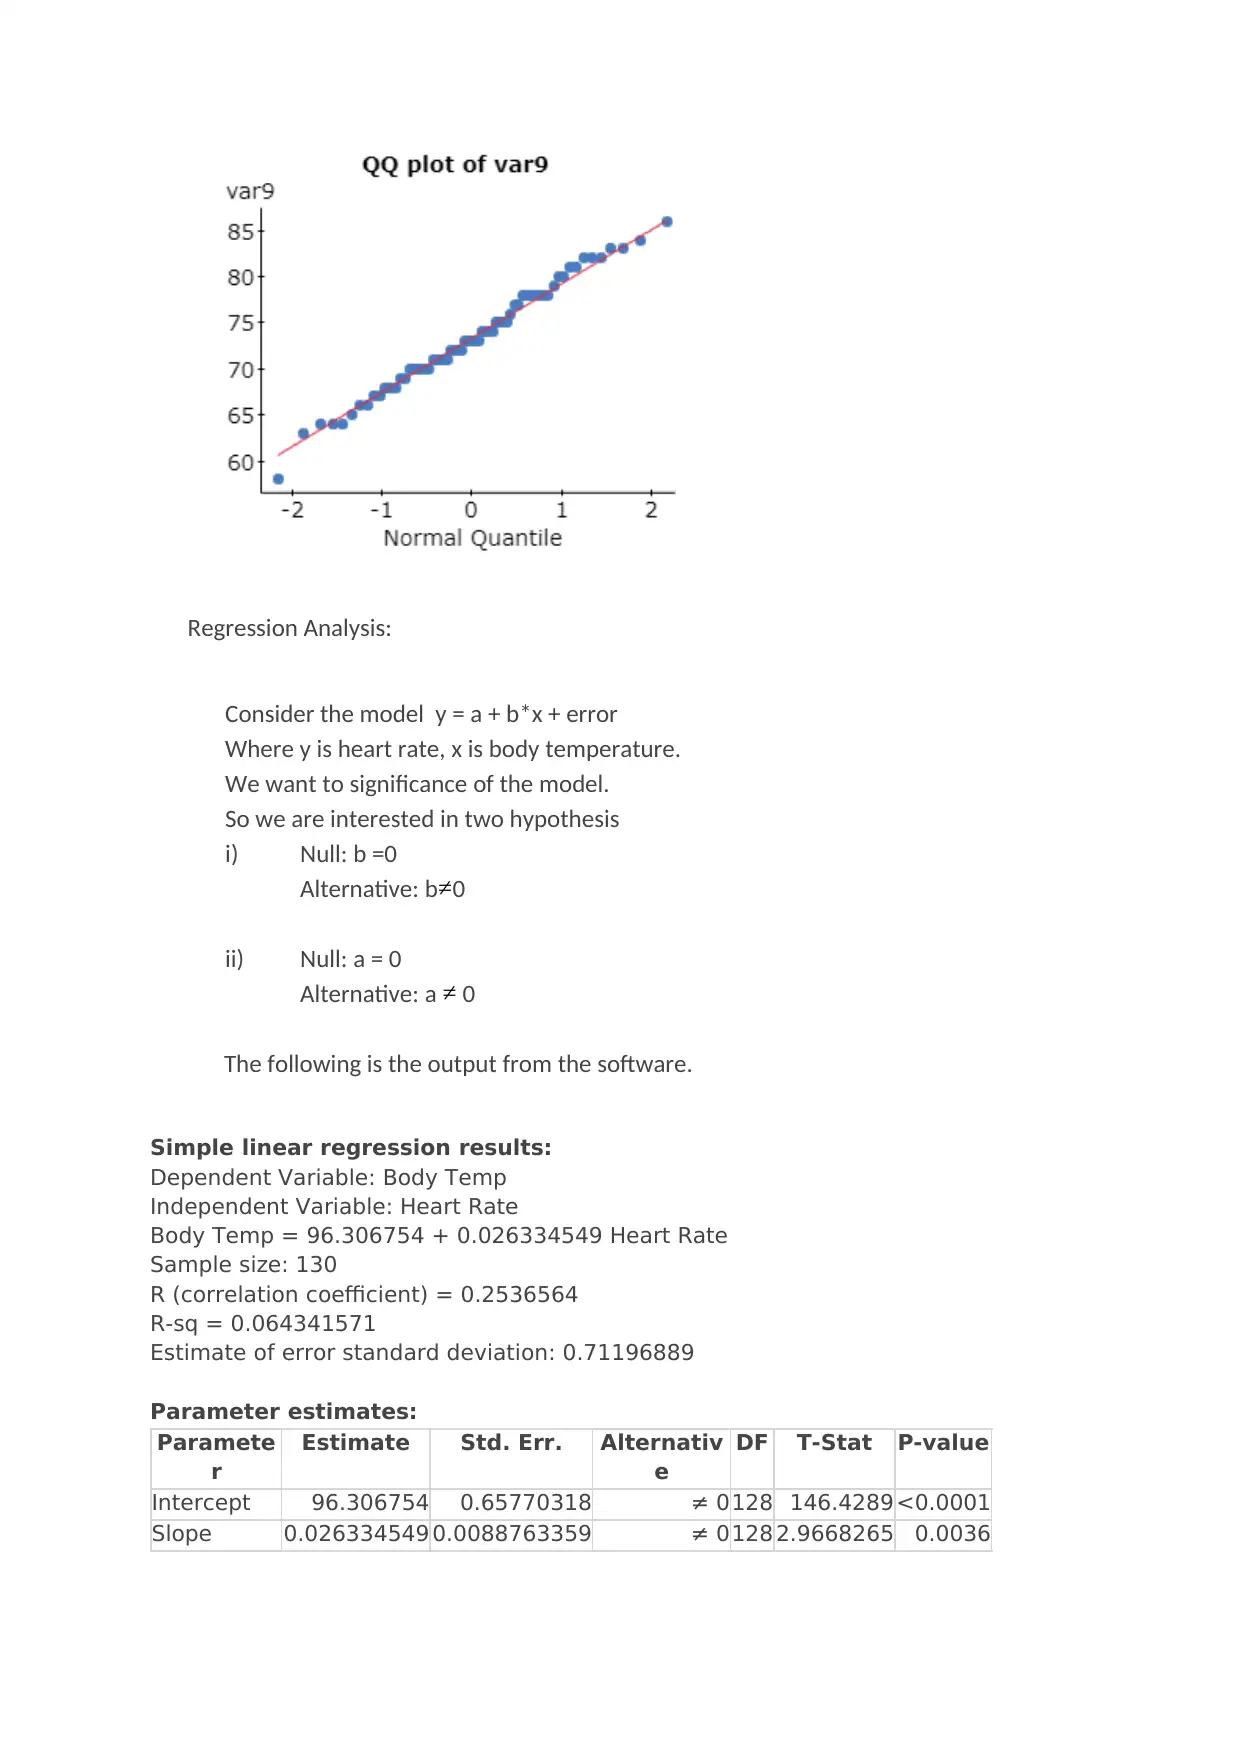
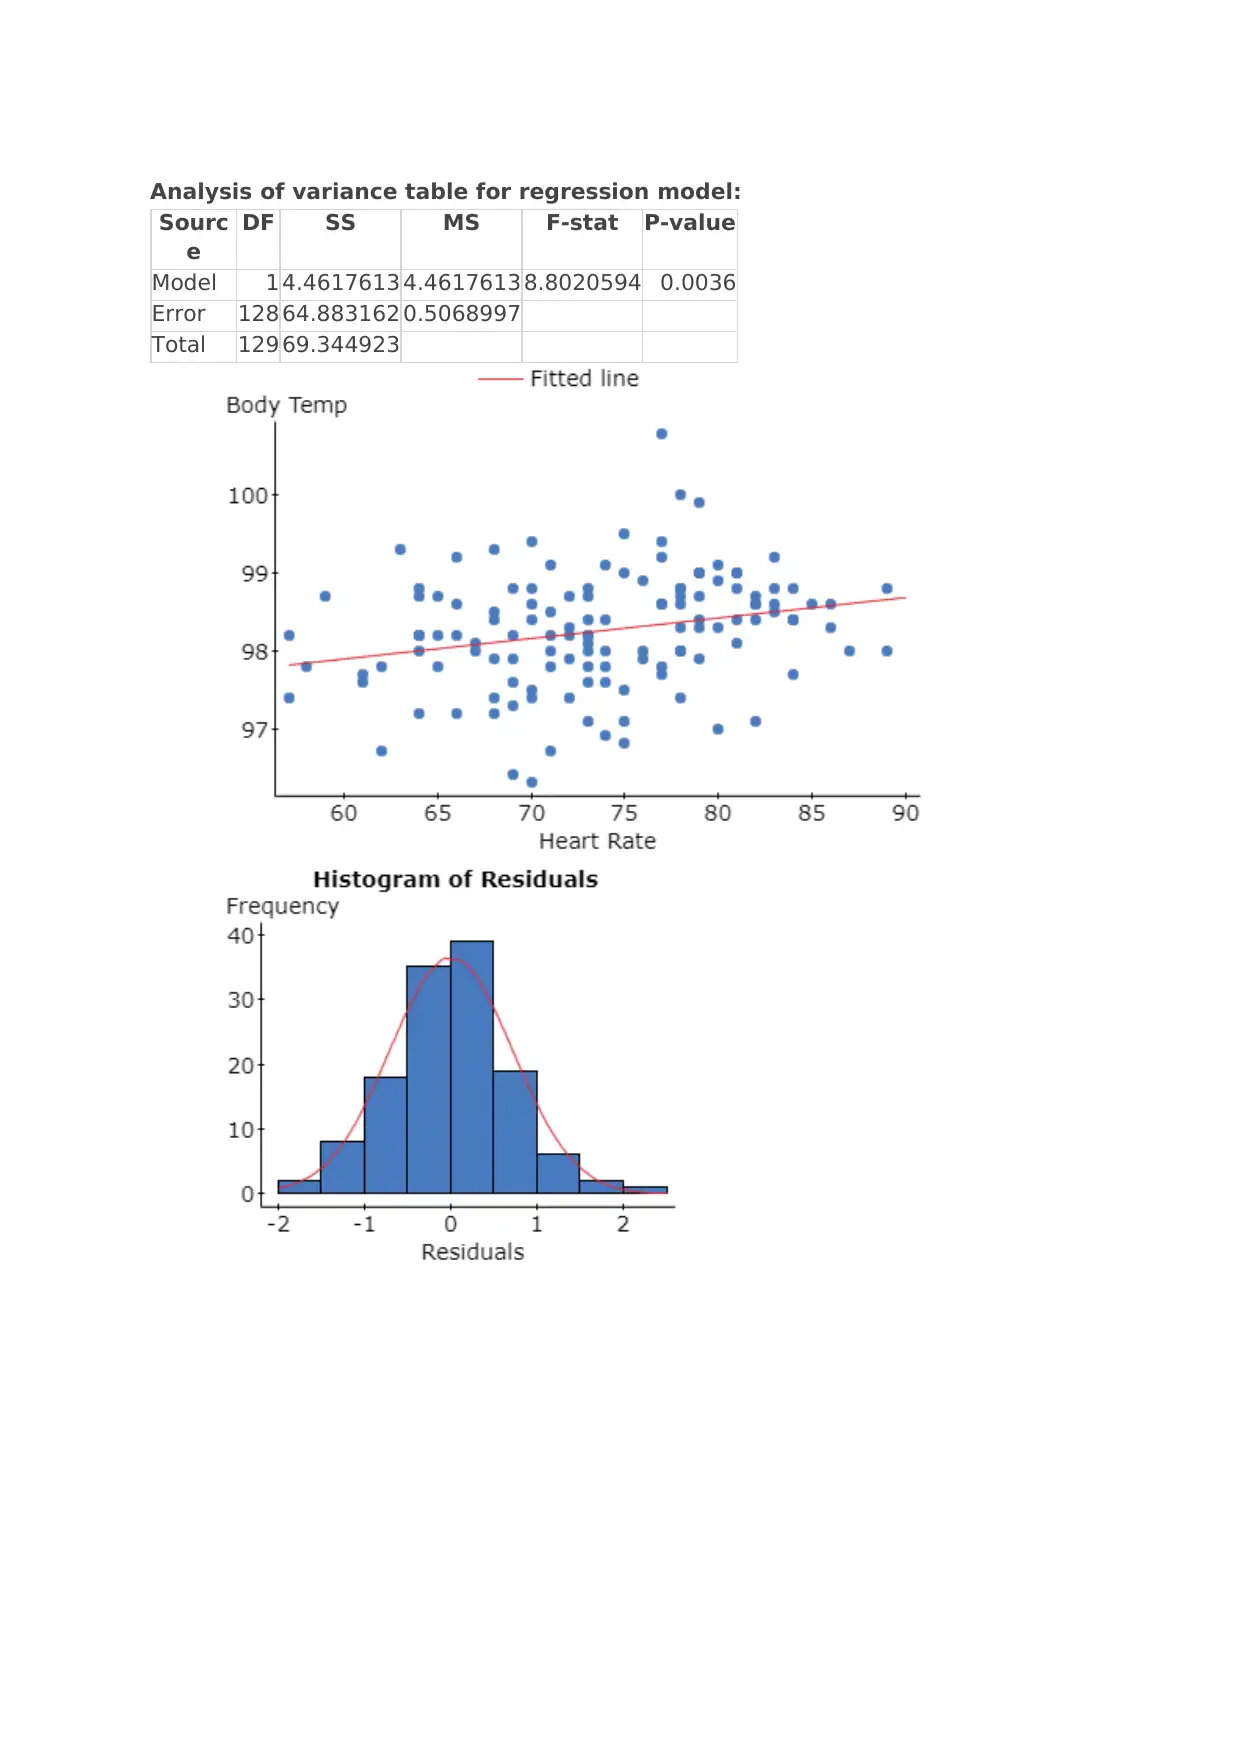
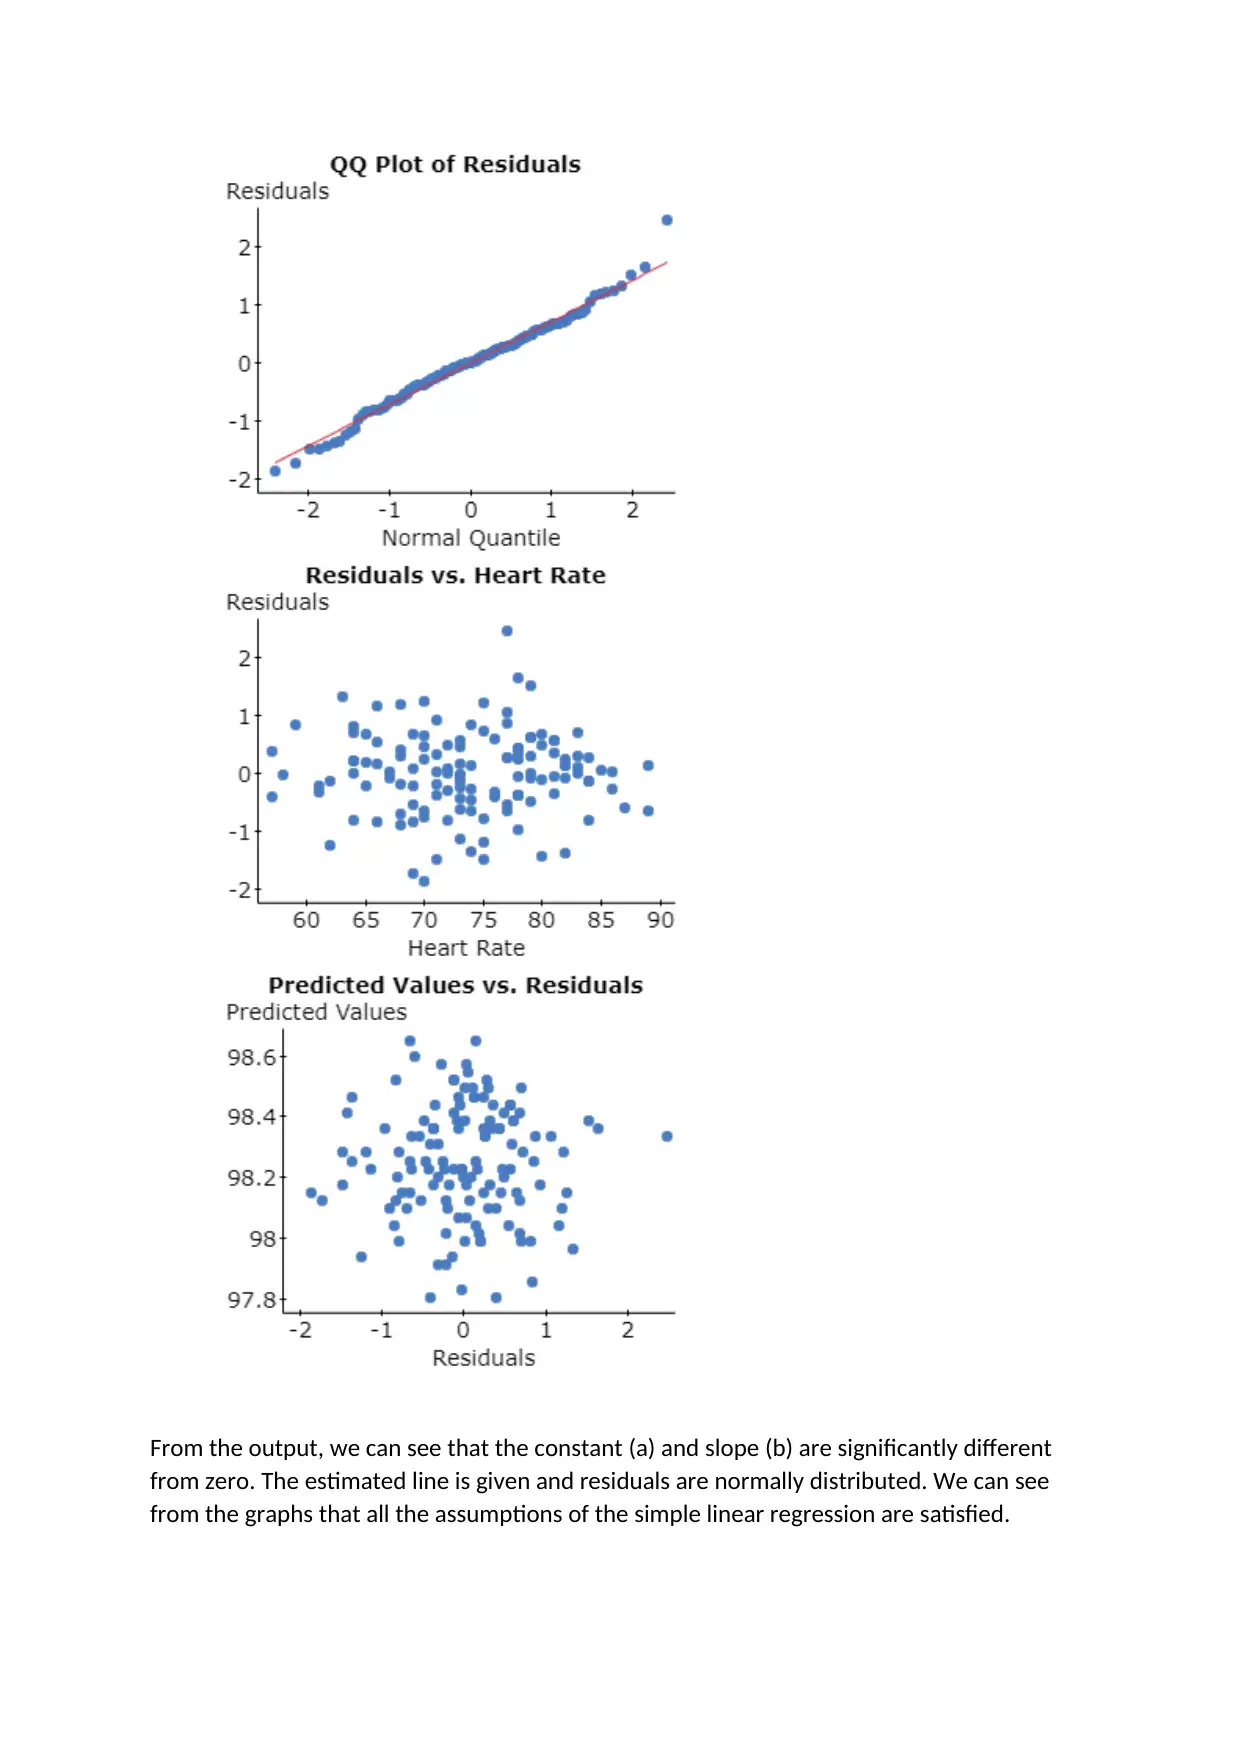
This report presents a statistical inquiry and analysis of body temperature and heart rate data, including 130 samples with gender as a categorical variable. The analysis begins with a research proposal exploring potential differences in body temperature and heart rate between males and females, and the relationship between these variables. Descriptive statistics, including summary statistics, box plots, and histograms, are provided to visualize the data's distribution. Inferential statistics, such as t-tests and Pearson correlation tests, are employed to investigate significant correlations between body temperature and heart rate, and to determine if there are significant differences in mean body temperatures and heart rates between genders. The analysis also includes regression analysis to model the relationship between heart rate and body temperature, assessing the significance of the model parameters and checking model assumptions. The report concludes with references to relevant statistical resources.
1 out of 13
Related Documents


Your All-in-One AI-Powered Toolkit for Academic Success.
+13062052269
info@desklib.com
Available 24*7 on WhatsApp / Email
![[object Object]](/_next/static/media/star-bottom.7253800d.svg)
Copyright © 2020–2026 A2Z Services. All Rights Reserved. Developed and managed by ZUCOL.