Analysis of Call Centre Operations using Statistical Techniques
Added on 2023-04-21
11 Pages3165 Words282 Views
STATISTICS
STUDENT ID:
[Pick the date]
STUDENT ID:
[Pick the date]

1. Executive Summary
The given report pertains to highlighting the various operational parameters of the call centre
using the sample data and relevant statistical analysis. Descriptive statistics techniques have
been used to highlight the mean value, extent of variation, skew and kurtosis related to call
duration. The distribution of the sample call duration closely resembles a normal distribution.
The given dataset also contains a discrete variable in the form of the number of calls done by
a given agent in an hour and the same can be expressed using a Poisson distribution. Using
the confidence interval technique under inferential statistics, the average call duration for the
whole call population has been estimated at 95% confidence level. This has come to lie
between 5.31 minutes and 5.68 minutes which implies that there is 95% chance that
population average would lie in this interval. Also, regression analysis has been conducted
between average call duration and number of hourly calls which leads to the conclusion that
the relationship between the two variables is not significant.
2. Introduction
The given report pertains to a call centre which has operations in multiple geographies i.e.
Dublin, Cork and Galway. With regards to call centre, one of the parameters of operational
performance of the staff corresponds to the number of hours received per hour and the
proportion of unresolved calls. Typically, the calls received should be higher as this would
lead to lower employee requirement and the proportion of unresolved calls should be low so
as to ensure that the customer satisfaction is high. Additionally, for sample employees the call
duration of 10 sample calls has also been recorded. Finally, the proportion of different types
of calls attended by the randomly selected sample employees has also been summarised in a
tabular manner by considering 10 random calls.
In wake of the above mentioned sample data, the objective is to present an analysis of the
average call duration using various descriptive and inferential statistics tools and techniques.
It is imperative to note that the objective of descriptive statistics use is to summarise the key
characteristics of the sample data such as central tendency and dispersion in the sample data.
The objective of inferential statistics usage is to estimate the population parameter using the
sample data. For the purposes of the given report, confidence interval of mean call duration
has been estimated for the call centre as a whole. Also, the potential relationship that exists
between the call duration and the number of calls has also been explored using regression
analysis as the tool of choice.
1
3. Analysis
The various tasks pertaining to the given data are performed in this section.
Question 1
Through this task, the aim is to present a summary of the average call duration for the
sample. The concerned data corresponds to the call duration for 10 calls for the randomly
selected 50 agents. As a result, the total sample size amounts to 500 calls. The task required a
continuous variable and this variable is continuous in nature as the call duration can also
assume non-integral values as the duration of calls need not be in integers.
The central tendency of the data is captured through the use of various descriptive summary
statistics such as mean, median. The mean represents the average of the sample. The median
value represents the mid-point whereby 50% of the sample values are lower than or equal to
the median value. The average has been computed by taking into consideration the data for
50 agents and has come out as 5.49 minutes. This implies that on average it can be expected
that a given customer call at the call centre would last for this much duration. The median call
duration has come out as 5.51 minutes. This indicates that 250 customer calls from the given
sample data would have call duration that would have lasted for less than or equal to 5.51
minutes (Eriksson and Kovalainen, 2015).
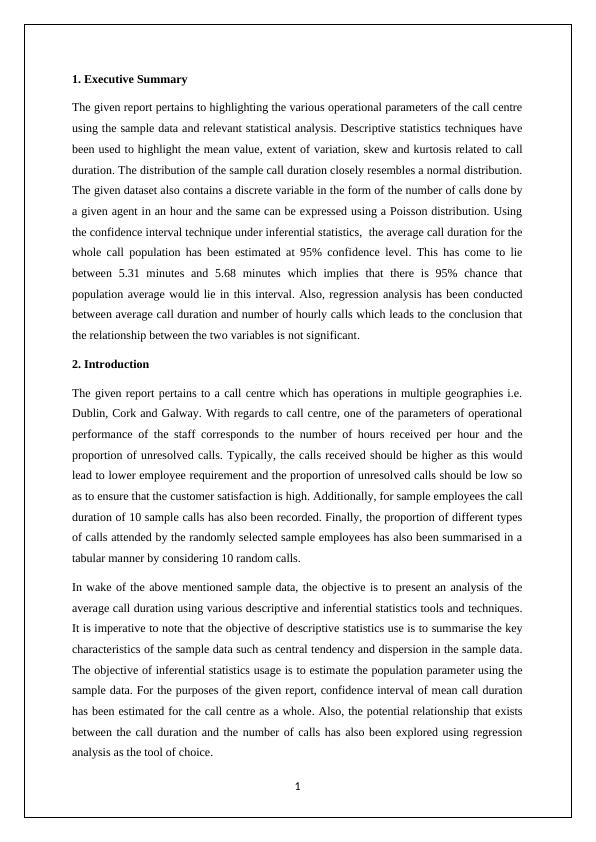
Also, the dispersion of the given variable needs to be expressed for which measures such as
standard deviation, variance or Interquartile range (IQR) may be considered. For the given
sample, the respective values of the above three statistics have been computed using Excel
and summarised in the table below.
The IQR value is 2.82 minutes which implies that middle 50% of the call duration would lie
within duration of 2.82 minutes. Further, standard deviation for the call duration is 2.09
minutes which when compared to the mean clearly implies that there is moderate to high
variation in the call duration in the sample data which is on expected lines as there depending
on the underlying query of the customer and the underlying understanding ability of the
customer and the agent, the call duration would show variation from the average time (Hair
et. al., 2015).
2
The various tasks pertaining to the given data are performed in this section.
Question 1
Through this task, the aim is to present a summary of the average call duration for the
sample. The concerned data corresponds to the call duration for 10 calls for the randomly
selected 50 agents. As a result, the total sample size amounts to 500 calls. The task required a
continuous variable and this variable is continuous in nature as the call duration can also
assume non-integral values as the duration of calls need not be in integers.
The central tendency of the data is captured through the use of various descriptive summary
statistics such as mean, median. The mean represents the average of the sample. The median
value represents the mid-point whereby 50% of the sample values are lower than or equal to
the median value. The average has been computed by taking into consideration the data for
50 agents and has come out as 5.49 minutes. This implies that on average it can be expected
that a given customer call at the call centre would last for this much duration. The median call
duration has come out as 5.51 minutes. This indicates that 250 customer calls from the given
sample data would have call duration that would have lasted for less than or equal to 5.51
minutes (Eriksson and Kovalainen, 2015).
Also, the dispersion of the given variable needs to be expressed for which measures such as
standard deviation, variance or Interquartile range (IQR) may be considered. For the given
sample, the respective values of the above three statistics have been computed using Excel
and summarised in the table below.
The IQR value is 2.82 minutes which implies that middle 50% of the call duration would lie
within duration of 2.82 minutes. Further, standard deviation for the call duration is 2.09
minutes which when compared to the mean clearly implies that there is moderate to high
variation in the call duration in the sample data which is on expected lines as there depending
on the underlying query of the customer and the underlying understanding ability of the
customer and the agent, the call duration would show variation from the average time (Hair
et. al., 2015).
2
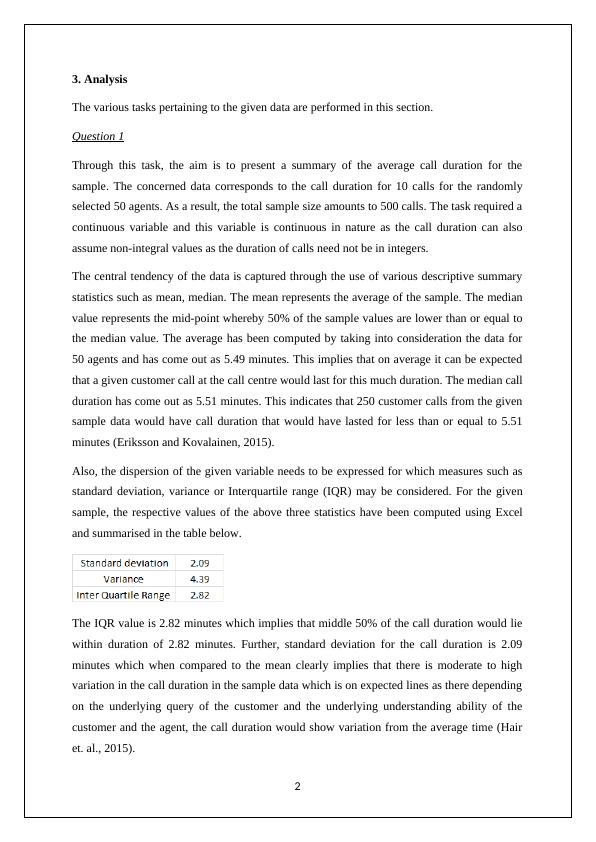
The skew and kurtosis for the data have also been computed using Excel and are summarised
below.
It is apparent that skew of the data is 0.11 which is quite low considering that 0 highlights the
normal distribution which is perfectly symmetric. However, for the given distribution, the
rightward tail would be marginally longer than the leftward tail. Also, the kurtosis is
marginally negative and is close to zero which is the value required for normal distribution.
The height and thickness of the peak is represented by kurtosis. If the kurtosis value is high in
magnitude, then the peak is also taller while a lower magnitude indicates lower height.
Further, the sign indicates the underlying thickness of the peak (Hillier, 2016).
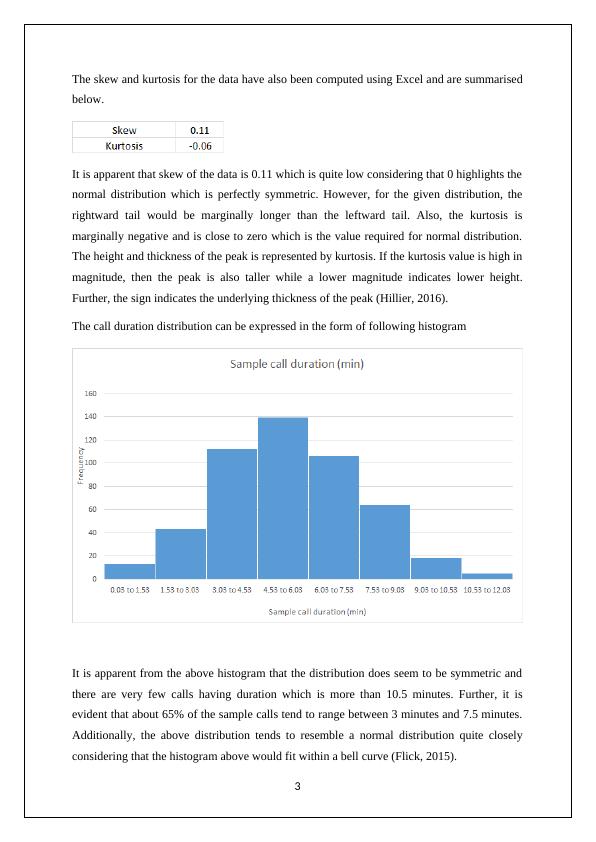
The call duration distribution can be expressed in the form of following histogram
It is apparent from the above histogram that the distribution does seem to be symmetric and
there are very few calls having duration which is more than 10.5 minutes. Further, it is
evident that about 65% of the sample calls tend to range between 3 minutes and 7.5 minutes.
Additionally, the above distribution tends to resemble a normal distribution quite closely
considering that the histogram above would fit within a bell curve (Flick, 2015).
3
below.
It is apparent that skew of the data is 0.11 which is quite low considering that 0 highlights the
normal distribution which is perfectly symmetric. However, for the given distribution, the
rightward tail would be marginally longer than the leftward tail. Also, the kurtosis is
marginally negative and is close to zero which is the value required for normal distribution.
The height and thickness of the peak is represented by kurtosis. If the kurtosis value is high in
magnitude, then the peak is also taller while a lower magnitude indicates lower height.
Further, the sign indicates the underlying thickness of the peak (Hillier, 2016).
The call duration distribution can be expressed in the form of following histogram
It is apparent from the above histogram that the distribution does seem to be symmetric and
there are very few calls having duration which is more than 10.5 minutes. Further, it is
evident that about 65% of the sample calls tend to range between 3 minutes and 7.5 minutes.
Additionally, the above distribution tends to resemble a normal distribution quite closely
considering that the histogram above would fit within a bell curve (Flick, 2015).
3
End of preview
Want to access all the pages? Upload your documents or become a member.
Related Documents
Inferential Statistics Analysis and Writeuplg...
|4
|1405
|295
Business Analytics - Data Analyticslg...
|11
|806
|39
Descriptive Statistics for Medical Malpractice Claimslg...
|26
|2458
|457
Business Statistics: Confidence Intervals and Control Chartslg...
|9
|1669
|478
Foundation Skills in Data Analysislg...
|3
|1027
|20
Statistical Analysis of Internet Speedlg...
|18
|1648
|21