Inferential Statistics Analysis and Writeup
Added on 2023-05-29
4 Pages1405 Words295 Views
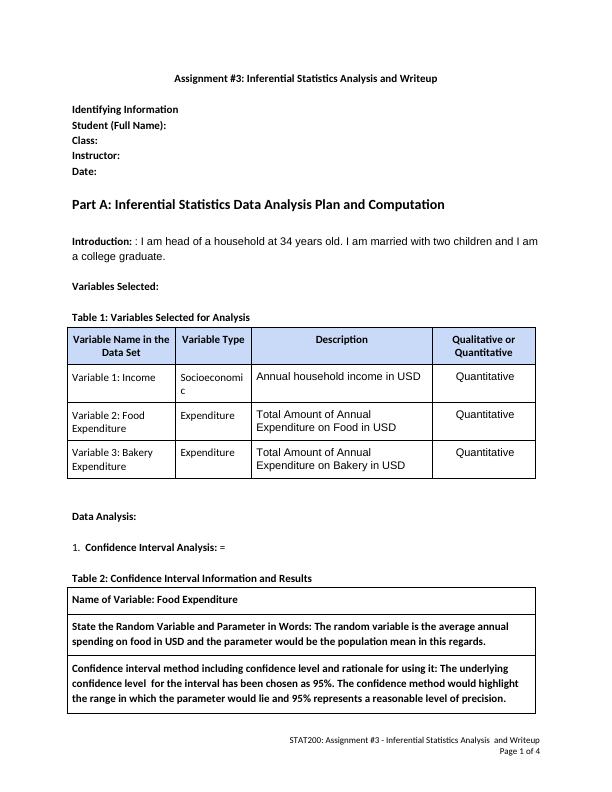
Assignment #3: Inferential Statistics Analysis and Writeup
Identifying Information
Student (Full Name):
Class:
Instructor:
Date:
Part A: Inferential Statistics Data Analysis Plan and Computation
Introduction: : I am head of a household at 34 years old. I am married with two children and I am
a college graduate.
Variables Selected:
Table 1: Variables Selected for Analysis
Variable Name in the
Data Set
Variable Type Description Qualitative or
Quantitative
Variable 1: Income Socioeconomi
c
Annual household income in USD Quantitative
Variable 2: Food
Expenditure
Expenditure Total Amount of Annual
Expenditure on Food in USD
Quantitative
Variable 3: Bakery
Expenditure
Expenditure Total Amount of Annual
Expenditure on Bakery in USD
Quantitative
Data Analysis:
1. Confidence Interval Analysis: =
Table 2: Confidence Interval Information and Results
Name of Variable: Food Expenditure
State the Random Variable and Parameter in Words: The random variable is the average annual
spending on food in USD and the parameter would be the population mean in this regards.
Confidence interval method including confidence level and rationale for using it: The underlying
confidence level for the interval has been chosen as 95%. The confidence method would highlight
the range in which the parameter would lie and 95% represents a reasonable level of precision.
STAT200: Assignment #3 - Inferential Statistics Analysis and Writeup
Page 1 of 4
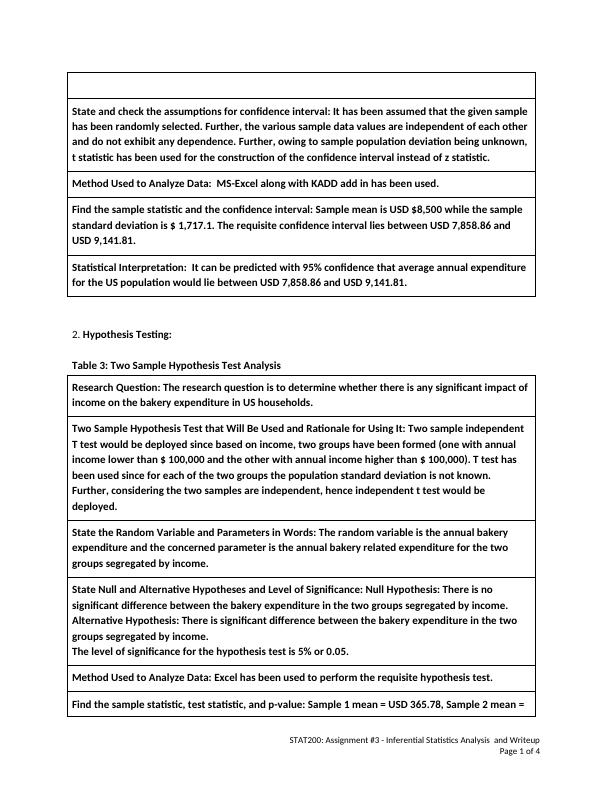
State and check the assumptions for confidence interval: It has been assumed that the given sample
has been randomly selected. Further, the various sample data values are independent of each other
and do not exhibit any dependence. Further, owing to sample population deviation being unknown,
t statistic has been used for the construction of the confidence interval instead of z statistic.
Method Used to Analyze Data: MS-Excel along with KADD add in has been used.
Find the sample statistic and the confidence interval: Sample mean is USD $8,500 while the sample
standard deviation is $ 1,717.1. The requisite confidence interval lies between USD 7,858.86 and
USD 9,141.81.
Statistical Interpretation: It can be predicted with 95% confidence that average annual expenditure
for the US population would lie between USD 7,858.86 and USD 9,141.81.
2. Hypothesis Testing:
Table 3: Two Sample Hypothesis Test Analysis
Research Question: The research question is to determine whether there is any significant impact of
income on the bakery expenditure in US households.
Two Sample Hypothesis Test that Will Be Used and Rationale for Using It: Two sample independent
T test would be deployed since based on income, two groups have been formed (one with annual
income lower than $ 100,000 and the other with annual income higher than $ 100,000). T test has
been used since for each of the two groups the population standard deviation is not known.
Further, considering the two samples are independent, hence independent t test would be
deployed.
State the Random Variable and Parameters in Words: The random variable is the annual bakery
expenditure and the concerned parameter is the annual bakery related expenditure for the two
groups segregated by income.
State Null and Alternative Hypotheses and Level of Significance: Null Hypothesis: There is no
significant difference between the bakery expenditure in the two groups segregated by income.
Alternative Hypothesis: There is significant difference between the bakery expenditure in the two
groups segregated by income.
The level of significance for the hypothesis test is 5% or 0.05.
Method Used to Analyze Data: Excel has been used to perform the requisite hypothesis test.
Find the sample statistic, test statistic, and p-value: Sample 1 mean = USD 365.78, Sample 2 mean =
STAT200: Assignment #3 - Inferential Statistics Analysis and Writeup
Page 1 of 4
End of preview
Want to access all the pages? Upload your documents or become a member.
Related Documents
Inferential Statistics Analysis and Writeuplg...
|6
|1329
|191
Statistical Analysis on Housing and Electricity Expenditure in USAlg...
|5
|523
|52
Quantitative Methods: Confidence Interval and Estimatorlg...
|6
|624
|385
Pearson Correlation in Quantitative Reasoninglg...
|8
|1598
|497
Inferential Statistics Assignment - Analysis of Annual Spending on Food by Consumers in the United Stateslg...
|12
|2499
|178
Statistics Study Materiallg...
|7
|1378
|58