Statistical Analysis of International Flights in Australia
Added on 2023-04-21
9 Pages2620 Words464 Views
STATISTICS
STUDENT ID:
[Pick the date]
STUDENT ID:
[Pick the date]

Section 1: Introduction
a) The given report is based on the backdrop of the increasing international traffic seen in Australia.
The interesting aspect is not only that traffic on international routes is on the rise but the fact that
the market share of international airlines is on the rise which raises a challenge for the domestic
airlines. The growth rate for the international airlines has been significantly higher in comparison to
their domestic peers. Besides other factors, one factor which has aided this is the cutting of capacity
on part of Qantas as a measure of cost rationalisation for achieving higher occupancy rate
(AnnaAero, 2018). In this midst of increasing international traffic, the various airports need to make
suitable changes in order to attract a larger share of this increasing pie.
b) The given dataset 1 captures pivotal information with regards to a set of 1000 international flights
that either fly from or fly to Australia. The data highlights information related to several variables
including the route, source and destination information, monthly frequency, seats and number of
stops. This particular dataset should be labelled as secondary data considering the fact that this data
of 1000 flights has not been collected by me and has instead been provided by the University which
has obtained this from an outside source (Flick, 2015). A significant amount of variables that the
dataset captures are in the form of categorical variables which have been reflected using nominal
scale of measurement. However, there do exist certain variables which exist in the form of numerical
values (stop, all flights etc.) that tend to deploy ratio measurement scale for representation (Eriksson
and Kovalainen, 2015). For the given dataset, the population of interest includes all international
flights which have the source city or destination city located in Australia.
c) The dataset 2 is primary in nature unlike dataset 1. This is established from the fact that this data
has not been obtained from any other source but rather collected by conducting a survey comprising
of 40 respondents from KOI (Medhi, 2016). The information captured by this dataset in limited in
scope as only three variables are represented which indicate the source, destination along with the
airline or operator. The dataset only comprises of non-numerical data which is categorical.
Considering that automatic arrangement of the variables is not possible based on the data, hence
the nominal measurement scale has been used for the data representation. An issue worth
highlighting in the context of this dataset is that the underlying sampling technique to choose the
respondents for the survey from the KOI students is not probability based and hence not random.
Convenience is the underlying consideration for the choice of sample and hence it is possible that
the results highlighted from the survey data is biased and lacks reliability. Additionally, small sample
size is also an issue which needs to be addressed here for results that are both valid and reliable
(Hair et. al.,2015).
a) The objective is to highlight the summary statistics of “All Flight” variable based on dataset 1
which has been carried out below.
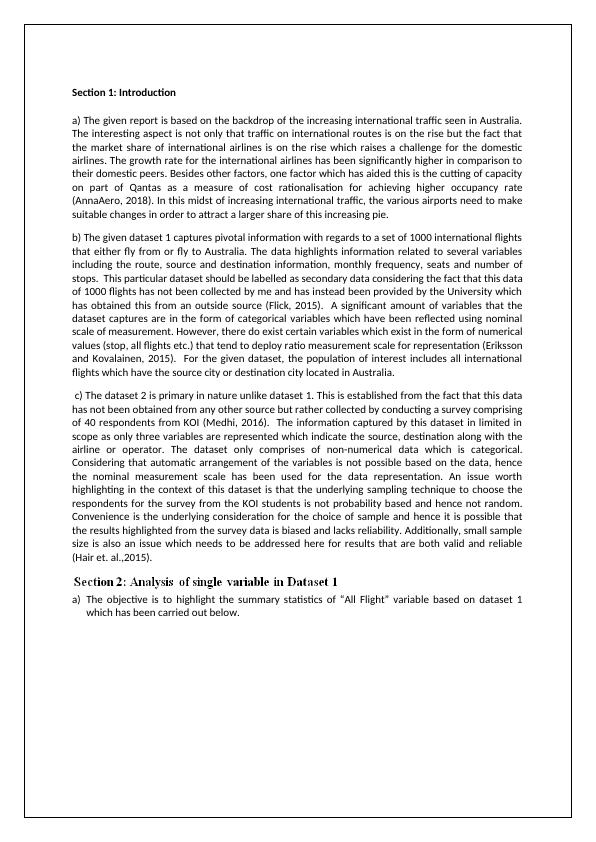
The summary statistics obtained from Excel clearly indicates that the data has a high positive skew
value which implies that there are certain values which are very high and therefore could be termed
as outliers. While the mean value of variable is only 24.42 but the corresponding range for this
variable is very high at 150 with a minimum value of 1 and maximum of 155. This indicates that the
sample includes a flight which flies only once a month in comparison to one which flies more than 5
times in a day. Comparing the mean value with the maximum value along with deviation, it can be
inferred that the outliers are present in the given variable. Further, the significant degree of skew
that is present would imply that the underlying shape for the variable given would be non-symmetric
and also the underlying distribution would not be categorised as normal (Hillier,2016).
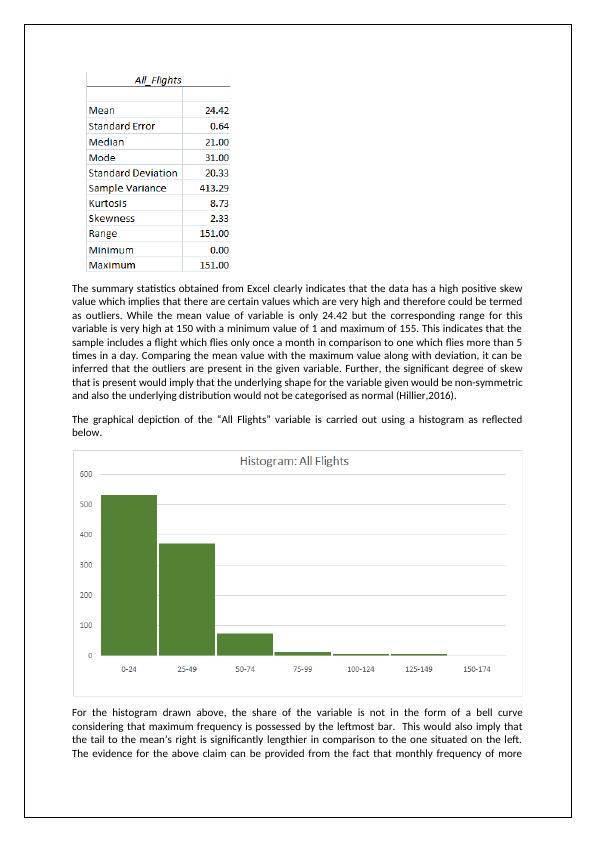
The graphical depiction of the “All Flights” variable is carried out using a histogram as reflected
below.
For the histogram drawn above, the share of the variable is not in the form of a bell curve
considering that maximum frequency is possessed by the leftmost bar. This would also imply that
the tail to the mean’s right is significantly lengthier in comparison to the one situated on the left.
The evidence for the above claim can be provided from the fact that monthly frequency of more
value which implies that there are certain values which are very high and therefore could be termed
as outliers. While the mean value of variable is only 24.42 but the corresponding range for this
variable is very high at 150 with a minimum value of 1 and maximum of 155. This indicates that the
sample includes a flight which flies only once a month in comparison to one which flies more than 5
times in a day. Comparing the mean value with the maximum value along with deviation, it can be
inferred that the outliers are present in the given variable. Further, the significant degree of skew
that is present would imply that the underlying shape for the variable given would be non-symmetric
and also the underlying distribution would not be categorised as normal (Hillier,2016).
The graphical depiction of the “All Flights” variable is carried out using a histogram as reflected
below.
For the histogram drawn above, the share of the variable is not in the form of a bell curve
considering that maximum frequency is possessed by the leftmost bar. This would also imply that
the tail to the mean’s right is significantly lengthier in comparison to the one situated on the left.
The evidence for the above claim can be provided from the fact that monthly frequency of more
End of preview
Want to access all the pages? Upload your documents or become a member.
Related Documents
Analysis of International Flights in Australialg...
|9
|2400
|97
Analysis of International Flight Traffic in Australialg...
|11
|2383
|237
Analysis of International Flights in Australialg...
|9
|1734
|256
Analysis of International Flights in Australialg...
|11
|2547
|107
Analyzing Airlines Services Data: Insights from Dataset Analysis and Discussionlg...
|8
|2251
|190
Analysis of Aviation Industry in Australialg...
|9
|1558
|411