Statistical Analysis of International Flights in Australia
VerifiedAdded on 2023/04/21
|9
|2620
|464
AI Summary
This report provides a statistical analysis of international flights in Australia, including summary statistics, distribution analysis, and performance comparison of airlines and airports. The analysis reveals insights into the increasing international traffic and challenges faced by domestic airlines. The dataset used includes information on routes, frequency, seats, and stops. The report also discusses the methodology and limitations of the data collection process. Recommendations for future research are provided.
Contribute Materials
Your contribution can guide someone’s learning journey. Share your
documents today.

STATISTICS
STUDENT ID:
[Pick the date]
STUDENT ID:
[Pick the date]
Secure Best Marks with AI Grader
Need help grading? Try our AI Grader for instant feedback on your assignments.
Section 1: Introduction
a) The given report is based on the backdrop of the increasing international traffic seen in Australia.
The interesting aspect is not only that traffic on international routes is on the rise but the fact that
the market share of international airlines is on the rise which raises a challenge for the domestic
airlines. The growth rate for the international airlines has been significantly higher in comparison to
their domestic peers. Besides other factors, one factor which has aided this is the cutting of capacity
on part of Qantas as a measure of cost rationalisation for achieving higher occupancy rate
(AnnaAero, 2018). In this midst of increasing international traffic, the various airports need to make
suitable changes in order to attract a larger share of this increasing pie.
b) The given dataset 1 captures pivotal information with regards to a set of 1000 international flights
that either fly from or fly to Australia. The data highlights information related to several variables
including the route, source and destination information, monthly frequency, seats and number of
stops. This particular dataset should be labelled as secondary data considering the fact that this data
of 1000 flights has not been collected by me and has instead been provided by the University which
has obtained this from an outside source (Flick, 2015). A significant amount of variables that the
dataset captures are in the form of categorical variables which have been reflected using nominal
scale of measurement. However, there do exist certain variables which exist in the form of numerical
values (stop, all flights etc.) that tend to deploy ratio measurement scale for representation (Eriksson
and Kovalainen, 2015). For the given dataset, the population of interest includes all international
flights which have the source city or destination city located in Australia.
c) The dataset 2 is primary in nature unlike dataset 1. This is established from the fact that this data
has not been obtained from any other source but rather collected by conducting a survey comprising
of 40 respondents from KOI (Medhi, 2016). The information captured by this dataset in limited in
scope as only three variables are represented which indicate the source, destination along with the
airline or operator. The dataset only comprises of non-numerical data which is categorical.
Considering that automatic arrangement of the variables is not possible based on the data, hence
the nominal measurement scale has been used for the data representation. An issue worth
highlighting in the context of this dataset is that the underlying sampling technique to choose the
respondents for the survey from the KOI students is not probability based and hence not random.
Convenience is the underlying consideration for the choice of sample and hence it is possible that
the results highlighted from the survey data is biased and lacks reliability. Additionally, small sample
size is also an issue which needs to be addressed here for results that are both valid and reliable
(Hair et. al.,2015).
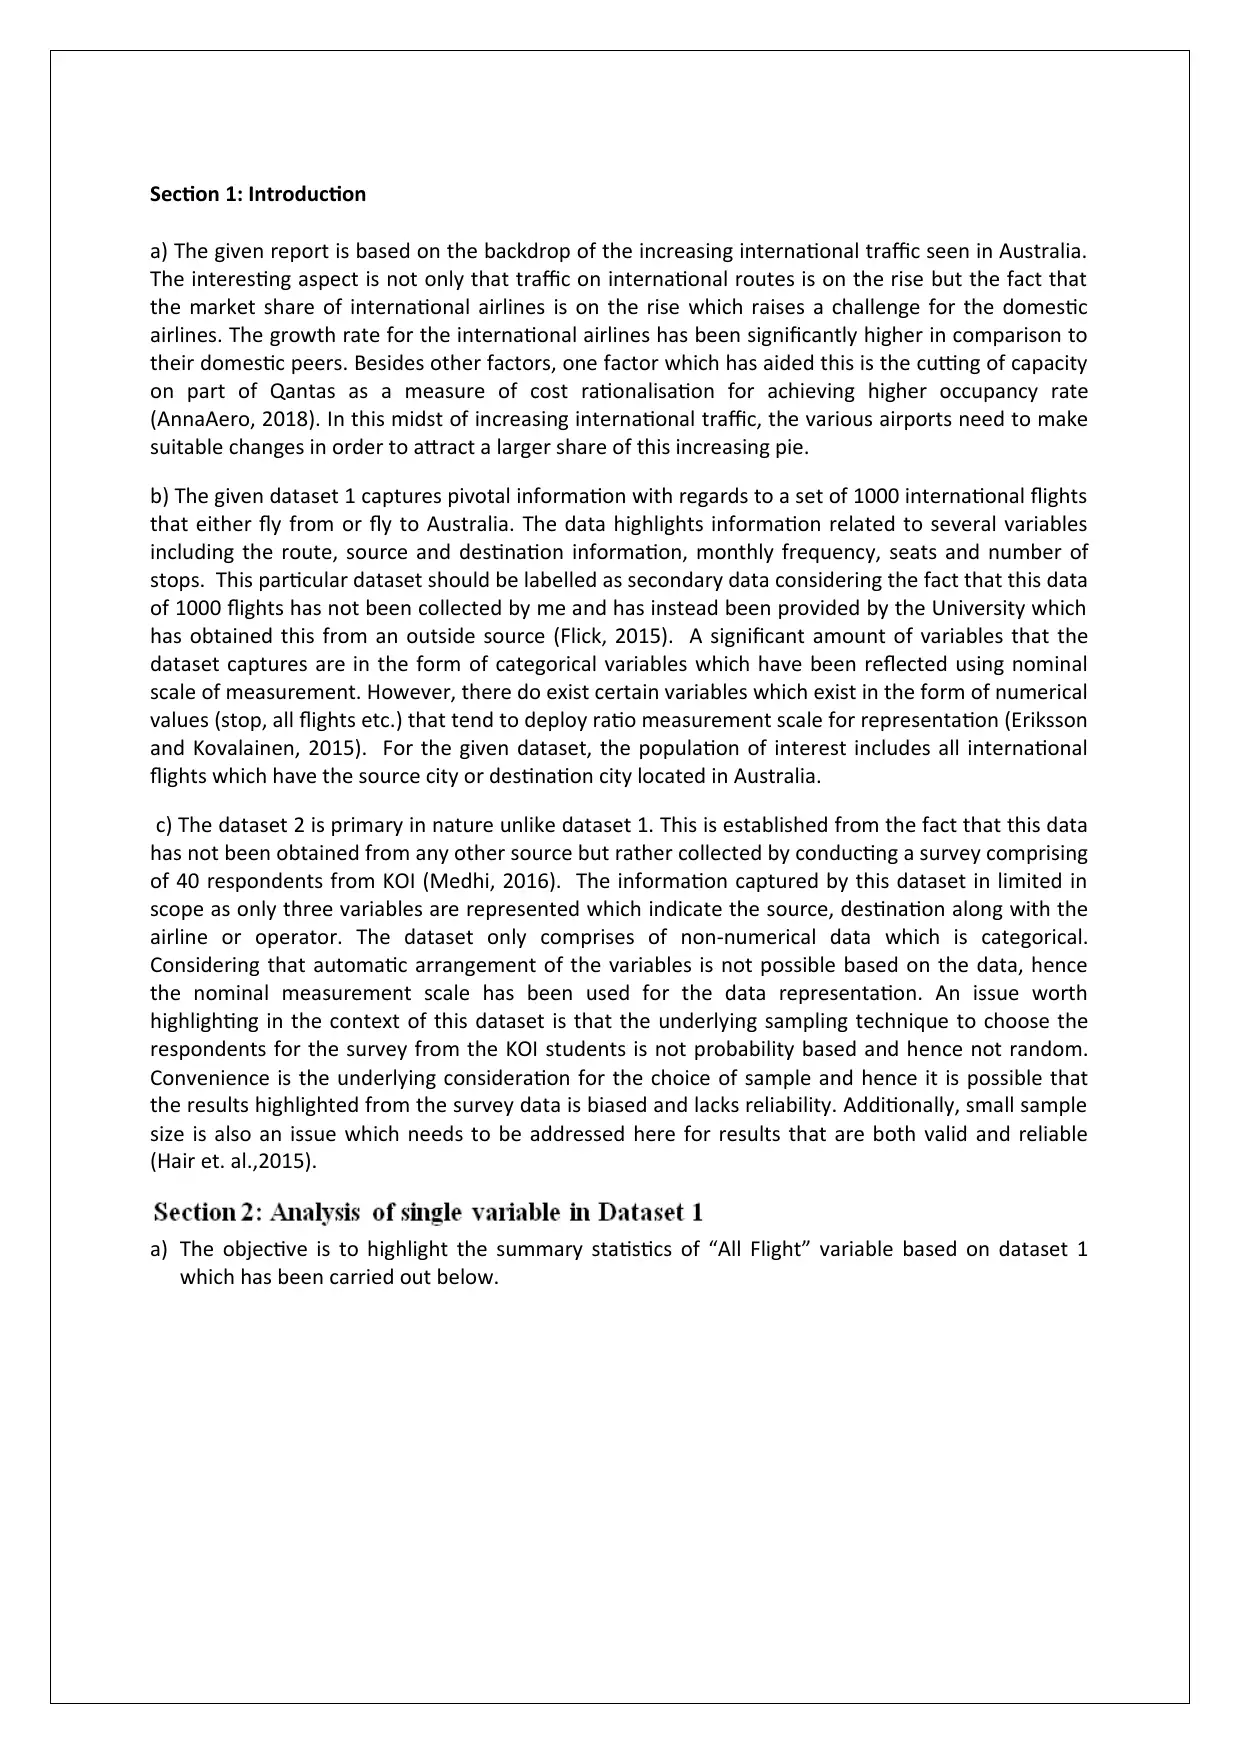
a) The objective is to highlight the summary statistics of “All Flight” variable based on dataset 1
which has been carried out below.
a) The given report is based on the backdrop of the increasing international traffic seen in Australia.
The interesting aspect is not only that traffic on international routes is on the rise but the fact that
the market share of international airlines is on the rise which raises a challenge for the domestic
airlines. The growth rate for the international airlines has been significantly higher in comparison to
their domestic peers. Besides other factors, one factor which has aided this is the cutting of capacity
on part of Qantas as a measure of cost rationalisation for achieving higher occupancy rate
(AnnaAero, 2018). In this midst of increasing international traffic, the various airports need to make
suitable changes in order to attract a larger share of this increasing pie.
b) The given dataset 1 captures pivotal information with regards to a set of 1000 international flights
that either fly from or fly to Australia. The data highlights information related to several variables
including the route, source and destination information, monthly frequency, seats and number of
stops. This particular dataset should be labelled as secondary data considering the fact that this data
of 1000 flights has not been collected by me and has instead been provided by the University which
has obtained this from an outside source (Flick, 2015). A significant amount of variables that the
dataset captures are in the form of categorical variables which have been reflected using nominal
scale of measurement. However, there do exist certain variables which exist in the form of numerical
values (stop, all flights etc.) that tend to deploy ratio measurement scale for representation (Eriksson
and Kovalainen, 2015). For the given dataset, the population of interest includes all international
flights which have the source city or destination city located in Australia.
c) The dataset 2 is primary in nature unlike dataset 1. This is established from the fact that this data
has not been obtained from any other source but rather collected by conducting a survey comprising
of 40 respondents from KOI (Medhi, 2016). The information captured by this dataset in limited in
scope as only three variables are represented which indicate the source, destination along with the
airline or operator. The dataset only comprises of non-numerical data which is categorical.
Considering that automatic arrangement of the variables is not possible based on the data, hence
the nominal measurement scale has been used for the data representation. An issue worth
highlighting in the context of this dataset is that the underlying sampling technique to choose the
respondents for the survey from the KOI students is not probability based and hence not random.
Convenience is the underlying consideration for the choice of sample and hence it is possible that
the results highlighted from the survey data is biased and lacks reliability. Additionally, small sample
size is also an issue which needs to be addressed here for results that are both valid and reliable
(Hair et. al.,2015).
a) The objective is to highlight the summary statistics of “All Flight” variable based on dataset 1
which has been carried out below.
The summary statistics obtained from Excel clearly indicates that the data has a high positive skew
value which implies that there are certain values which are very high and therefore could be termed
as outliers. While the mean value of variable is only 24.42 but the corresponding range for this
variable is very high at 150 with a minimum value of 1 and maximum of 155. This indicates that the
sample includes a flight which flies only once a month in comparison to one which flies more than 5
times in a day. Comparing the mean value with the maximum value along with deviation, it can be
inferred that the outliers are present in the given variable. Further, the significant degree of skew
that is present would imply that the underlying shape for the variable given would be non-symmetric
and also the underlying distribution would not be categorised as normal (Hillier,2016).
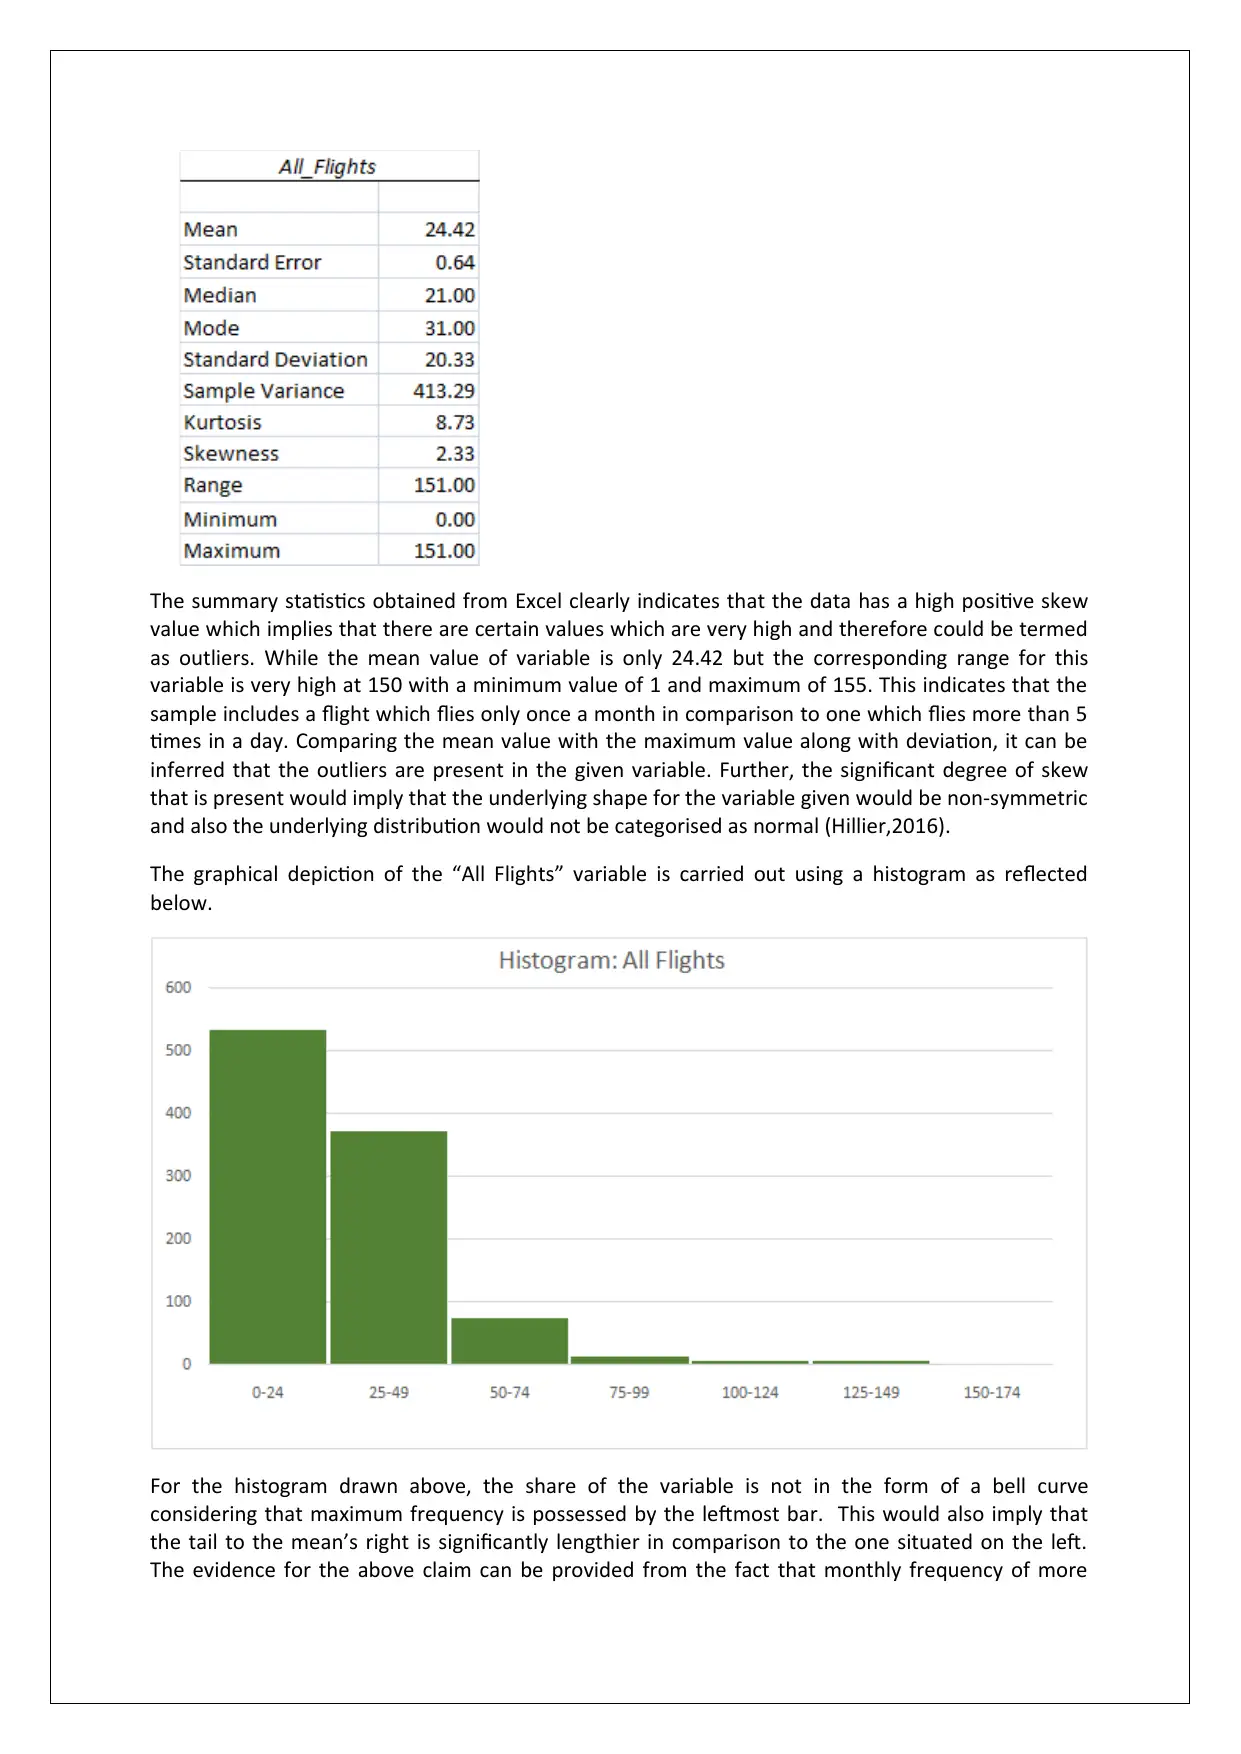
The graphical depiction of the “All Flights” variable is carried out using a histogram as reflected
below.
For the histogram drawn above, the share of the variable is not in the form of a bell curve
considering that maximum frequency is possessed by the leftmost bar. This would also imply that
the tail to the mean’s right is significantly lengthier in comparison to the one situated on the left.
The evidence for the above claim can be provided from the fact that monthly frequency of more
value which implies that there are certain values which are very high and therefore could be termed
as outliers. While the mean value of variable is only 24.42 but the corresponding range for this
variable is very high at 150 with a minimum value of 1 and maximum of 155. This indicates that the
sample includes a flight which flies only once a month in comparison to one which flies more than 5
times in a day. Comparing the mean value with the maximum value along with deviation, it can be
inferred that the outliers are present in the given variable. Further, the significant degree of skew
that is present would imply that the underlying shape for the variable given would be non-symmetric
and also the underlying distribution would not be categorised as normal (Hillier,2016).
The graphical depiction of the “All Flights” variable is carried out using a histogram as reflected
below.
For the histogram drawn above, the share of the variable is not in the form of a bell curve
considering that maximum frequency is possessed by the leftmost bar. This would also imply that
the tail to the mean’s right is significantly lengthier in comparison to the one situated on the left.
The evidence for the above claim can be provided from the fact that monthly frequency of more
than 800 out of 1000 flights is lower than 50. However, there are certain flights that tend to have
very high frequency which tends to result in the tail towards the right being longer (Medhi, 2016).
This mismatch in the frequency is not a surprising aspect taking into consideration that passenger
demand for different sector tends to differ and number of airlines operating on a sector would be
determined by the passenger demand.
b) The objective in this case is to derive a conclusion about the population of interest i.e.
international flights coming into or going out of Australia. The technique of choice would be
derived from inferential statistics and not descriptive statistics as the former tends to derive
conclusions about population while the latter is concerned with summarising the sample data
provided. Hypothesis testing is the appropriate technique that is to be used for testing the
requisite claim.
The first step in this process is to define the two hypotheses i.e. null and alternate.
Null Hypothesis (H0): μ ≥ 30 i.e. the monthly average with regards to international flights entering
and leaving Australia tend to be 30 at the minimum.
Alternate Hypothesis (H1): μ<30 i.e. the monthly average with regards to international flights
entering and leaving Australia tend to be lesser than 30.
The precision of the results obtained from the hypothesis test is dependent on the underlying
significance level which for the test at hand has been defined as 5% or 0.05.
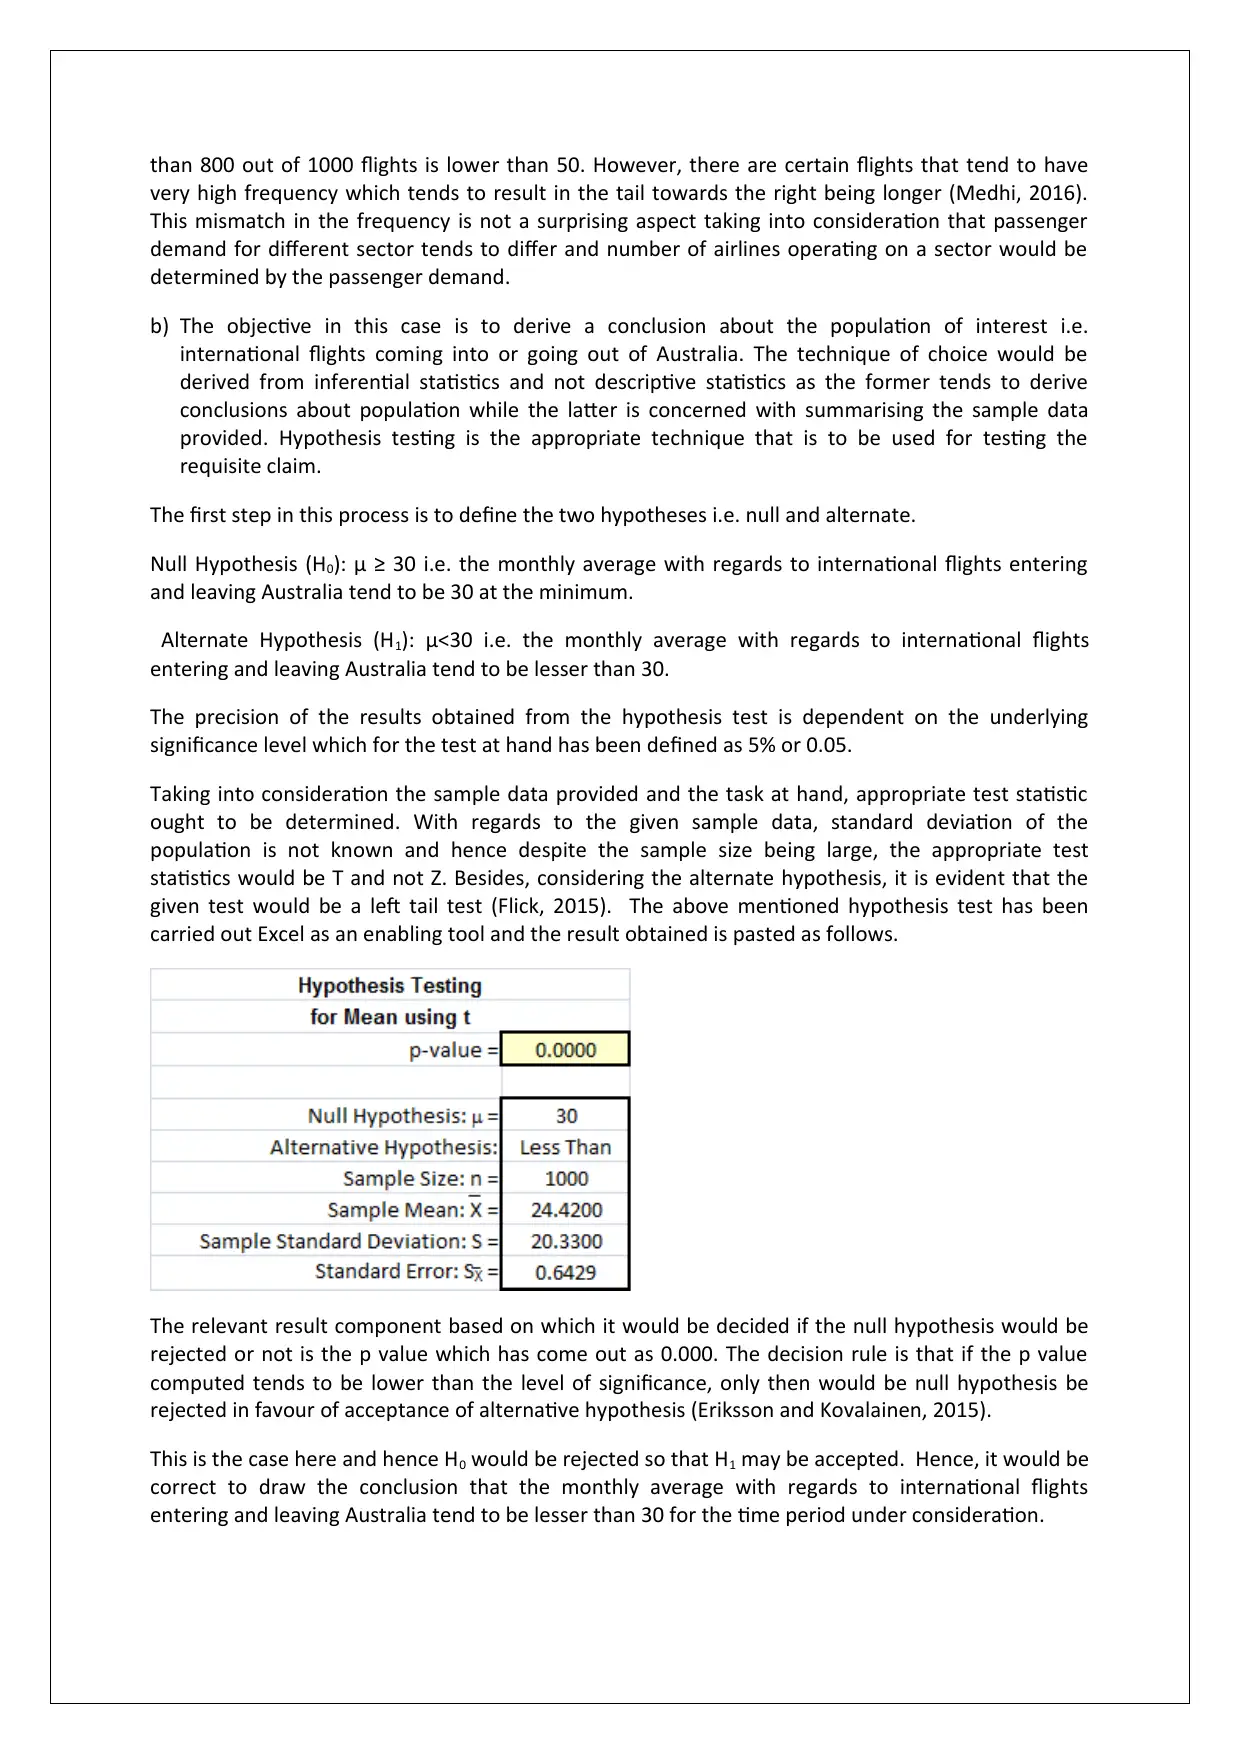
Taking into consideration the sample data provided and the task at hand, appropriate test statistic
ought to be determined. With regards to the given sample data, standard deviation of the
population is not known and hence despite the sample size being large, the appropriate test
statistics would be T and not Z. Besides, considering the alternate hypothesis, it is evident that the
given test would be a left tail test (Flick, 2015). The above mentioned hypothesis test has been
carried out Excel as an enabling tool and the result obtained is pasted as follows.
The relevant result component based on which it would be decided if the null hypothesis would be
rejected or not is the p value which has come out as 0.000. The decision rule is that if the p value
computed tends to be lower than the level of significance, only then would be null hypothesis be
rejected in favour of acceptance of alternative hypothesis (Eriksson and Kovalainen, 2015).
This is the case here and hence H0 would be rejected so that H1 may be accepted. Hence, it would be
correct to draw the conclusion that the monthly average with regards to international flights
entering and leaving Australia tend to be lesser than 30 for the time period under consideration.
very high frequency which tends to result in the tail towards the right being longer (Medhi, 2016).
This mismatch in the frequency is not a surprising aspect taking into consideration that passenger
demand for different sector tends to differ and number of airlines operating on a sector would be
determined by the passenger demand.
b) The objective in this case is to derive a conclusion about the population of interest i.e.
international flights coming into or going out of Australia. The technique of choice would be
derived from inferential statistics and not descriptive statistics as the former tends to derive
conclusions about population while the latter is concerned with summarising the sample data
provided. Hypothesis testing is the appropriate technique that is to be used for testing the
requisite claim.
The first step in this process is to define the two hypotheses i.e. null and alternate.
Null Hypothesis (H0): μ ≥ 30 i.e. the monthly average with regards to international flights entering
and leaving Australia tend to be 30 at the minimum.
Alternate Hypothesis (H1): μ<30 i.e. the monthly average with regards to international flights
entering and leaving Australia tend to be lesser than 30.
The precision of the results obtained from the hypothesis test is dependent on the underlying
significance level which for the test at hand has been defined as 5% or 0.05.
Taking into consideration the sample data provided and the task at hand, appropriate test statistic
ought to be determined. With regards to the given sample data, standard deviation of the
population is not known and hence despite the sample size being large, the appropriate test
statistics would be T and not Z. Besides, considering the alternate hypothesis, it is evident that the
given test would be a left tail test (Flick, 2015). The above mentioned hypothesis test has been
carried out Excel as an enabling tool and the result obtained is pasted as follows.
The relevant result component based on which it would be decided if the null hypothesis would be
rejected or not is the p value which has come out as 0.000. The decision rule is that if the p value
computed tends to be lower than the level of significance, only then would be null hypothesis be
rejected in favour of acceptance of alternative hypothesis (Eriksson and Kovalainen, 2015).
This is the case here and hence H0 would be rejected so that H1 may be accepted. Hence, it would be
correct to draw the conclusion that the monthly average with regards to international flights
entering and leaving Australia tend to be lesser than 30 for the time period under consideration.
Secure Best Marks with AI Grader
Need help grading? Try our AI Grader for instant feedback on your assignments.
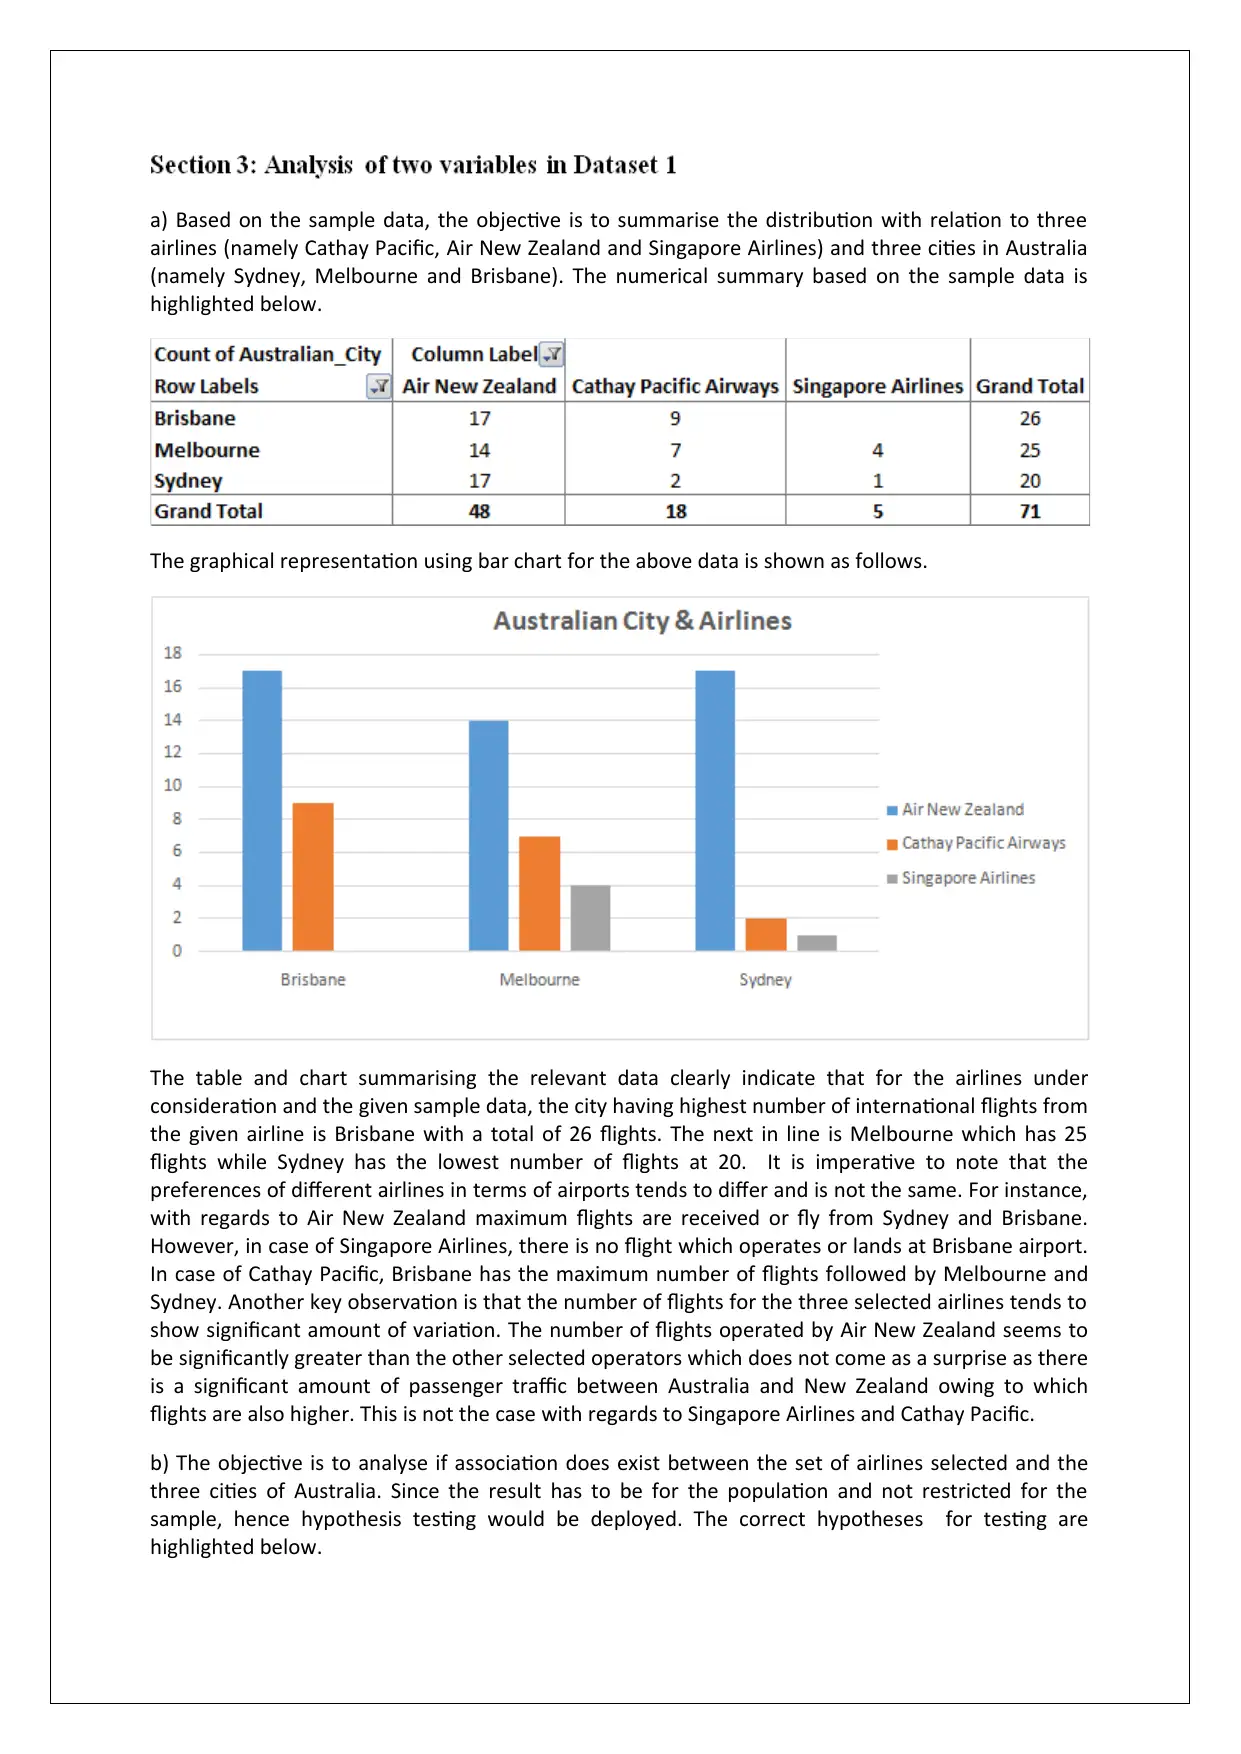
a) Based on the sample data, the objective is to summarise the distribution with relation to three
airlines (namely Cathay Pacific, Air New Zealand and Singapore Airlines) and three cities in Australia
(namely Sydney, Melbourne and Brisbane). The numerical summary based on the sample data is
highlighted below.
The graphical representation using bar chart for the above data is shown as follows.
The table and chart summarising the relevant data clearly indicate that for the airlines under
consideration and the given sample data, the city having highest number of international flights from
the given airline is Brisbane with a total of 26 flights. The next in line is Melbourne which has 25
flights while Sydney has the lowest number of flights at 20. It is imperative to note that the
preferences of different airlines in terms of airports tends to differ and is not the same. For instance,
with regards to Air New Zealand maximum flights are received or fly from Sydney and Brisbane.
However, in case of Singapore Airlines, there is no flight which operates or lands at Brisbane airport.
In case of Cathay Pacific, Brisbane has the maximum number of flights followed by Melbourne and
Sydney. Another key observation is that the number of flights for the three selected airlines tends to
show significant amount of variation. The number of flights operated by Air New Zealand seems to
be significantly greater than the other selected operators which does not come as a surprise as there
is a significant amount of passenger traffic between Australia and New Zealand owing to which
flights are also higher. This is not the case with regards to Singapore Airlines and Cathay Pacific.
b) The objective is to analyse if association does exist between the set of airlines selected and the
three cities of Australia. Since the result has to be for the population and not restricted for the
sample, hence hypothesis testing would be deployed. The correct hypotheses for testing are
highlighted below.
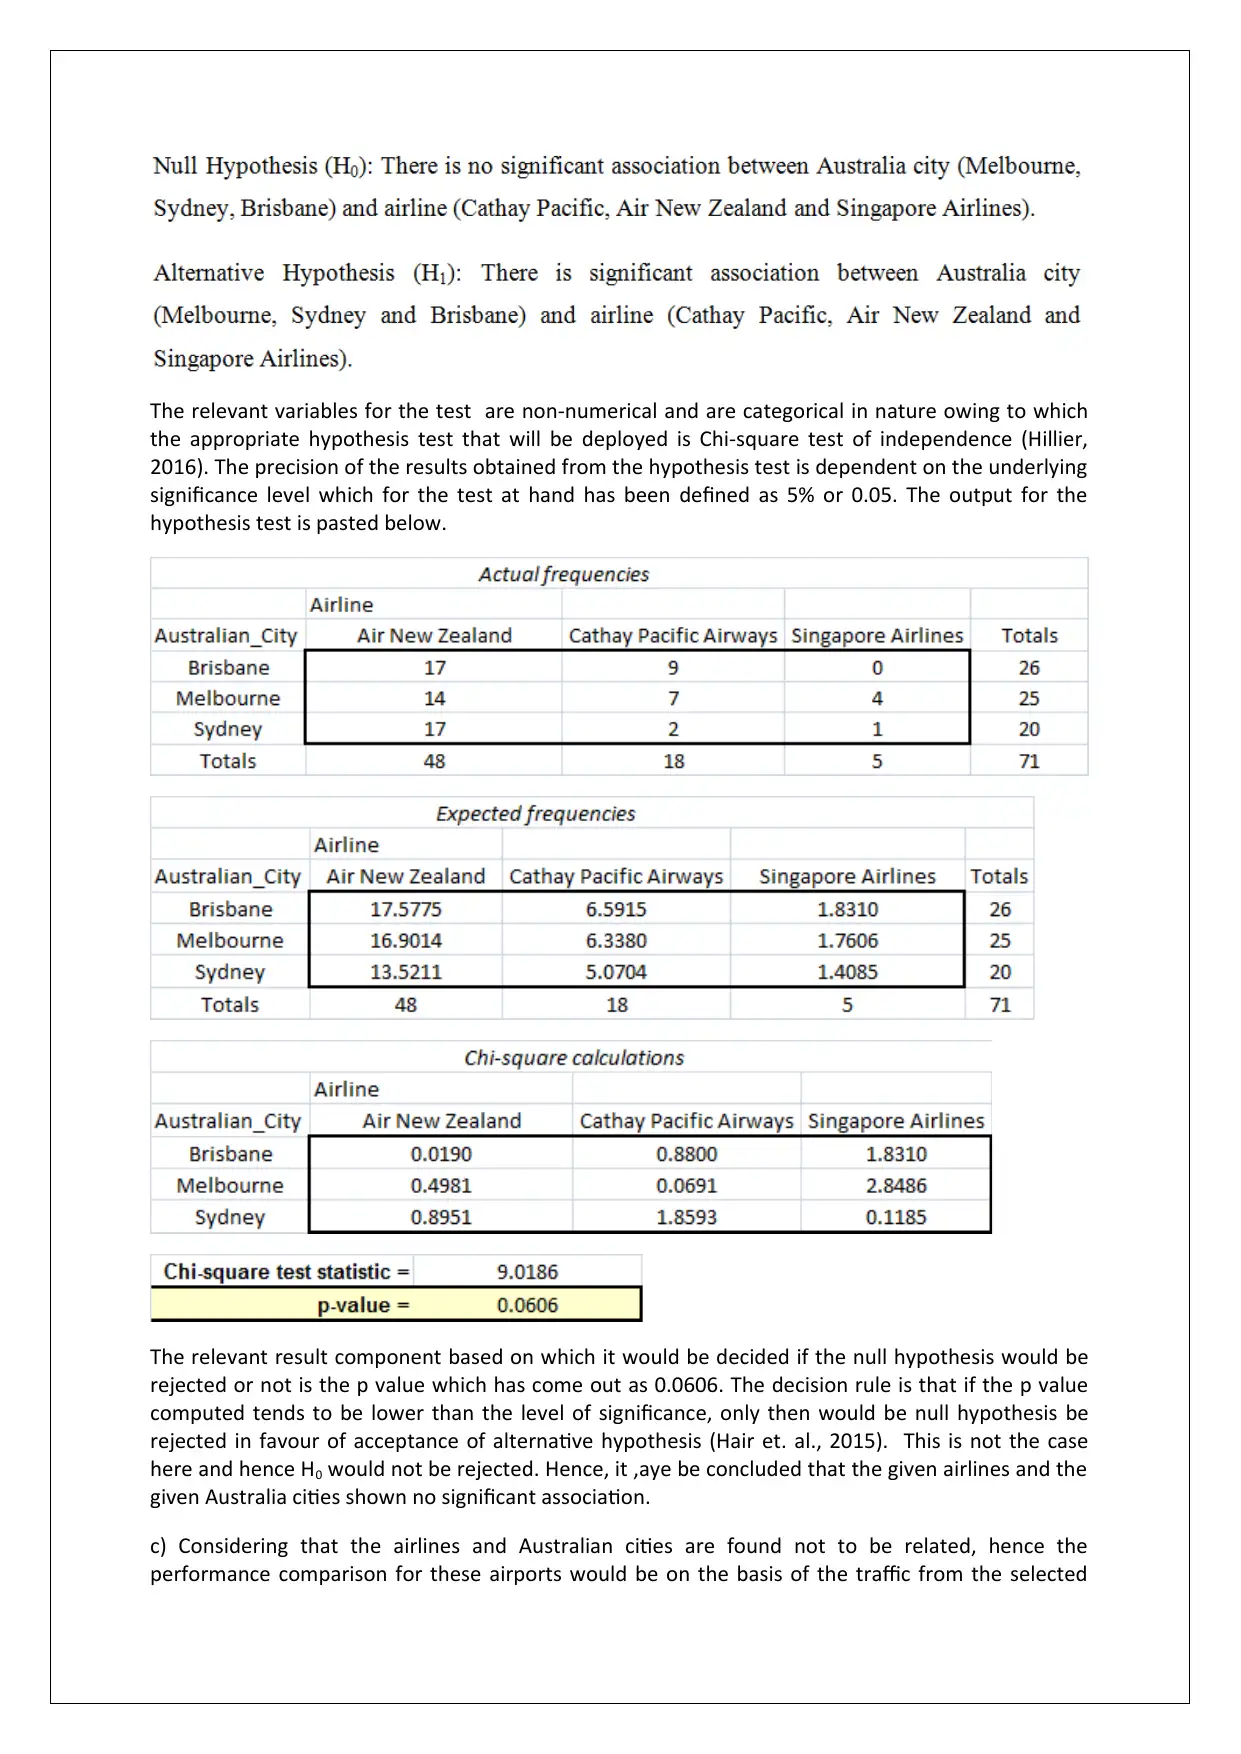
The relevant variables for the test are non-numerical and are categorical in nature owing to which
the appropriate hypothesis test that will be deployed is Chi-square test of independence (Hillier,
2016). The precision of the results obtained from the hypothesis test is dependent on the underlying
significance level which for the test at hand has been defined as 5% or 0.05. The output for the
hypothesis test is pasted below.
The relevant result component based on which it would be decided if the null hypothesis would be
rejected or not is the p value which has come out as 0.0606. The decision rule is that if the p value
computed tends to be lower than the level of significance, only then would be null hypothesis be
rejected in favour of acceptance of alternative hypothesis (Hair et. al., 2015). This is not the case
here and hence H0 would not be rejected. Hence, it ,aye be concluded that the given airlines and the
given Australia cities shown no significant association.
c) Considering that the airlines and Australian cities are found not to be related, hence the
performance comparison for these airports would be on the basis of the traffic from the selected
airlines. In this regards, it would be correct to indicate that maximum traffic from the selected
airlines is received by Brisbane airport (26) which is closely followed by Melbourne (25) while
Sydney (20) is at the last position
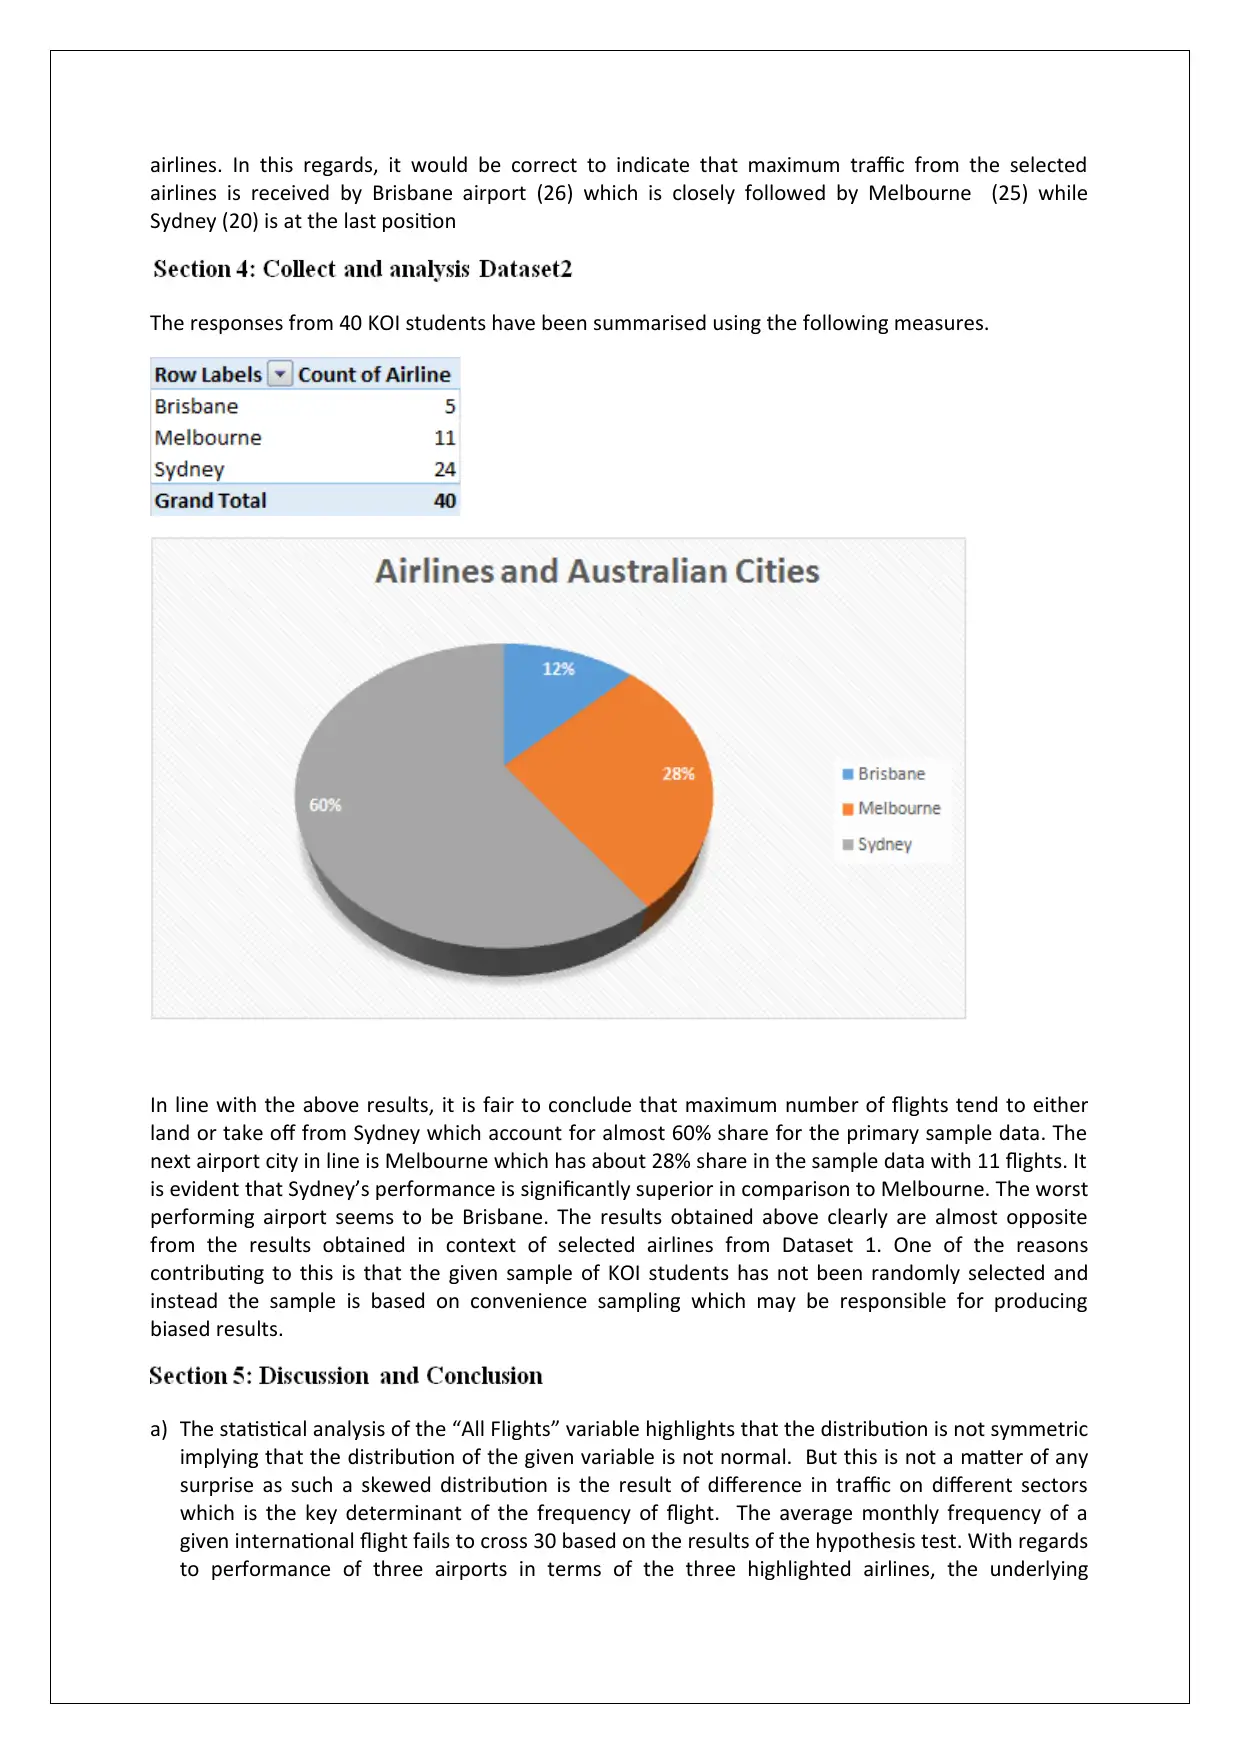
The responses from 40 KOI students have been summarised using the following measures.
In line with the above results, it is fair to conclude that maximum number of flights tend to either
land or take off from Sydney which account for almost 60% share for the primary sample data. The
next airport city in line is Melbourne which has about 28% share in the sample data with 11 flights. It
is evident that Sydney’s performance is significantly superior in comparison to Melbourne. The worst
performing airport seems to be Brisbane. The results obtained above clearly are almost opposite
from the results obtained in context of selected airlines from Dataset 1. One of the reasons
contributing to this is that the given sample of KOI students has not been randomly selected and
instead the sample is based on convenience sampling which may be responsible for producing
biased results.
a) The statistical analysis of the “All Flights” variable highlights that the distribution is not symmetric
implying that the distribution of the given variable is not normal. But this is not a matter of any
surprise as such a skewed distribution is the result of difference in traffic on different sectors
which is the key determinant of the frequency of flight. The average monthly frequency of a
given international flight fails to cross 30 based on the results of the hypothesis test. With regards
to performance of three airports in terms of the three highlighted airlines, the underlying
airlines is received by Brisbane airport (26) which is closely followed by Melbourne (25) while
Sydney (20) is at the last position
The responses from 40 KOI students have been summarised using the following measures.
In line with the above results, it is fair to conclude that maximum number of flights tend to either
land or take off from Sydney which account for almost 60% share for the primary sample data. The
next airport city in line is Melbourne which has about 28% share in the sample data with 11 flights. It
is evident that Sydney’s performance is significantly superior in comparison to Melbourne. The worst
performing airport seems to be Brisbane. The results obtained above clearly are almost opposite
from the results obtained in context of selected airlines from Dataset 1. One of the reasons
contributing to this is that the given sample of KOI students has not been randomly selected and
instead the sample is based on convenience sampling which may be responsible for producing
biased results.
a) The statistical analysis of the “All Flights” variable highlights that the distribution is not symmetric
implying that the distribution of the given variable is not normal. But this is not a matter of any
surprise as such a skewed distribution is the result of difference in traffic on different sectors
which is the key determinant of the frequency of flight. The average monthly frequency of a
given international flight fails to cross 30 based on the results of the hypothesis test. With regards
to performance of three airports in terms of the three highlighted airlines, the underlying
Paraphrase This Document
Need a fresh take? Get an instant paraphrase of this document with our AI Paraphraser

association between them was found to be not significant. As a result, the performance of the
three airports has been analysed using sample data which lead to the conclusion that maximum
flights tend to take off or land at Brisbane and the least at Sydney. This is a worrying aspect for
Sydney and it is imperative that the underlying reasons for this trend ought to be analysed in
detail. Dataset 2 reflected a significantly different picture in relation to the three airports
performance as Sydney has more than 50% share but the reliability of the results of this survey is
in contention owing to the use of convenience sampling instead of random sampling.
b) For future research, it is recommended that focus should be on frequent user groups and
understanding why they choose a particular airport over the other. This would enable the Sydney
airport along with others to improve their services so as to draw more traffic. One of the likely
groups that airlines should focus is the foreign students.
References
AnnaAero (2018)
International airlines now carry 25% of Australian traffic; Sunshine Coast is flying in
terms of passenger growth; preparing for non-stop UK, [online] Available at
https://www.anna.aero/2018/02/27/international-airlines-now-carry-25-australian-traffic/[Assessed
January 11, 2019]
Eriksson, P. &Kovalainen, A. (2015).
Quantitative methods in business research (3rd ed.). London:
Sage Publications pp. 69-71
Flick, U. (2015).
Introducing research methodology: A beginner's guide to doing a research project
(4th ed.). New York: Sage Publications pp. 62-63
Hair, J. F., Wolfinbarger, M., Money, A. H., Samouel, P., & Page, M. J. (2015).
Essentials of business
research methods (2nd ed.). New York: Routledge pp. 103-104
Hillier, F. (2016).
Introduction to Operations Research.(6th ed.). New York: McGraw Hill Publications
pp. 106-108
Medhi, J. (2016)
Statistical Methods: An Introductory Text. (4th ed.). Sydney: New Age International
pp. 110-113
1 out of 9
Related Documents


Your All-in-One AI-Powered Toolkit for Academic Success.
+13062052269
info@desklib.com
Available 24*7 on WhatsApp / Email
![[object Object]](/_next/static/media/star-bottom.7253800d.svg)
Unlock your academic potential
© 2024 | Zucol Services PVT LTD | All rights reserved.