Statistics Assignment: Analysis of Stock Returns and CAPM Model
VerifiedAdded on 2023/01/20
|10
|1657
|57
Homework Assignment
AI Summary
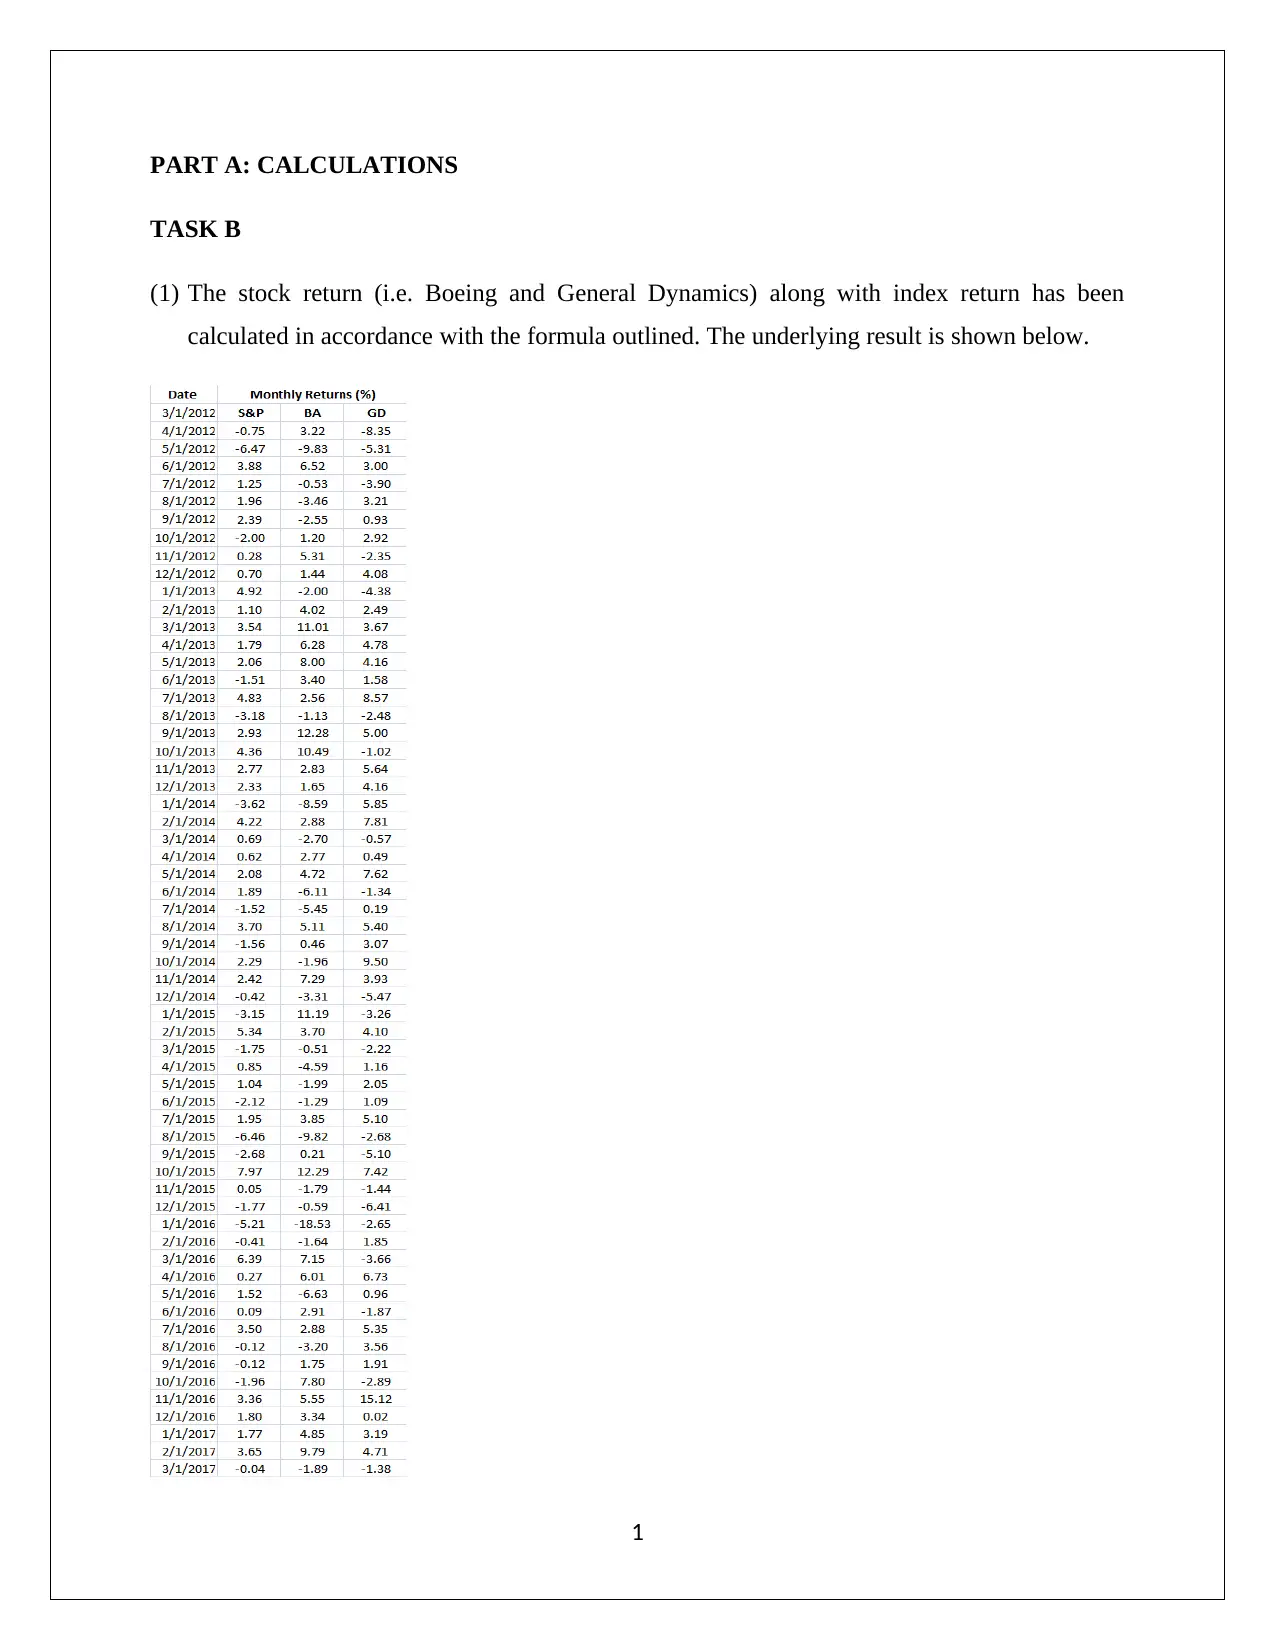
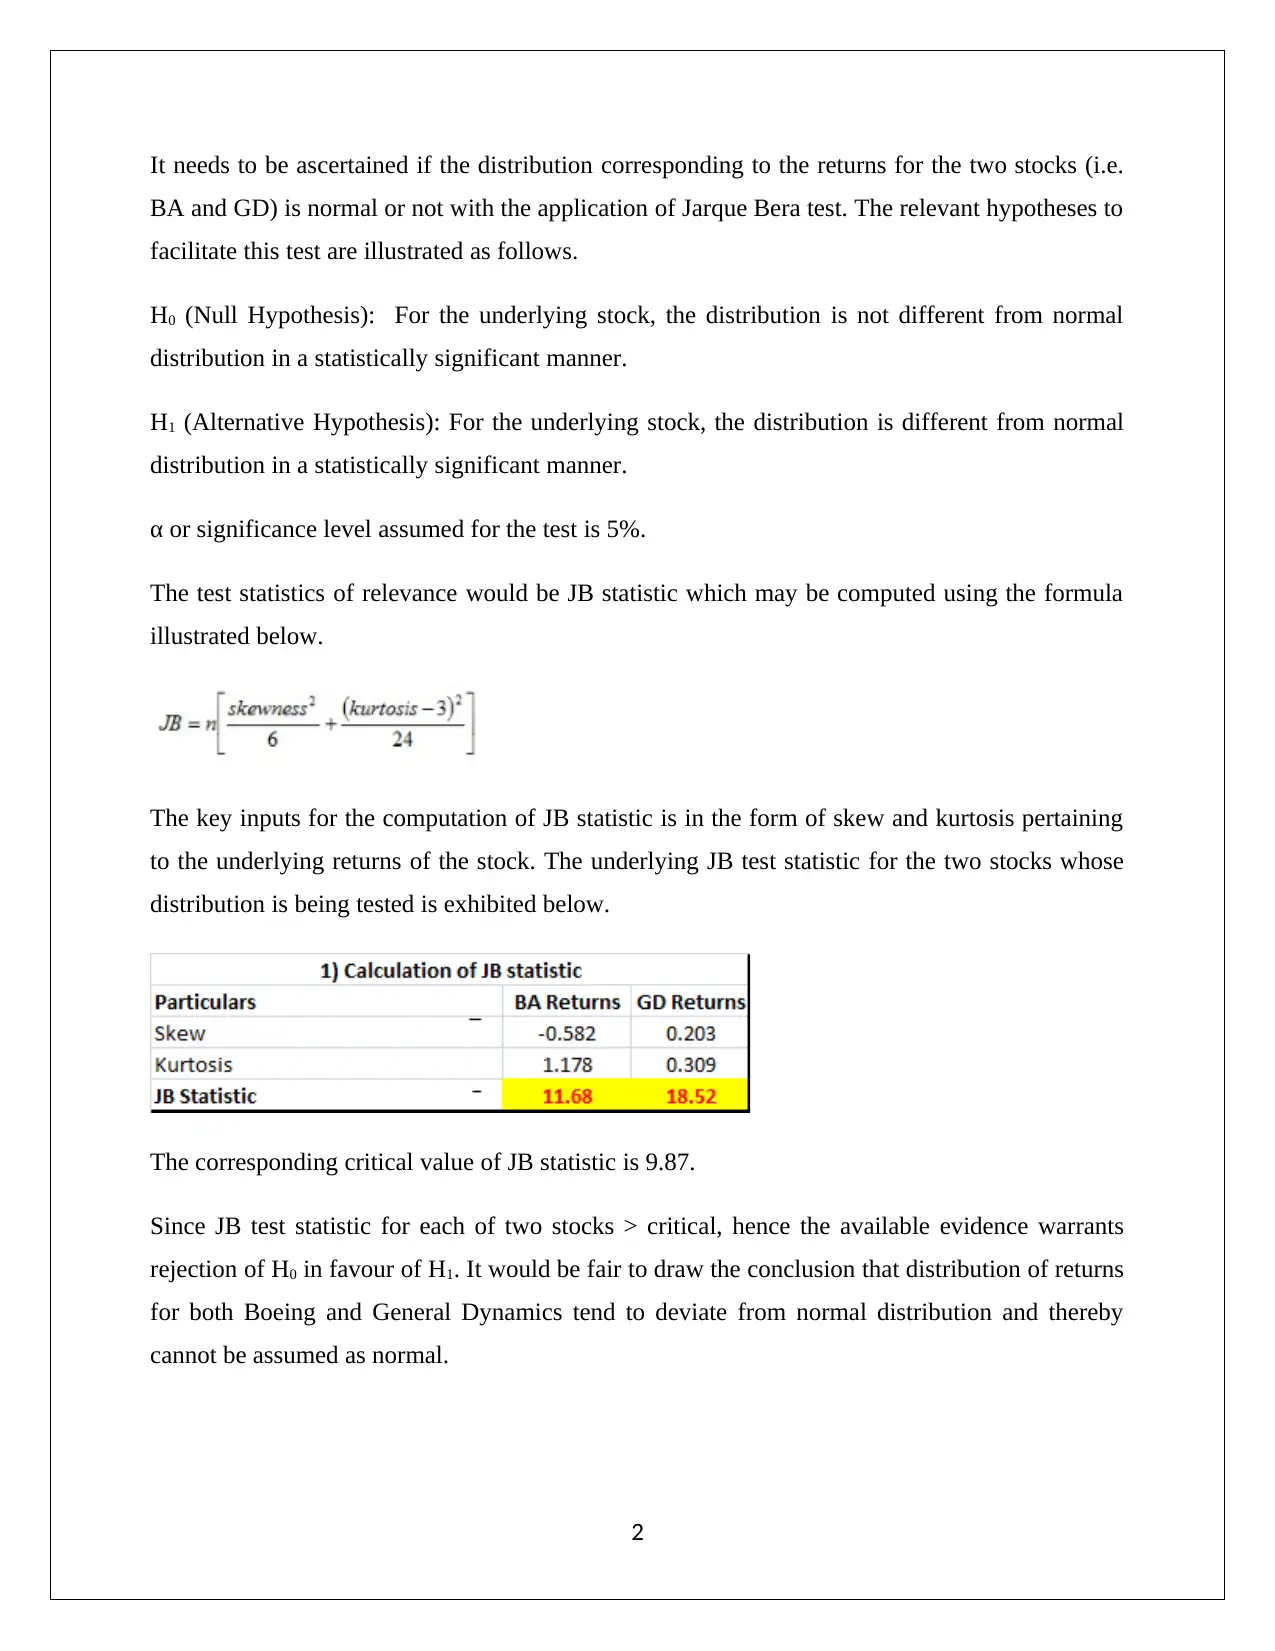
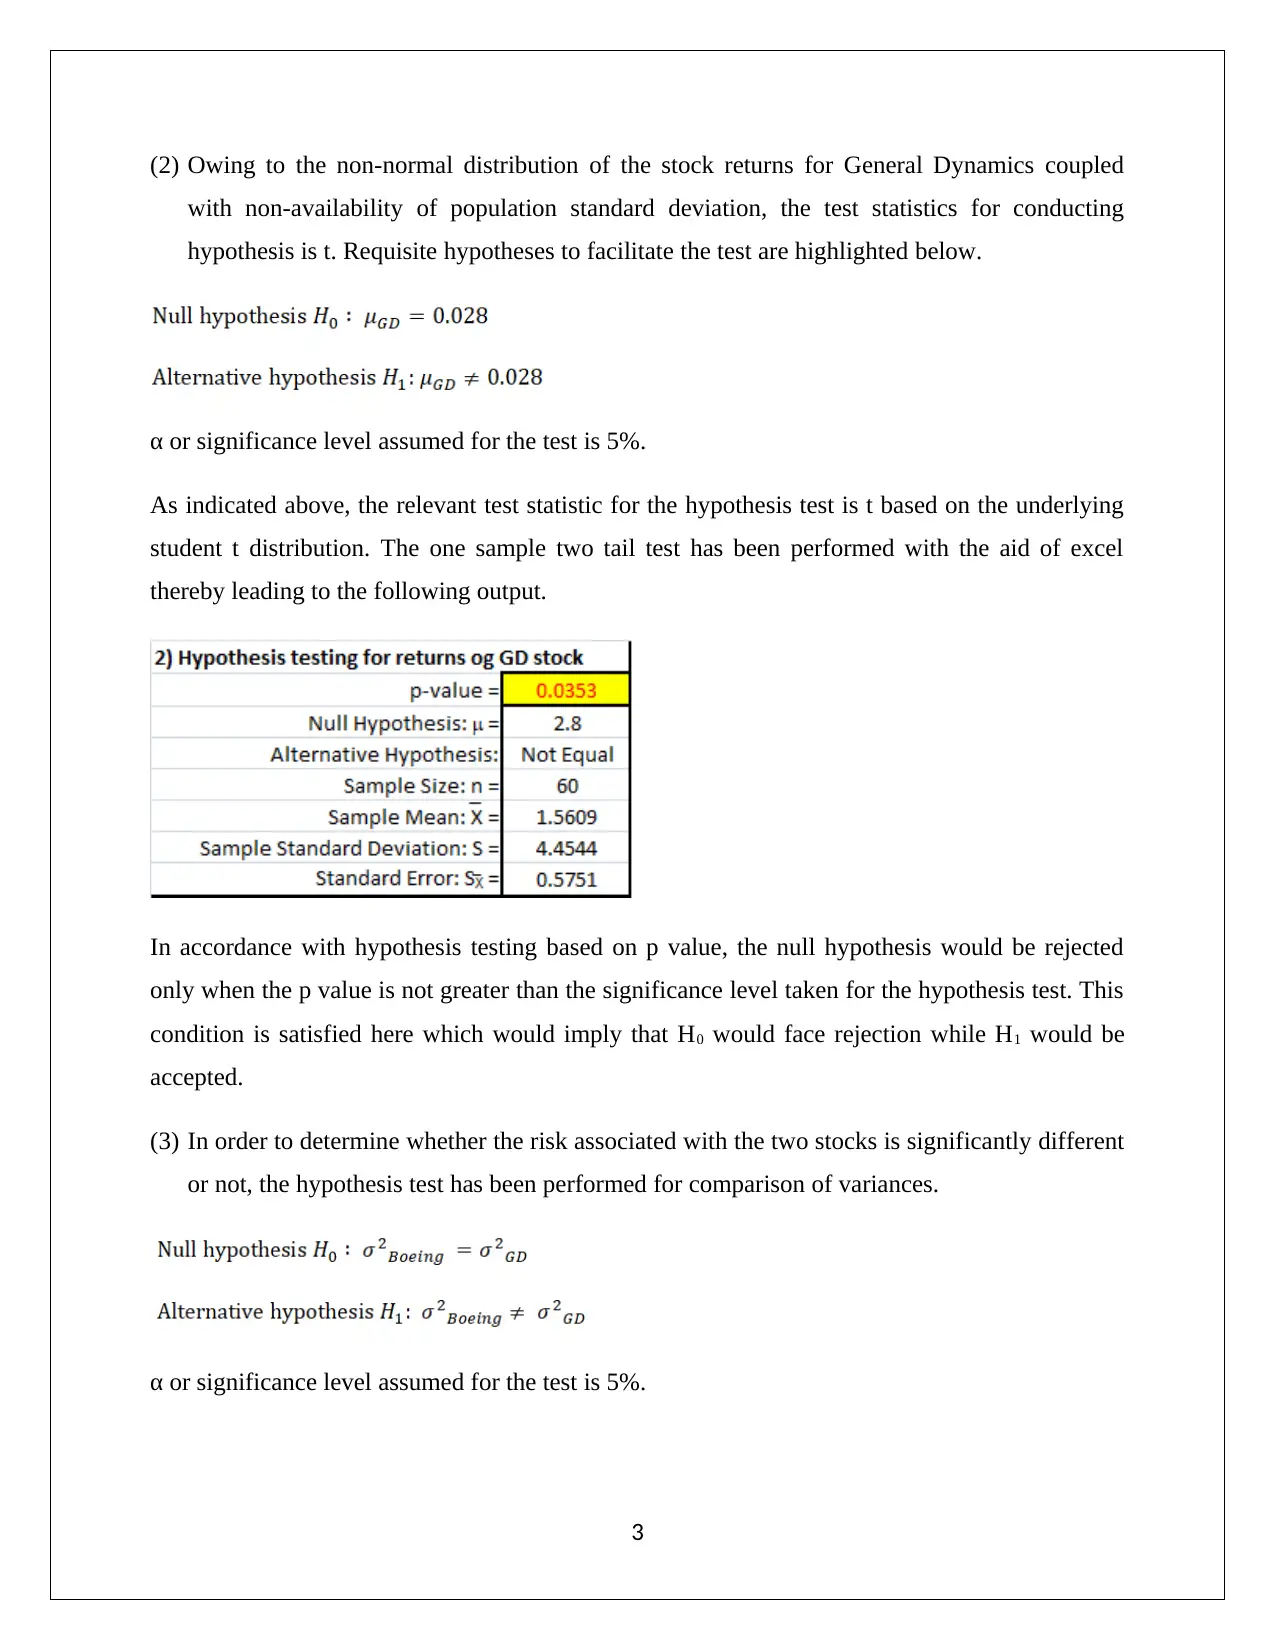
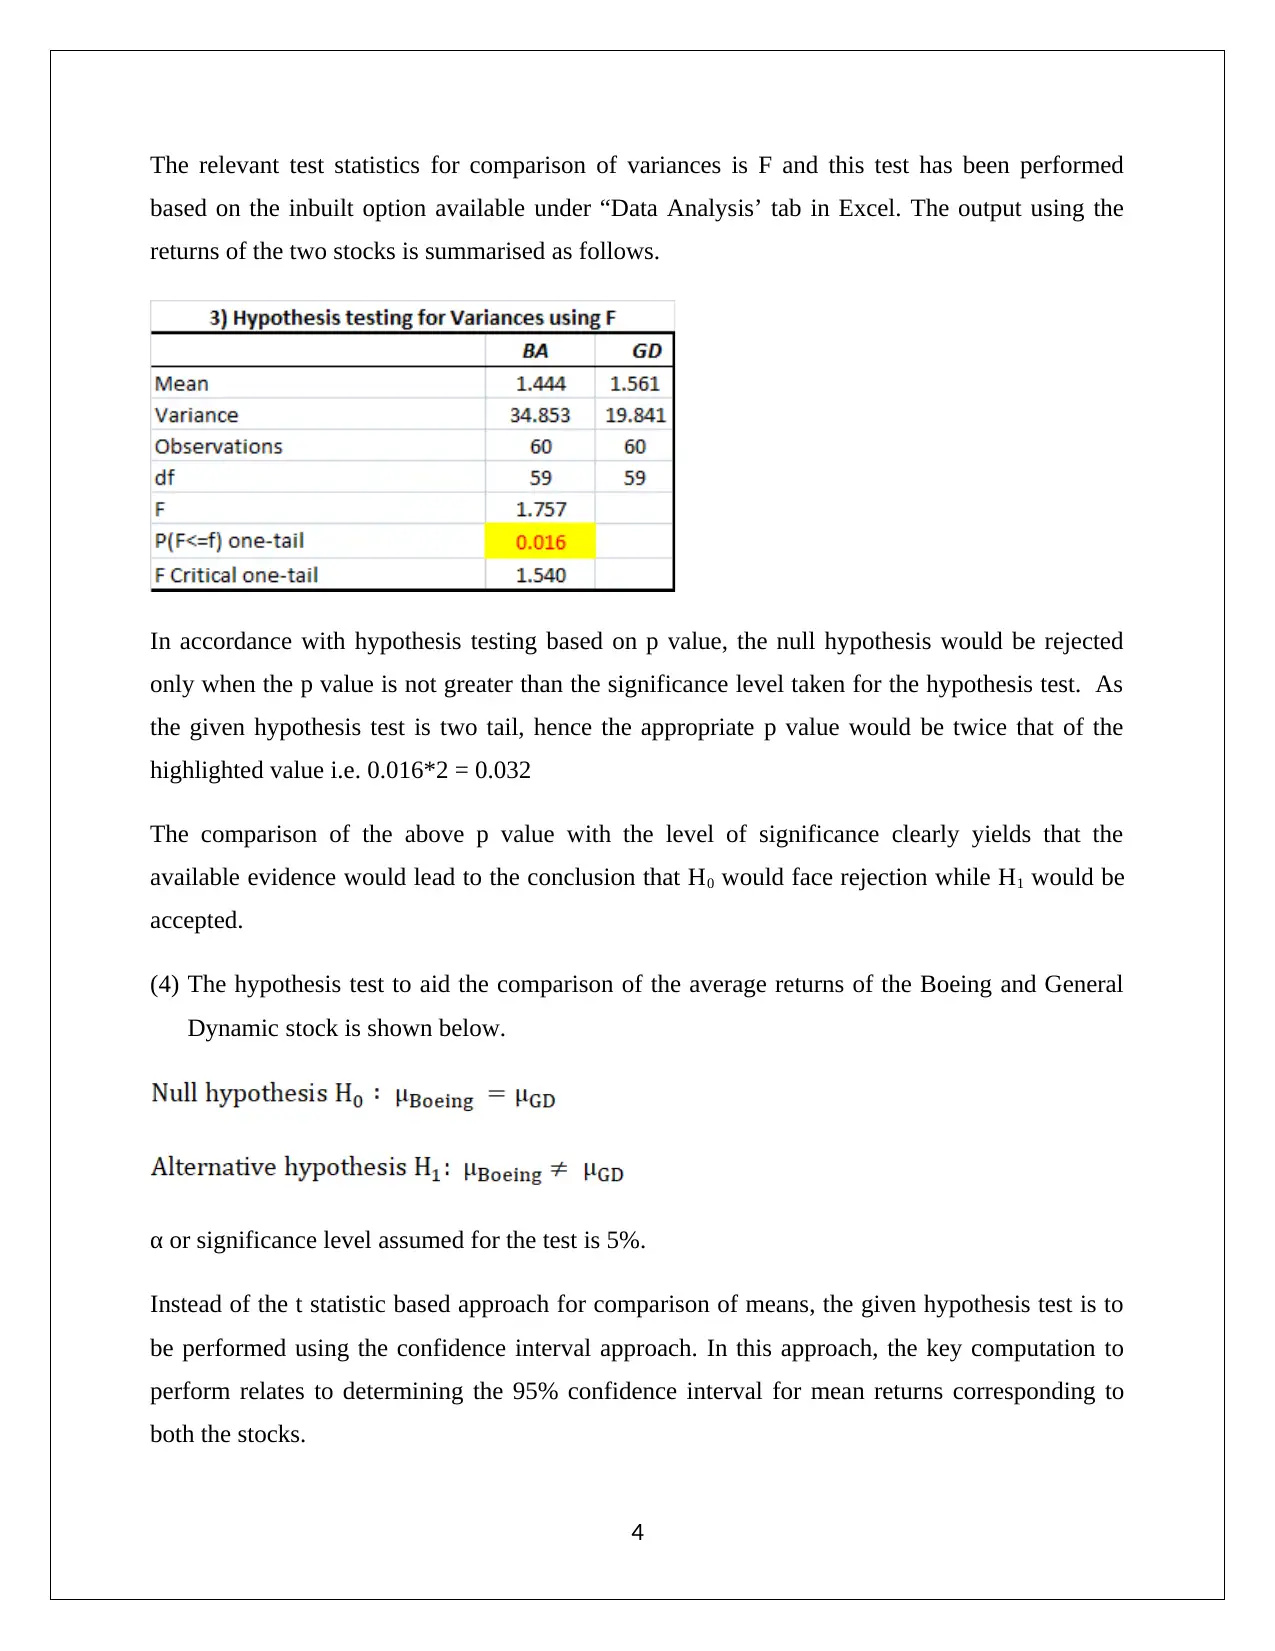
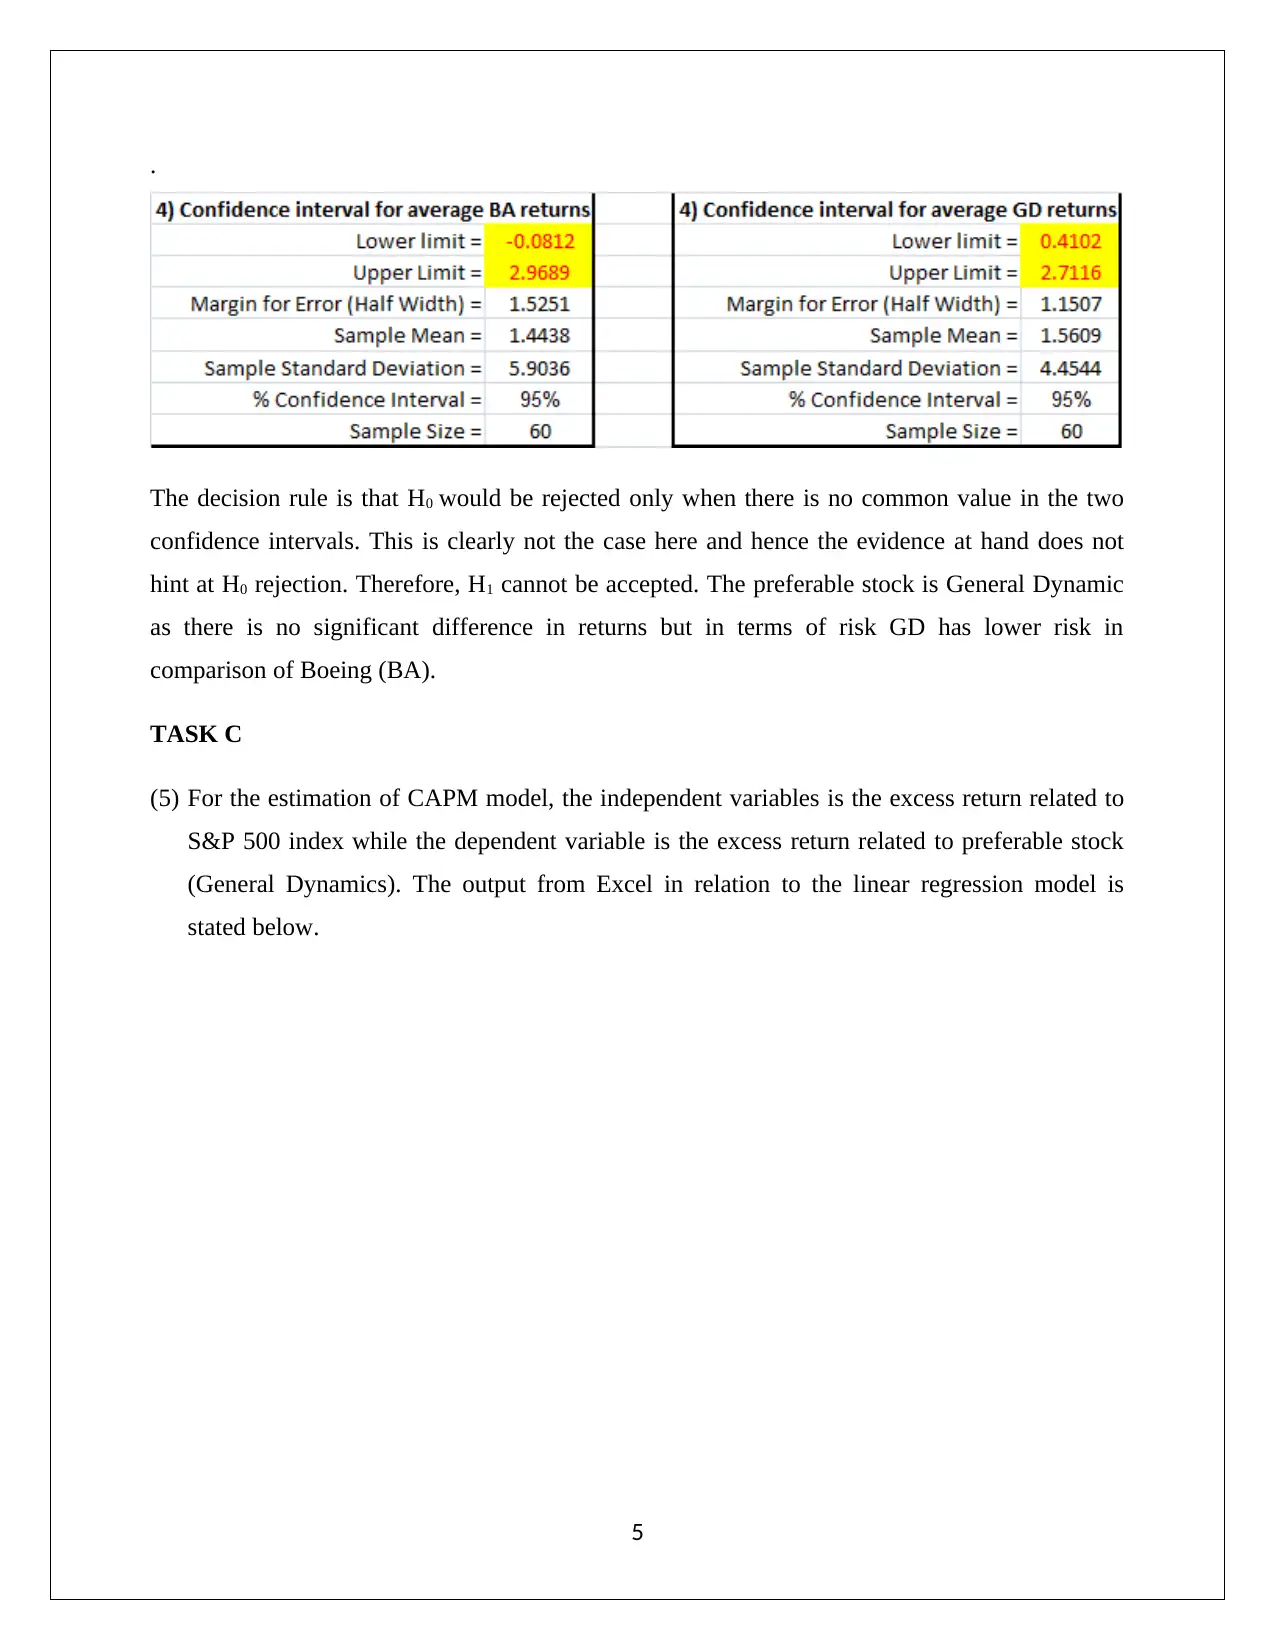
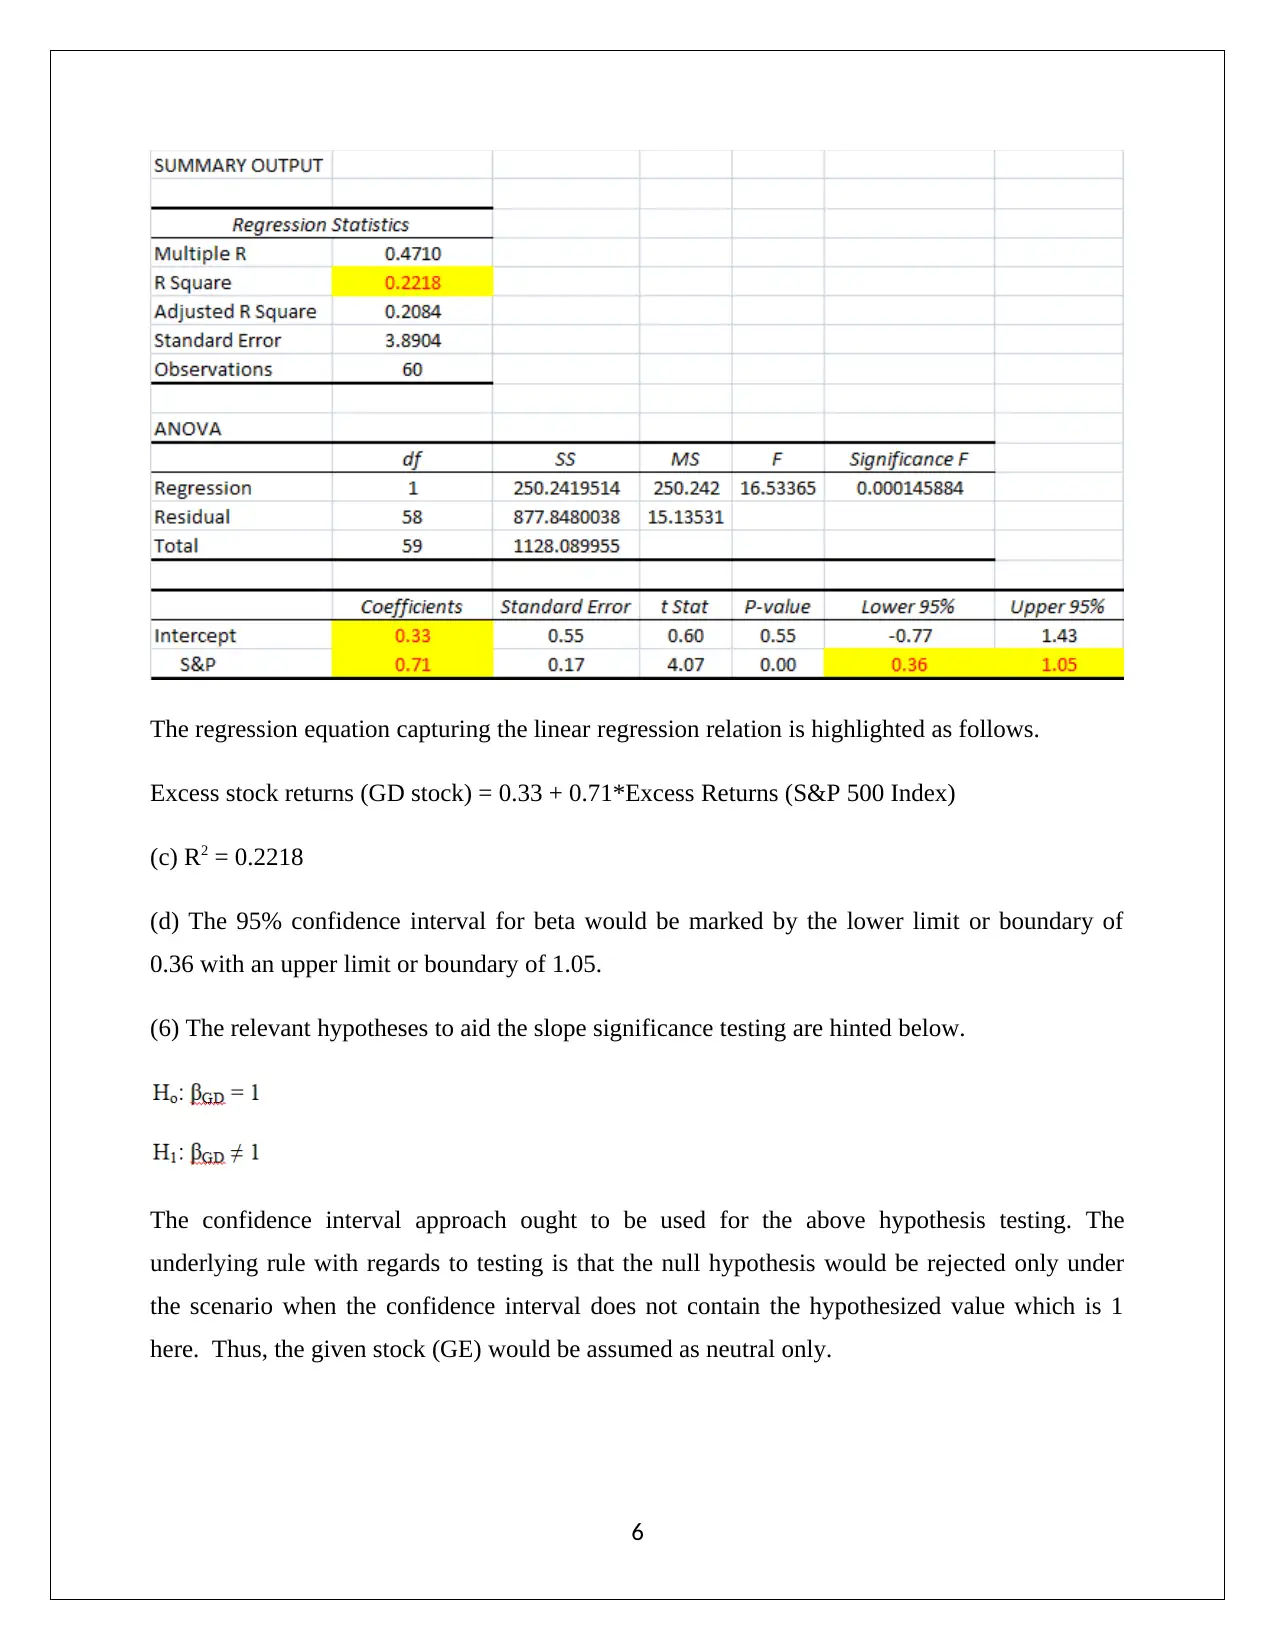
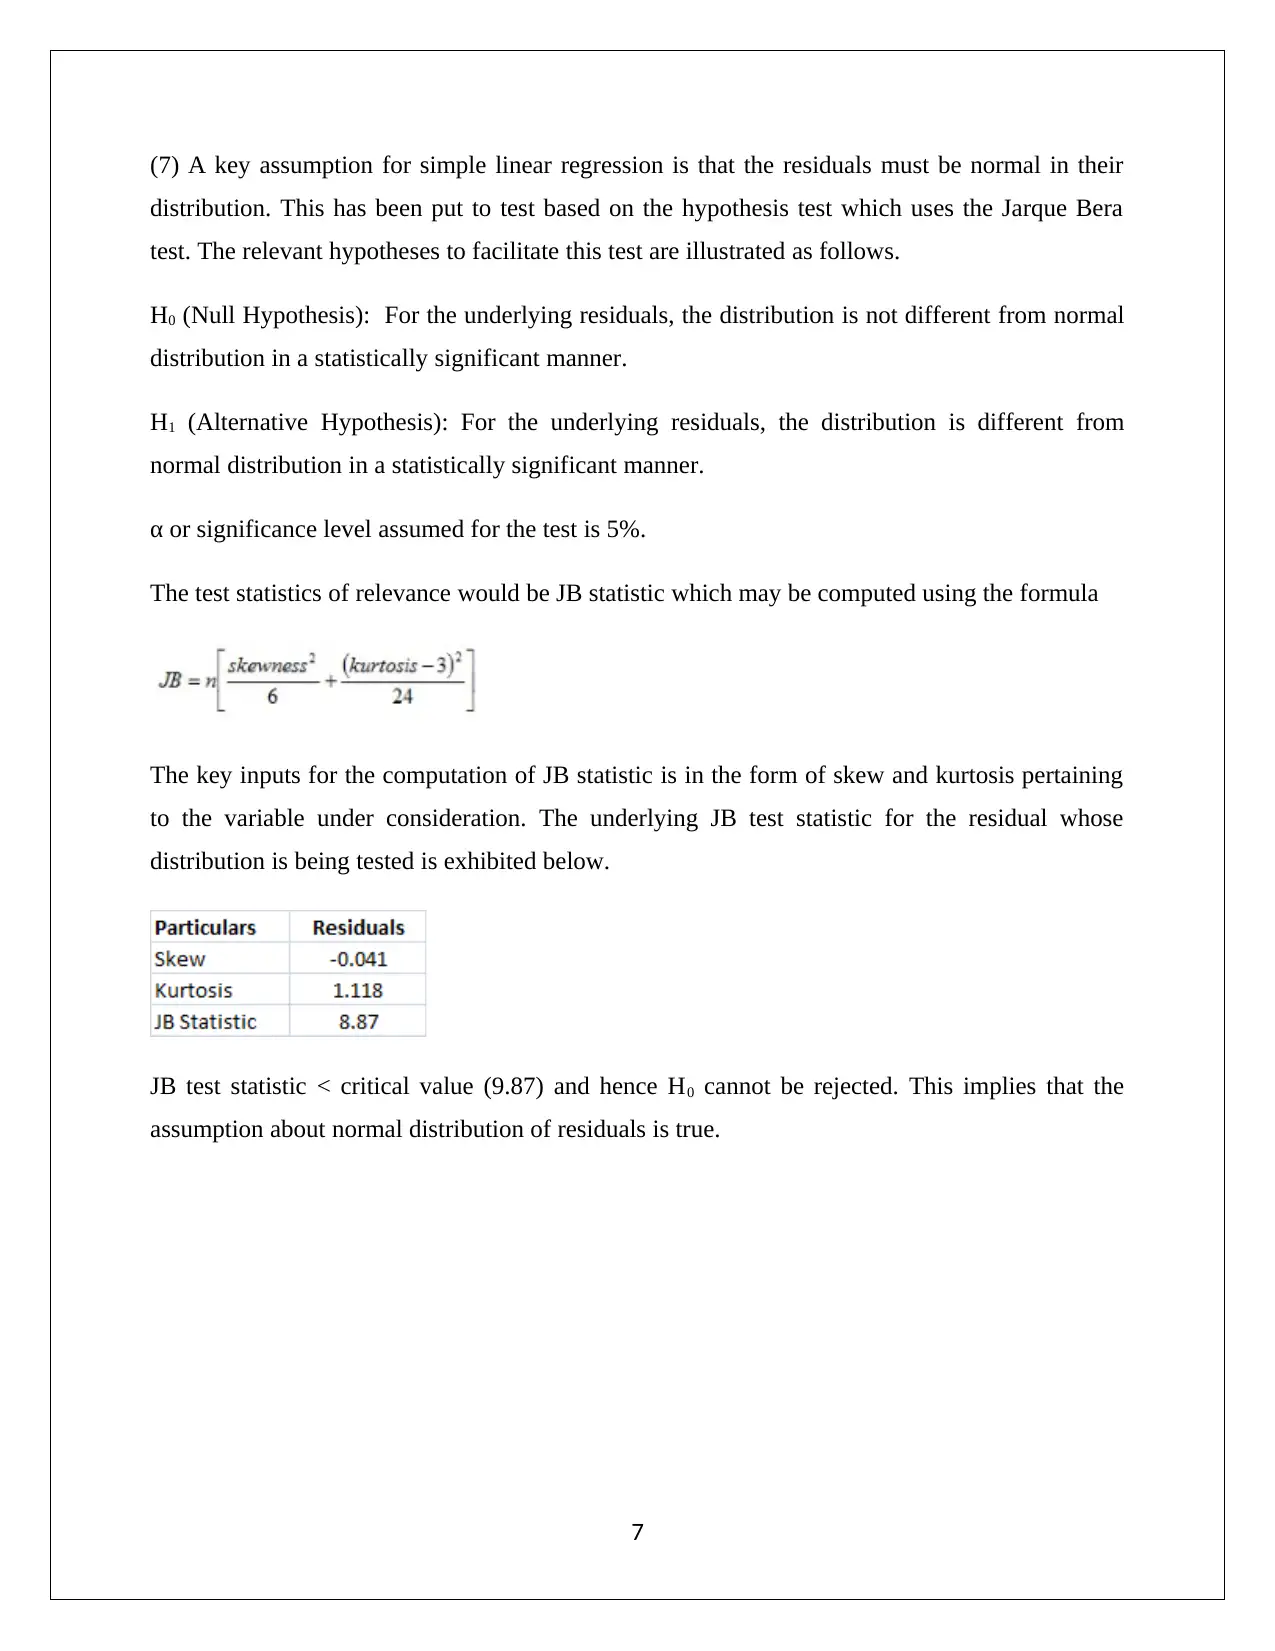
This assignment analyzes stock returns for Boeing (BA) and General Dynamics (GD) using statistical methods. It begins with calculating stock returns and performing the Jarque-Bera test to determine if the distributions are normal. Hypothesis tests are conducted to compare variances, average returns, and assess the significance of beta in a CAPM model. The analysis includes t-tests, confidence intervals, and F-tests. The results indicate non-normal distributions for both stocks, with GD showing lower risk. The CAPM model is applied, and the regression output is interpreted, including the beta value and R-squared. The assignment concludes with a discussion on the model's validity, hypothesis testing, and the identification of GD as a preferable stock due to lower risk. The residuals of the CAPM model are tested for normality using the Jarque-Bera test.

1 out of 10
Related Documents


![Statistical Analysis of Business and Finance Data - [Semester]](/_next/image/?url=https%3A%2F%2Fdesklib.com%2Fmedia%2Fbusiness-finance-statistics-hypothesis-interpretation_page_2.jpg&w=256&q=75)

Your All-in-One AI-Powered Toolkit for Academic Success.
+13062052269
info@desklib.com
Available 24*7 on WhatsApp / Email
![[object Object]](/_next/static/media/star-bottom.7253800d.svg)
Copyright © 2020–2026 A2Z Services. All Rights Reserved. Developed and managed by ZUCOL.