Statistics Coursework: T-Test Analysis of Gender Score Differences
VerifiedAdded on 2023/06/09
|6
|687
|236
Homework Assignment
AI Summary
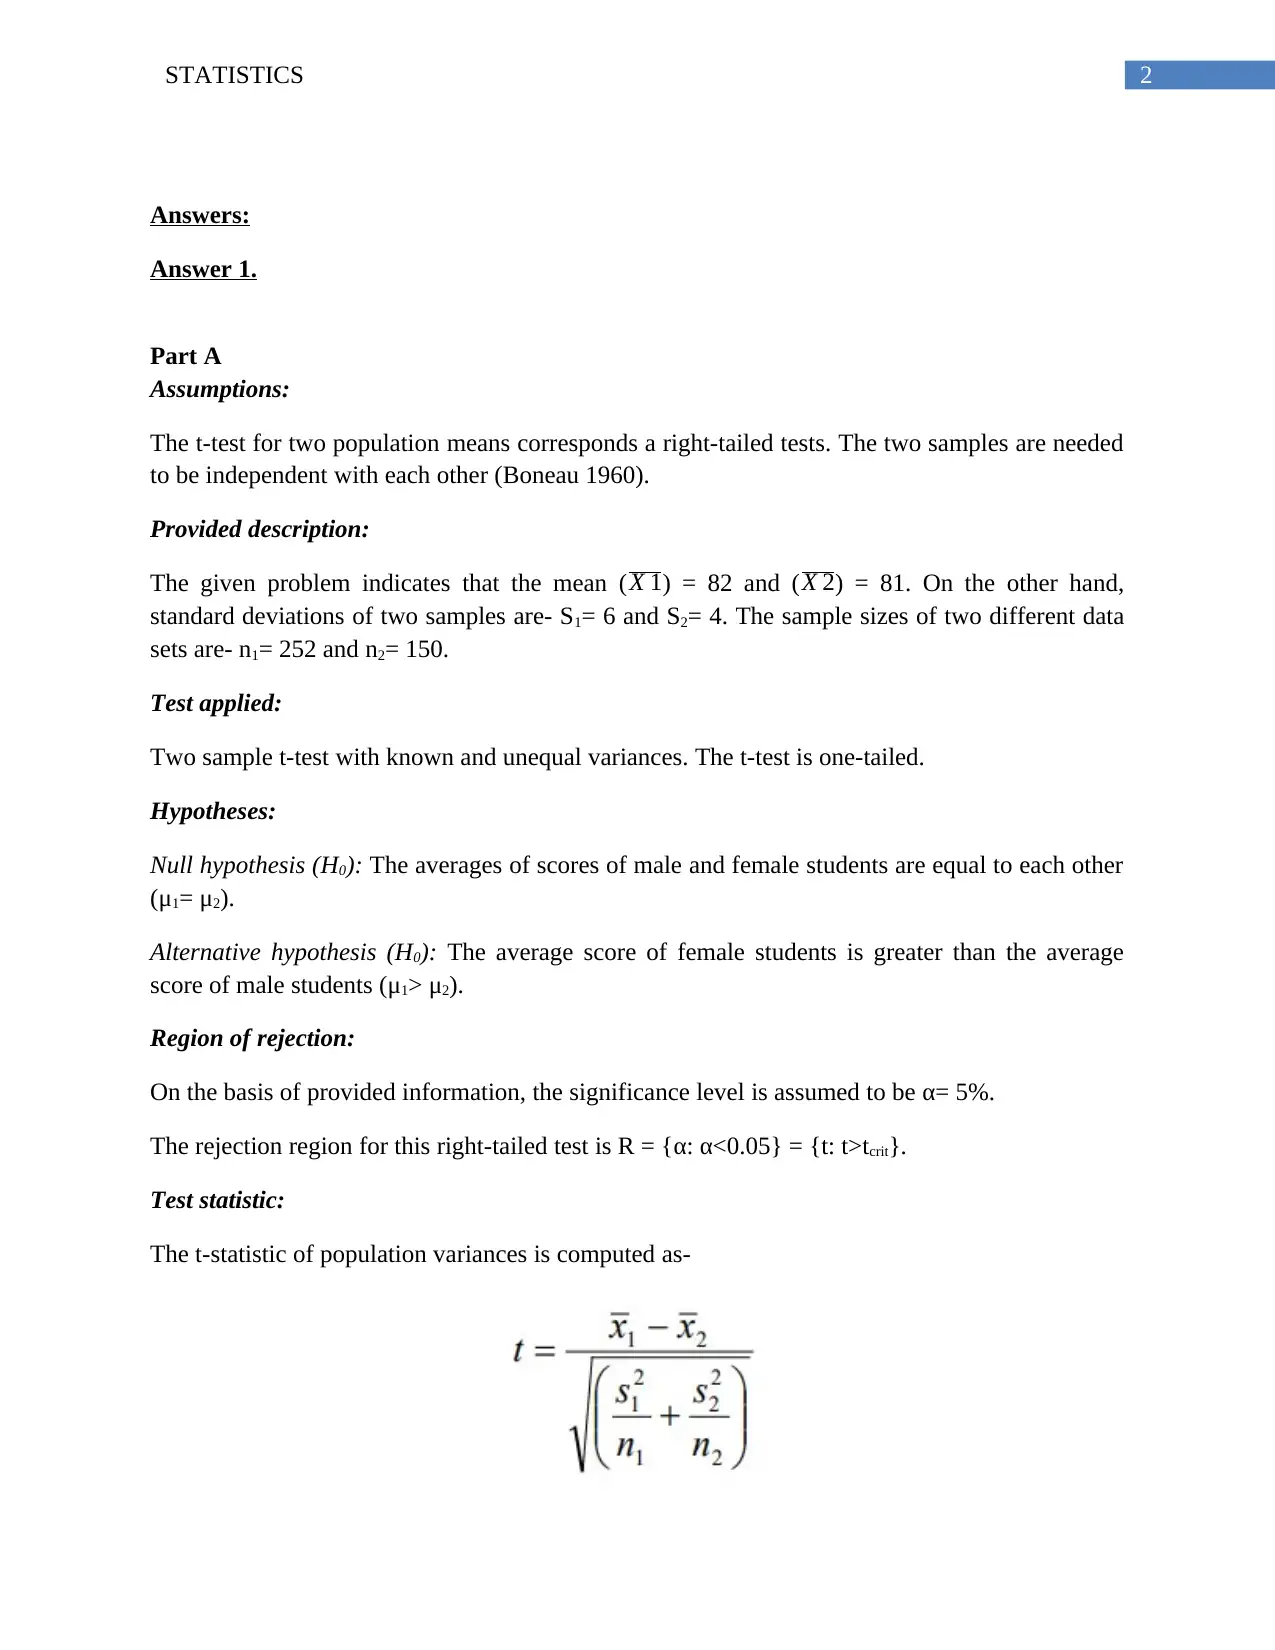
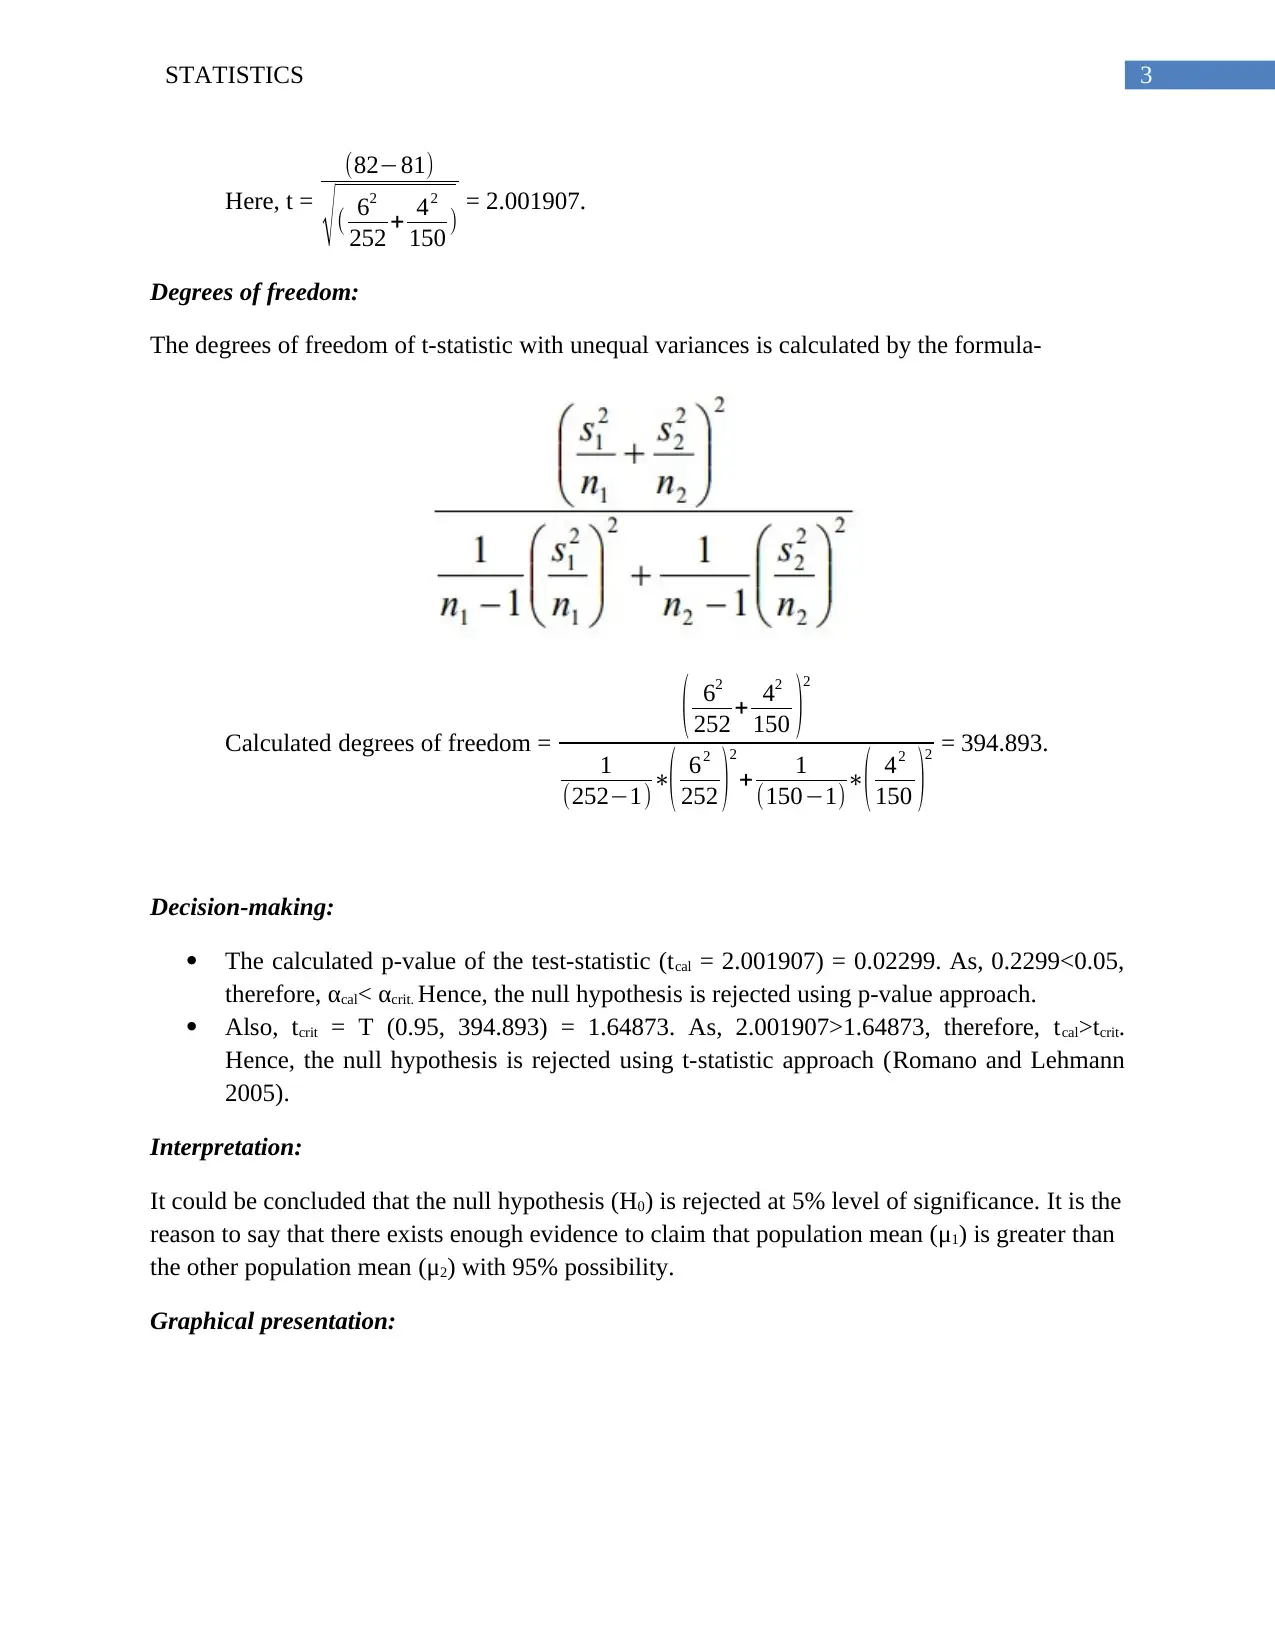
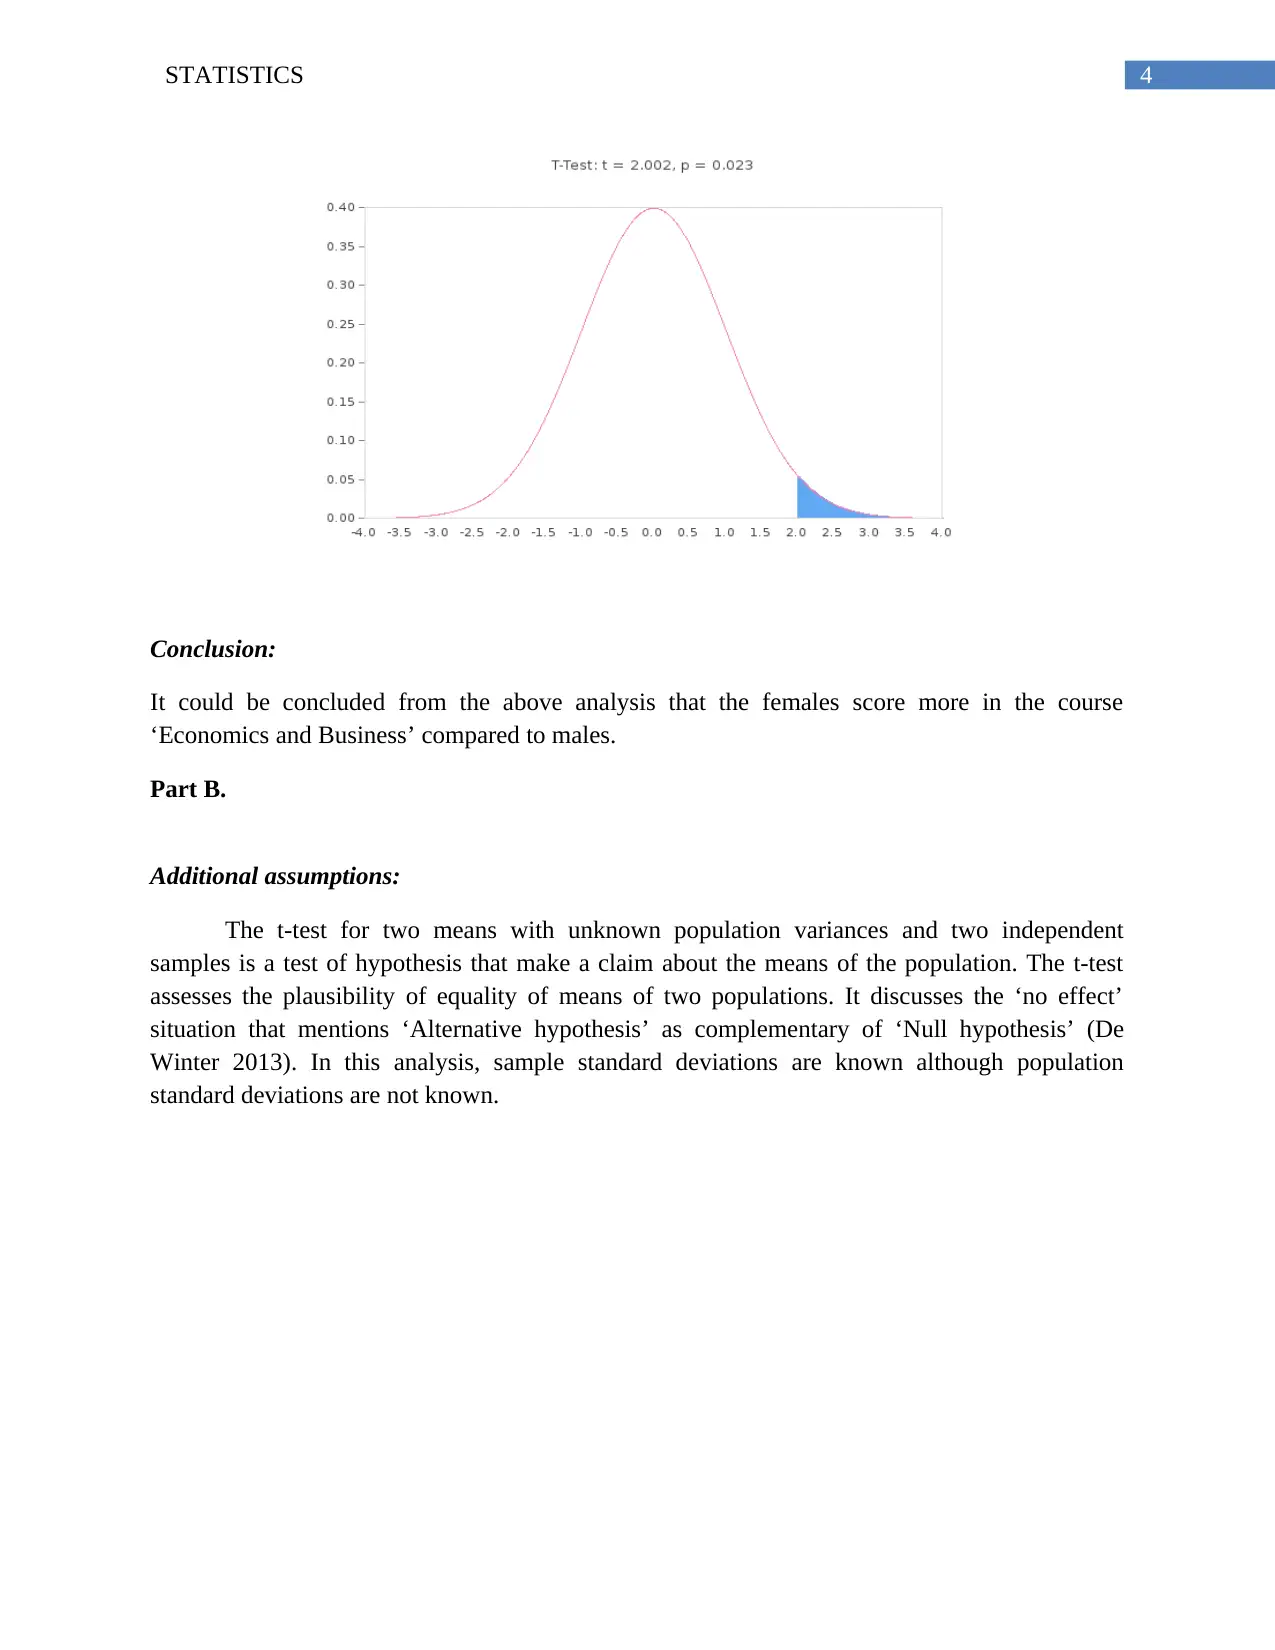
This statistics assignment demonstrates a two-sample t-test with unequal variances to compare the average scores of male and female students. The analysis begins by stating the assumptions of the t-test and defining the null and alternative hypotheses. Given sample means, standard deviations, and sample sizes, the t-statistic is calculated, and the degrees of freedom are determined. The decision to reject the null hypothesis is made using both the p-value and t-statistic approaches, leading to the conclusion that female students tend to score higher in 'Economics and Business' than male students. The assignment also considers additional assumptions and provides a graphical presentation of the results. Desklib offers a wealth of similar solved assignments and past papers for students seeking to enhance their understanding of statistical analysis.
1 out of 6
Related Documents


Your All-in-One AI-Powered Toolkit for Academic Success.
+13062052269
info@desklib.com
Available 24*7 on WhatsApp / Email
![[object Object]](/_next/static/media/star-bottom.7253800d.svg)
Copyright © 2020–2026 A2Z Services. All Rights Reserved. Developed and managed by ZUCOL.