Strategic Management Report on Netflix
Added on 2023-06-01
52 Pages6291 Words100 Views
Running head: STRATEGIC MANAGEMENT REPORT ON NETFIX
Strategic Management Report on Netflix
Name of the Student:
Name of the University:
Author Note:
Strategic Management Report on Netflix
Name of the Student:
Name of the University:
Author Note:
STRATEGIC MANAGEMENT REPORT ON NETFLIX 1
Table of Contents
Introduction......................................................................................................................................1
Current Issues..............................................................................................................................1
Geographical location and SBU’s...............................................................................................1
Future Challenges........................................................................................................................1
Income........................................................................................Error! Bookmark not defined.
Ratios...............................................................................................................................................1
Profitability Ratio........................................................................................................................1
Return on Capital Employed...................................................................................................1
Net Profit Margin.....................................................................................................................1
Gross profit Margin.................................................................................................................1
Efficiency Ratio...........................................................................................................................1
Debtors.....................................................................................................................................1
Creditors..................................................................................................................................1
Liquidity Ratio.............................................................................................................................1
Current Ratio...........................................................................................................................1
Quick Ratio..............................................................................................................................1
Cash Analysis..............................................................................................................................1
Financial Ratio.............................................................................................................................1
Gearing Ratio...........................................................................................................................1
STRATEGIC MANAGEMENT REPORT ON NETFLIX 2
Interest Coverage Ratio...........................................................................................................1
Investors Ratio.............................................................................................................................1
EPS Ratio.................................................................................................................................1
Market Share................................................................................................................................1
Conclusion:....................................................................................Error! Bookmark not defined.
Key Performance Indicator..............................................................................................................1
Segment Analysis (Q1-Q3)..............................................................................................................1
Segmentation Analysis....................................................................................................................1
Global OTT and Pay Revenue.....................................................................................................1
Competitor Analysis........................................................................................................................1
A) General..............................................................................................................................1
Online TV & Movie Piracy Losses to Soar to $52 billion..............................................................1
B) Specific Competitors.........................................................................................................1
Marketing.....................................................................................................................................1
Product.........................................................................................................................................1
Price.............................................................................................................................................1
Place.............................................................................................................................................1
Promotion....................................................................................................................................1
People.........................................................................................Error! Bookmark not defined.
Human Resource Management Analysis.........................................................................................1
STRATEGIC MANAGEMENT REPORT ON NETFLIX 3
Corporate Governance.................................................................................................................1
Operations........................................................................................................................................1
References:......................................................................................................................................1
Appendix:........................................................................................................................................1
Appendix 1 Financial Statement..................................................................................................1
Appendix 2: Ratios......................................................................................................................1
Appendix 4: Market Share.......................................................................................................1
Appendix5: Organization Culture and Values.............................................................................1
Appendix 6: Employees...............................................................................................................1
Appendix 7: Market Analysis......................................................................................................1
Appendix:....................................................................................................................................1
STRATEGIC MANAGEMENT REPORT ON NETFLIX 4
Introduction
In the year 1997 at Scotts Valley, California, Marc Randolph along with Reed Hastings
founded Netflix. As Hastings faced problems and he felt frustrated for Paying $40 as late fees to
Blockbusters for Apollo 13. To completely wipe off the problem he founded a solution Netflix
for every customers. Netflix is known as the foremost internet subscription services in respect to
TV episodes and movies in over 40 nations across the world. It has 33 million subscribers.
Netflix belonging to entertainment is traded in NASDQ. (Ir.netflix.com, 2018)
Current Issues
- Netflix spent more currency to attract clients along with developing the market. In this
regard, it does not put much focus on consumer service. Due to sluggish facilities
consumers’ rate decreased.
- Video on Demand had influence the performance of Netflix. This had provide immediate
view support to the consumers in regard to watch latest movies. This had proved that
VOD is better than the DVD rental along with the traditional video stores.
Geographical location and SBU’s
SBU Geographical Location
Domestic Streaming USA
International Streaming Sweden, United kingdom, Italy
Domestic DVD USA, Canada, Japan
STRATEGIC MANAGEMENT REPORT ON NETFLIX 5
Future Challenges
The nonexistence of advertising revenues for ads.
Netflix focus in the subsequent years is absolutely the High Dynamic Range that is an
innovative average set for the superiority of the appearance. (Vena 2018).
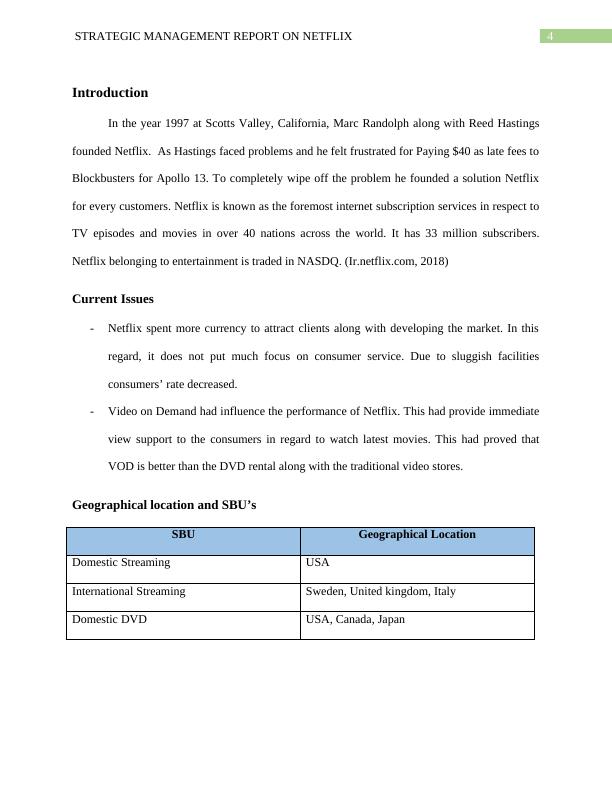
Financial Analysis
Financial Highlights 2015-2018
In 2015, debts increased as it signed partnership agreement with Soft Bank to launch in Japan.
Operating profit margin in 2015 amounted to 4.51%
In 2017, Net Income increased to 33.40% compare to 2016.
$146.7 billion was the market capitalization till July 2018
Future Challenges
The nonexistence of advertising revenues for ads.
Netflix focus in the subsequent years is absolutely the High Dynamic Range that is an
innovative average set for the superiority of the appearance. (Vena 2018).
Financial Analysis
Financial Highlights 2015-2018
In 2015, debts increased as it signed partnership agreement with Soft Bank to launch in Japan.
Operating profit margin in 2015 amounted to 4.51%
In 2017, Net Income increased to 33.40% compare to 2016.
$146.7 billion was the market capitalization till July 2018
STRATEGIC MANAGEMENT REPORT ON NETFLIX 6
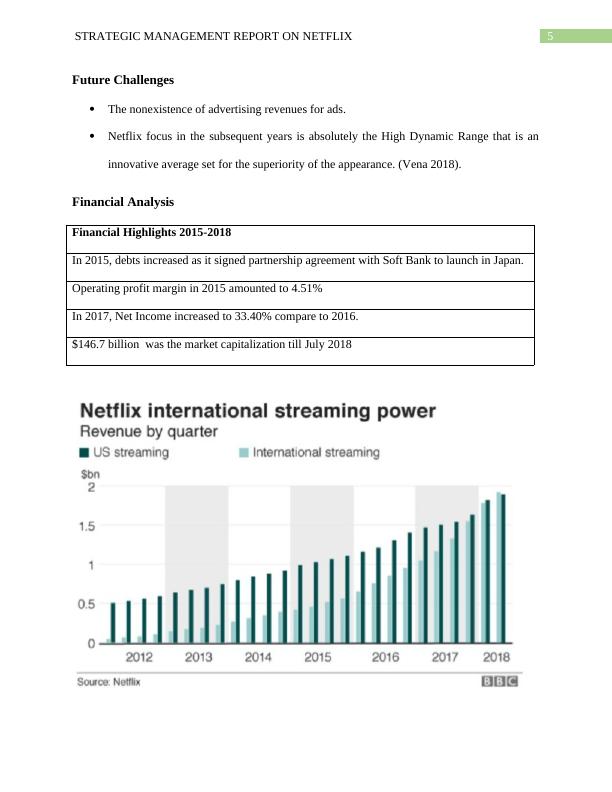
2014 2015 2016 2017
Domestic Streaming 343143 4180339 5077307 6153025
International Streaming 1308061 1953435 3211095 5089191
Domestic DVD Streaming 765161 645737 542267 450497
$500,000
$1,500,000
$2,500,000
$3,500,000
$4,500,000
$5,500,000
$6,500,000
Revenue
Domestic Streaming International Streaming Domestic DVD
2018(Q1) 1820019 1782086 98751
2018(Q2) 1893222 1921144 92904
$100,000.00
$300,000.00
$500,000.00
$700,000.00
$900,000.00
$1,100,000.00
$1,300,000.00
$1,500,000.00
$1,700,000.00
$1,900,000.00
Revenue 2018(Q1)(Q2)
STRATEGIC MANAGEMENT REPORT ON NETFLIX 7
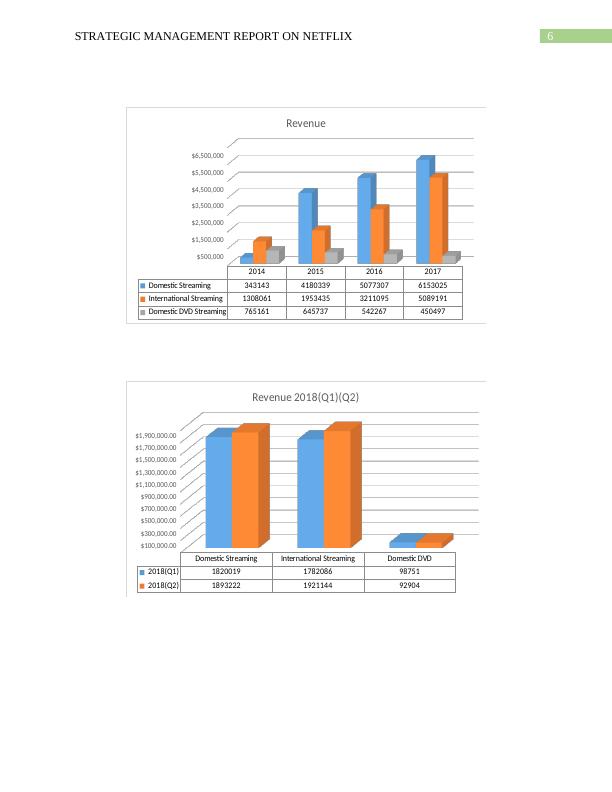
Automotive Automotive Leasing Energy Generation and
Storage Service and other
2017(Q1) 2035060 254540 213944 192726
2017(Q2) 2013852 272764 286780 216161
$250,000
$750,000
$1,250,000
$1,750,000
$2,250,000
Revenues 2017 Q1 & Q2
2017(Q1) 2017(Q2)
Ratios
Refer appendix 1,2 and 3
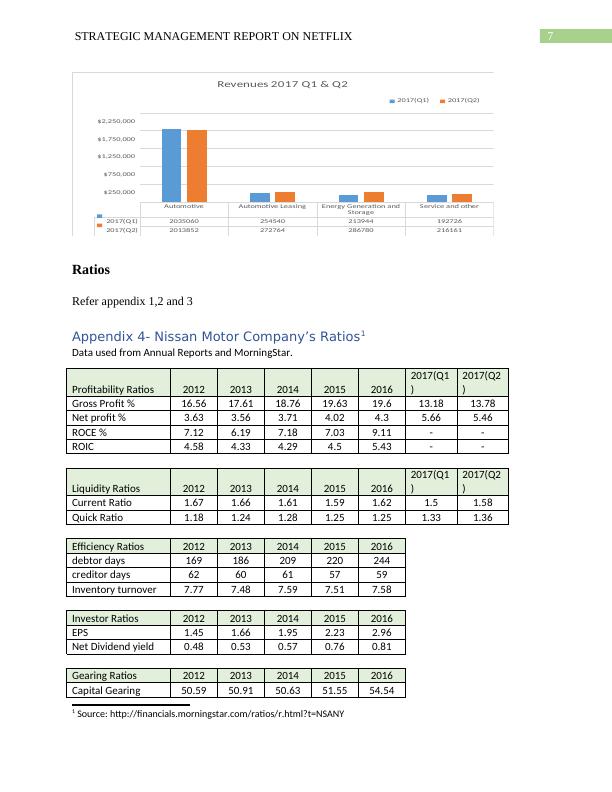
Appendix 4- Nissan Motor Company’s Ratios1
Data used from Annual Reports and MorningStar.
Profitability Ratios 2012 2013 2014 2015 2016
2017(Q1
)
2017(Q2
)
Gross Profit % 16.56 17.61 18.76 19.63 19.6 13.18 13.78
Net profit % 3.63 3.56 3.71 4.02 4.3 5.66 5.46
ROCE % 7.12 6.19 7.18 7.03 9.11 - -
ROIC 4.58 4.33 4.29 4.5 5.43 - -
Liquidity Ratios 2012 2013 2014 2015 2016
2017(Q1
)
2017(Q2
)
Current Ratio 1.67 1.66 1.61 1.59 1.62 1.5 1.58
Quick Ratio 1.18 1.24 1.28 1.25 1.25 1.33 1.36
Efficiency Ratios 2012 2013 2014 2015 2016
debtor days 169 186 209 220 244
creditor days 62 60 61 57 59
Inventory turnover 7.77 7.48 7.59 7.51 7.58
Investor Ratios 2012 2013 2014 2015 2016
EPS 1.45 1.66 1.95 2.23 2.96
Net Dividend yield 0.48 0.53 0.57 0.76 0.81
Gearing Ratios 2012 2013 2014 2015 2016
Capital Gearing 50.59 50.91 50.63 51.55 54.54
1 Source: http://financials.morningstar.com/ratios/r.html?t=NSANY
Automotive Automotive Leasing Energy Generation and
Storage Service and other
2017(Q1) 2035060 254540 213944 192726
2017(Q2) 2013852 272764 286780 216161
$250,000
$750,000
$1,250,000
$1,750,000
$2,250,000
Revenues 2017 Q1 & Q2
2017(Q1) 2017(Q2)
Ratios
Refer appendix 1,2 and 3
Appendix 4- Nissan Motor Company’s Ratios1
Data used from Annual Reports and MorningStar.
Profitability Ratios 2012 2013 2014 2015 2016
2017(Q1
)
2017(Q2
)
Gross Profit % 16.56 17.61 18.76 19.63 19.6 13.18 13.78
Net profit % 3.63 3.56 3.71 4.02 4.3 5.66 5.46
ROCE % 7.12 6.19 7.18 7.03 9.11 - -
ROIC 4.58 4.33 4.29 4.5 5.43 - -
Liquidity Ratios 2012 2013 2014 2015 2016
2017(Q1
)
2017(Q2
)
Current Ratio 1.67 1.66 1.61 1.59 1.62 1.5 1.58
Quick Ratio 1.18 1.24 1.28 1.25 1.25 1.33 1.36
Efficiency Ratios 2012 2013 2014 2015 2016
debtor days 169 186 209 220 244
creditor days 62 60 61 57 59
Inventory turnover 7.77 7.48 7.59 7.51 7.58
Investor Ratios 2012 2013 2014 2015 2016
EPS 1.45 1.66 1.95 2.23 2.96
Net Dividend yield 0.48 0.53 0.57 0.76 0.81
Gearing Ratios 2012 2013 2014 2015 2016
Capital Gearing 50.59 50.91 50.63 51.55 54.54
1 Source: http://financials.morningstar.com/ratios/r.html?t=NSANY
End of preview
Want to access all the pages? Upload your documents or become a member.
Related Documents
Strategic Finance Management for Netflix: Financial, Marketing, HRM and Operations Analysislg...
|37
|5968
|352
Assignment on Business Policy : Netflixlg...
|14
|3551
|42
Strategic Analysis of Netflix and Blockbuster: Technology, Pricing, and Innovationlg...
|13
|4251
|153
Netflix Pricing: Analysis of Marketing Strategy in Oligopoly Marketlg...
|4
|734
|64
Financial Performance of Netflix: Subscribers Growth, Covid-19 Impact, and Dividend Policylg...
|20
|4474
|83
Innovation and New Technology: A Case Study of Blockbuster and Netflixlg...
|14
|3012
|214