Strategic Finance Management for Netflix: Financial, Marketing, HRM and Operations Analysis
Strategic Financial Management Report for the course FINA1035: Strategic Financial Mgt at Greenwich University Business School
37 Pages5968 Words352 Views
Added on 2022-11-23
About This Document
This report deals with the complete analysis of Netflix which includes financial analysis, marketing, HRM and operations analysis. All work in this report is obtained from the case study unless referenced otherwise.
Strategic Finance Management for Netflix: Financial, Marketing, HRM and Operations Analysis
Strategic Financial Management Report for the course FINA1035: Strategic Financial Mgt at Greenwich University Business School
Added on 2022-11-23
ShareRelated Documents
Running Head: Strategic Finance Management
NETFLIX
Strategic Finance
Management
This report deals with the complete analysis of Netflix which includes financial analysis,
marketing, HRM and operations analysis. All work in this report is obtained from the case
study unless referenced otherwise.
NETFLIX
Strategic Finance
Management
This report deals with the complete analysis of Netflix which includes financial analysis,
marketing, HRM and operations analysis. All work in this report is obtained from the case
study unless referenced otherwise.
Strategic Finance Management
Contents
1. Introduction........................................................................................................ 2
2. Financial Analysis................................................................................................. 3
2.1 Profitability Ratios........................................................................................... 3
2.2 Gross Margin vs. Operating Expenses....................................................................5
2.3 Liquidity Ratios............................................................................................... 6
2.4 Efficiency Ratios............................................................................................. 7
2.5 Cash Flow Analysis.......................................................................................... 9
2.6 Gearing Ratios................................................................................................ 9
2.7 Investors...................................................................................................... 10
2.8 Segmentation Analysis.................................................................................... 11
2.9 Competitor Analysis....................................................................................... 11
3. Marketing Analysis............................................................................................. 12
4. Human Resource Management Analysis...................................................................13
4.1 Core Values of Netflix........................................................................................ 13
4.2 Skills............................................................................................................. 13
4.3 Pay................................................................................................................ 13
4.4 Additional Compensation.................................................................................... 14
4.5 Culture........................................................................................................... 14
4.6 Number of Employees........................................................................................ 14
4.7 Recruitment..................................................................................................... 14
4.8 Structure of Netflix............................................................................................ 15
4.9 Corporate Governance at Netflix...........................................................................15
5. Operations Analysis............................................................................................ 16
5.1 Value Chain of Netflix........................................................................................ 16
5.2 Primary Activities......................................................................................... 16
5.3 Supporting Activities..................................................................................... 17
6. Strengths and Weakness for Netflix.........................................................................18
References.............................................................................................................. 20
1
Strategic Finance Management
Appendices............................................................................................................. 24
Appendix 1.......................................................................................................... 24
Appendix 2.......................................................................................................... 27
Appendix 3.......................................................................................................... 27
Appendix 4.......................................................................................................... 30
Appendix 5.......................................................................................................... 31
1. Introduction
2
Strategic Finance Management
Netflix was started by Marc Randolph and Reed Hastings in 1997. At present, Reed Hastings
is its Chief Operating Officer. Subscription service was started by the company in 1999. The
company is leading in the area of internet entertainment service with more than 151 million
paid memberships in about one hundred ninety countries. It deals in streaming TV series,
feature films, documentaries etc.1
Netflix Business Operations
Earlier Netflix was into web based- catalogue service wherein it used to rent the DVD’s of
old movies through mail. They allowed the subscribed users to keep the DVD’s for as long as
they want without any late fee charges.
At present, the company is streaming a library of movies, TV shows, documentaries, in-house
contents etc. It generates revenue through streaming varieties of videos and audios for which
it charges a good amount of subscription fee.
Operational Market of Netflix
Netflix deals in a video streaming market which deals in video streaming services, generally
referred to as “Video on Demand” (VOD). VOD service refers to the system through which
users can watch the TV series, videos, movies, audios at any place at any point of time
without the constraint of watching the show at a fixed time. These shows are streamed
through internet and over the market (OTT) and are accessed through all kinds of internet
connected devices and set-top boxes.
Industry of Netflix
Netflix operates in the media industry where it has the competitors like Amazon, Disney and
HBO etc. All these companies are indulged into video streaming. The nature of the industry
is such that it allows the Netflix to carry out its business operation as vertically-integrated
company.
Strategic Business Unit (SBU) of Netflix
If we talk about the Strategic Business Unit (SBU) of Netflix then it includes domestic
streaming, and international streaming and domestic DVD. Netflix stream the videos only to
1 https://media.netflix.com/en/about-netflix
3
Strategic Finance Management
subscribed members of United States under domestic streaming. To the subscribed members
who reside outside the United States, the videos are streamed under International streaming.
Lastly, under Domestic DVD the company generates sales from the membership fees charged
for mailing the DVD’s.
2. Financial Analysis
2.1 Profitability Ratios
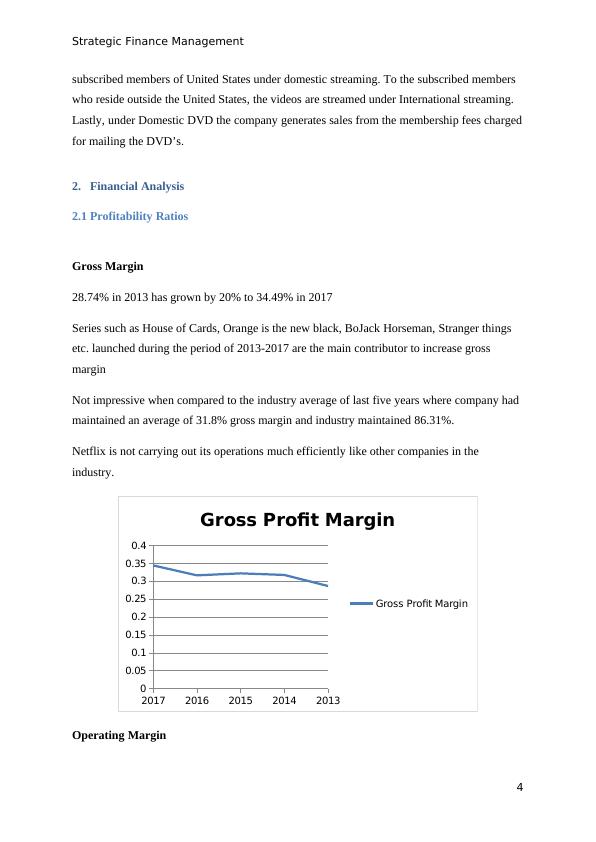
Gross Margin
28.74% in 2013 has grown by 20% to 34.49% in 2017
Series such as House of Cards, Orange is the new black, BoJack Horseman, Stranger things
etc. launched during the period of 2013-2017 are the main contributor to increase gross
margin
Not impressive when compared to the industry average of last five years where company had
maintained an average of 31.8% gross margin and industry maintained 86.31%.
Netflix is not carrying out its operations much efficiently like other companies in the
industry.
2017 2016 2015 2014 2013
0
0.05
0.1
0.15
0.2
0.25
0.3
0.35
0.4
Gross Profit Margin
Gross Profit Margin
Operating Margin
4
subscribed members of United States under domestic streaming. To the subscribed members
who reside outside the United States, the videos are streamed under International streaming.
Lastly, under Domestic DVD the company generates sales from the membership fees charged
for mailing the DVD’s.
2. Financial Analysis
2.1 Profitability Ratios
Gross Margin
28.74% in 2013 has grown by 20% to 34.49% in 2017
Series such as House of Cards, Orange is the new black, BoJack Horseman, Stranger things
etc. launched during the period of 2013-2017 are the main contributor to increase gross
margin
Not impressive when compared to the industry average of last five years where company had
maintained an average of 31.8% gross margin and industry maintained 86.31%.
Netflix is not carrying out its operations much efficiently like other companies in the
industry.
2017 2016 2015 2014 2013
0
0.05
0.1
0.15
0.2
0.25
0.3
0.35
0.4
Gross Profit Margin
Gross Profit Margin
Operating Margin
4
Strategic Finance Management
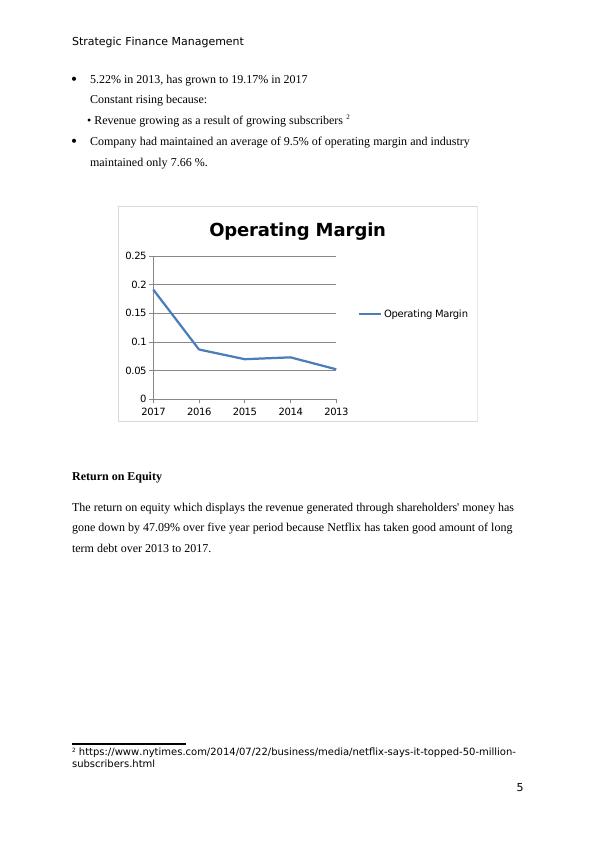
5.22% in 2013, has grown to 19.17% in 2017
Constant rising because:
• Revenue growing as a result of growing subscribers 2
Company had maintained an average of 9.5% of operating margin and industry
maintained only 7.66 %.
2017 2016 2015 2014 2013
0
0.05
0.1
0.15
0.2
0.25
Operating Margin
Operating Margin
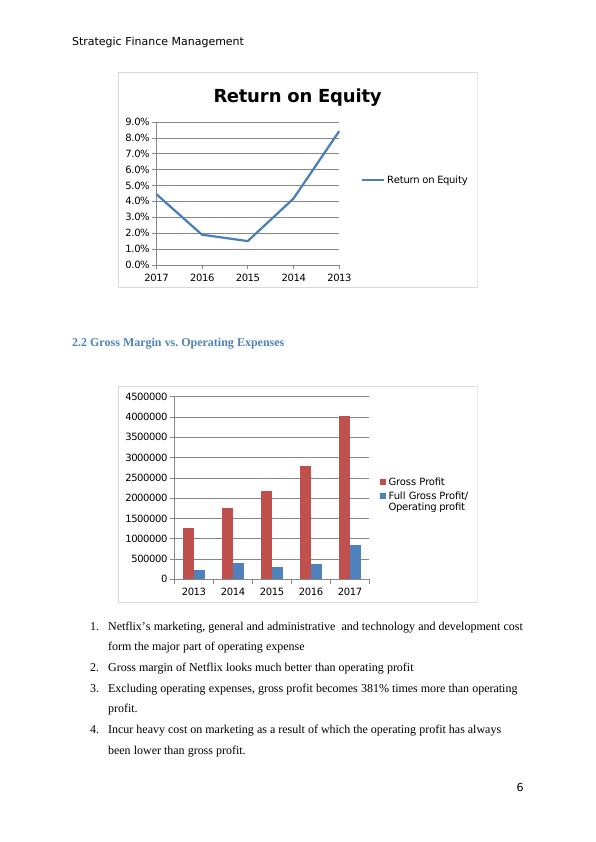
Return on Equity
The return on equity which displays the revenue generated through shareholders' money has
gone down by 47.09% over five year period because Netflix has taken good amount of long
term debt over 2013 to 2017.
2 https://www.nytimes.com/2014/07/22/business/media/netflix-says-it-topped-50-million-
subscribers.html
5
5.22% in 2013, has grown to 19.17% in 2017
Constant rising because:
• Revenue growing as a result of growing subscribers 2
Company had maintained an average of 9.5% of operating margin and industry
maintained only 7.66 %.
2017 2016 2015 2014 2013
0
0.05
0.1
0.15
0.2
0.25
Operating Margin
Operating Margin
Return on Equity
The return on equity which displays the revenue generated through shareholders' money has
gone down by 47.09% over five year period because Netflix has taken good amount of long
term debt over 2013 to 2017.
2 https://www.nytimes.com/2014/07/22/business/media/netflix-says-it-topped-50-million-
subscribers.html
5
Strategic Finance Management
2017 2016 2015 2014 2013
0.0%
1.0%
2.0%
3.0%
4.0%
5.0%
6.0%
7.0%
8.0%
9.0%
Return on Equity
Return on Equity
2.2 Gross Margin vs. Operating Expenses
2013 2014 2015 2016 2017
0
500000
1000000
1500000
2000000
2500000
3000000
3500000
4000000
4500000
Gross Profit
Full Gross Profit/
Operating profit
1. Netflix’s marketing, general and administrative and technology and development cost
form the major part of operating expense
2. Gross margin of Netflix looks much better than operating profit
3. Excluding operating expenses, gross profit becomes 381% times more than operating
profit.
4. Incur heavy cost on marketing as a result of which the operating profit has always
been lower than gross profit.
6
Strategic Finance Management
2.3 Liquidity Ratios
The liquidity ratios which mainly include current and quick ratios help to check the
company's efficiency in meeting its short term liabilities with the short term assets3.
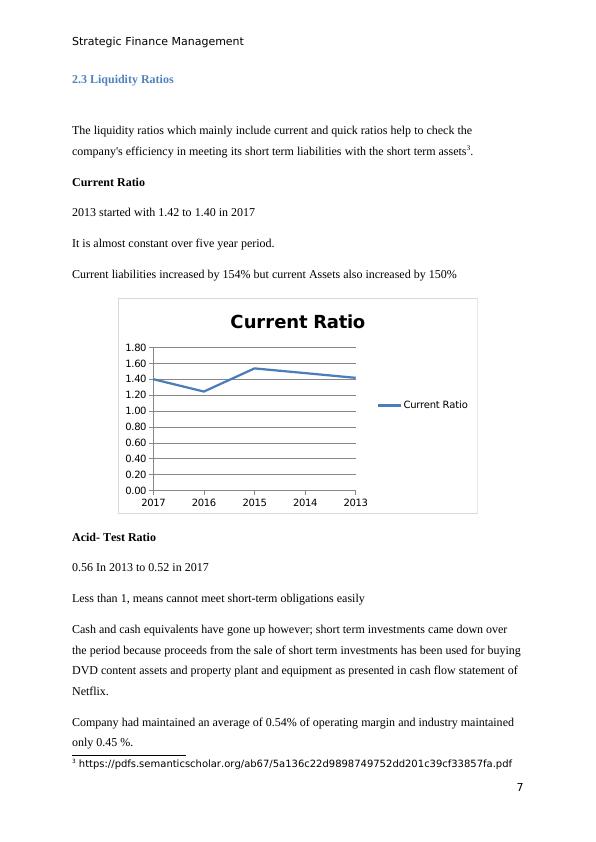
Current Ratio
2013 started with 1.42 to 1.40 in 2017
It is almost constant over five year period.
Current liabilities increased by 154% but current Assets also increased by 150%
2017 2016 2015 2014 2013
0.00
0.20
0.40
0.60
0.80
1.00
1.20
1.40
1.60
1.80
Current Ratio
Current Ratio
Acid- Test Ratio
0.56 In 2013 to 0.52 in 2017
Less than 1, means cannot meet short-term obligations easily
Cash and cash equivalents have gone up however; short term investments came down over
the period because proceeds from the sale of short term investments has been used for buying
DVD content assets and property plant and equipment as presented in cash flow statement of
Netflix.
Company had maintained an average of 0.54% of operating margin and industry maintained
only 0.45 %.
3 https://pdfs.semanticscholar.org/ab67/5a136c22d9898749752dd201c39cf33857fa.pdf
7
2.3 Liquidity Ratios
The liquidity ratios which mainly include current and quick ratios help to check the
company's efficiency in meeting its short term liabilities with the short term assets3.
Current Ratio
2013 started with 1.42 to 1.40 in 2017
It is almost constant over five year period.
Current liabilities increased by 154% but current Assets also increased by 150%
2017 2016 2015 2014 2013
0.00
0.20
0.40
0.60
0.80
1.00
1.20
1.40
1.60
1.80
Current Ratio
Current Ratio
Acid- Test Ratio
0.56 In 2013 to 0.52 in 2017
Less than 1, means cannot meet short-term obligations easily
Cash and cash equivalents have gone up however; short term investments came down over
the period because proceeds from the sale of short term investments has been used for buying
DVD content assets and property plant and equipment as presented in cash flow statement of
Netflix.
Company had maintained an average of 0.54% of operating margin and industry maintained
only 0.45 %.
3 https://pdfs.semanticscholar.org/ab67/5a136c22d9898749752dd201c39cf33857fa.pdf
7
End of preview
Want to access all the pages? Upload your documents or become a member.
Related Documents
Strategic Management Report on Netflixlg...
|52
|6291
|100
Netflix Background | Assignmentlg...
|8
|2761
|100
Managerial Economics - Netflix Inc.lg...
|5
|1210
|289
Netflix Product: Video on Demand and Streaming Media Authors Notelg...
|7
|419
|309
socio Economic and Legal Framework : Netflixlg...
|14
|4002
|27
Socio-Economic & Legal Environmentlg...
|20
|6923
|61