HP Customer Behavior Study Report
VerifiedAdded on 2020/02/05
|25
|6395
|202
Report
AI Summary
This report investigates the influence of customer behavior on Hewlett-Packard's critical success factors. Using various statistical methods including correlation analysis, factor analysis, descriptive statistics, and chi-square tests, the study analyzes data from a customer survey. Key findings reveal that several factors, including social, cultural, psychological, and personal influences, impact purchasing decisions. The study also highlights the importance of customer involvement and satisfaction, emphasizing the need for HP to enhance customer relationships through strategies like ECRM and targeted campaigns. Furthermore, the report underscores the significance of post-purchase services and customized products in boosting customer satisfaction. The analysis of hypotheses confirms the significant influence of these factors on customer buying behavior and overall success. The report concludes with recommendations for HP to improve customer motivation, involvement, and satisfaction, ultimately driving sales and brand loyalty.

Study on the customer behavioural
influence on the critical success factors of
Hewlett-Packard
influence on the critical success factors of
Hewlett-Packard
Paraphrase This Document
Need a fresh take? Get an instant paraphrase of this document with our AI Paraphraser
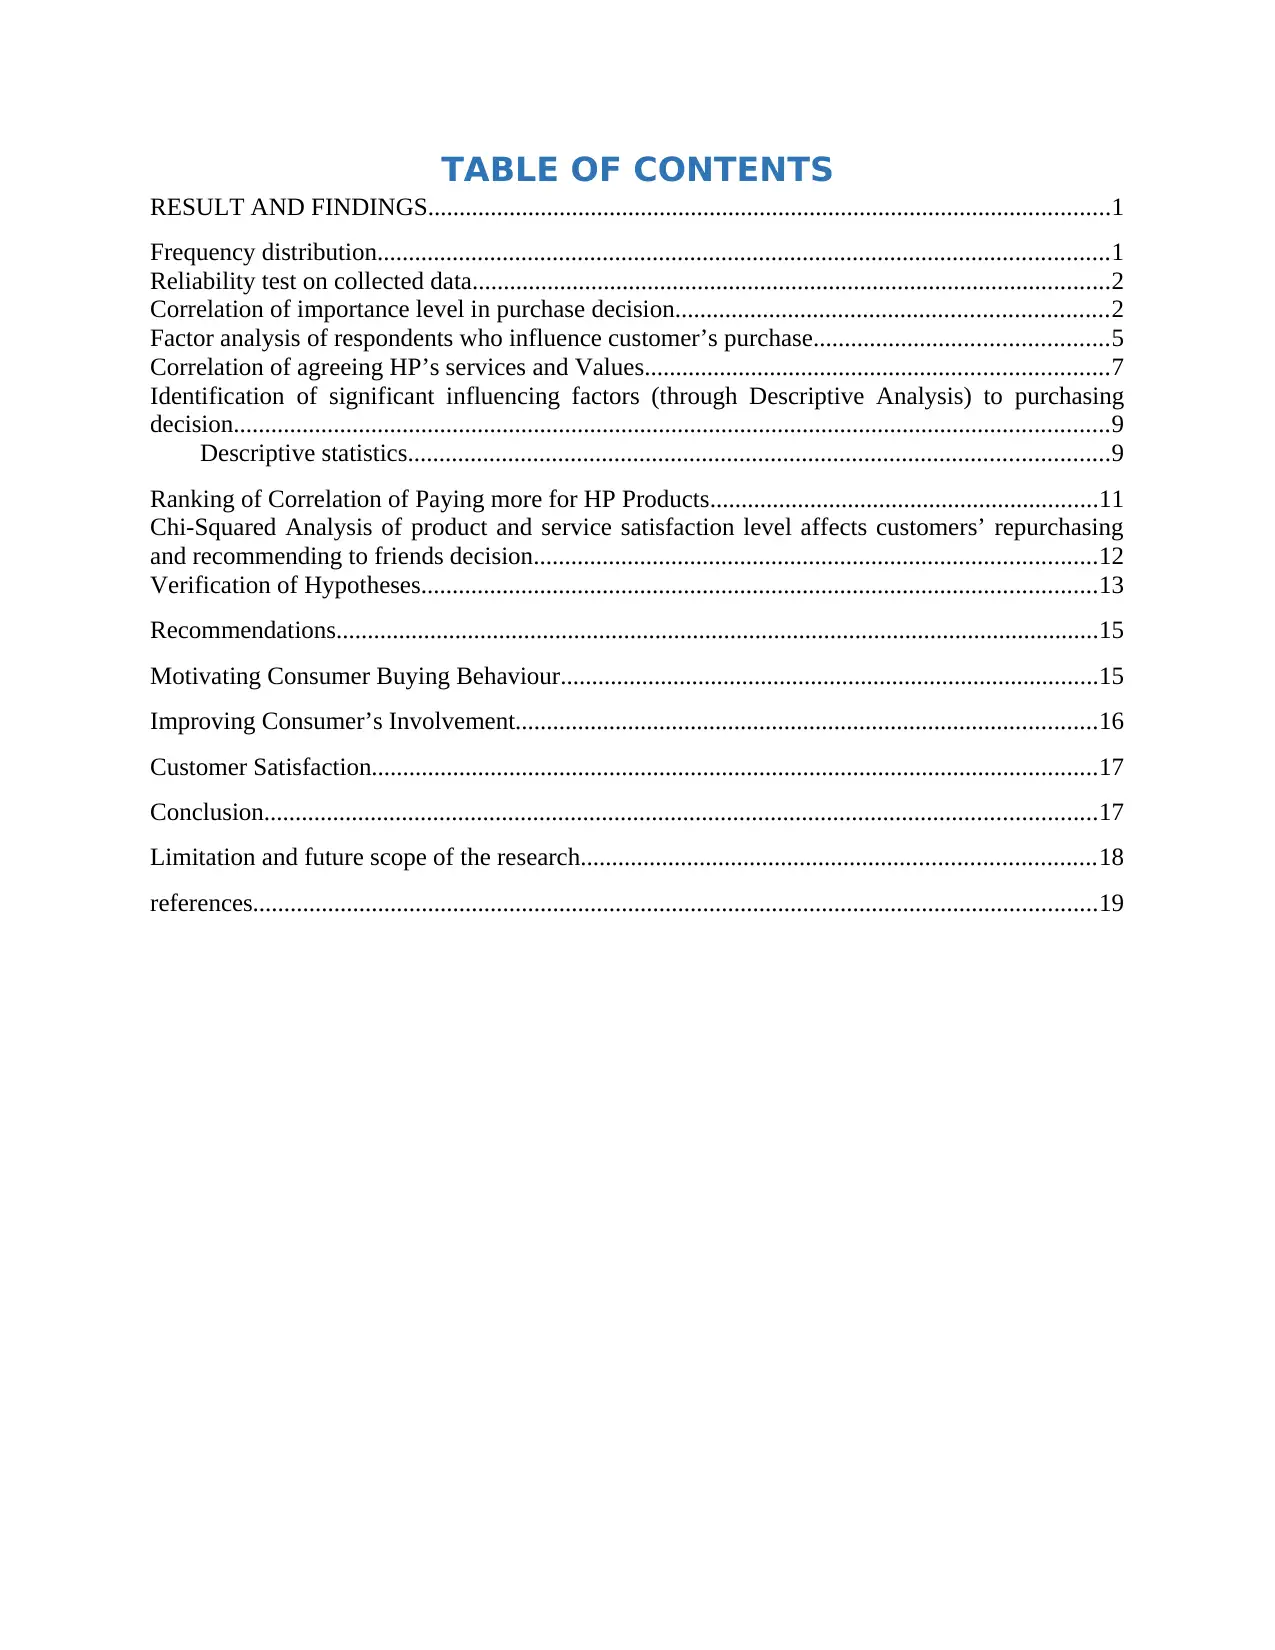
TABLE OF CONTENTS
RESULT AND FINDINGS.............................................................................................................1
Frequency distribution.....................................................................................................................1
Reliability test on collected data......................................................................................................2
Correlation of importance level in purchase decision.....................................................................2
Factor analysis of respondents who influence customer’s purchase...............................................5
Correlation of agreeing HP’s services and Values..........................................................................7
Identification of significant influencing factors (through Descriptive Analysis) to purchasing
decision............................................................................................................................................9
Descriptive statistics................................................................................................................9
Ranking of Correlation of Paying more for HP Products..............................................................11
Chi-Squared Analysis of product and service satisfaction level affects customers’ repurchasing
and recommending to friends decision..........................................................................................12
Verification of Hypotheses............................................................................................................13
Recommendations..........................................................................................................................15
Motivating Consumer Buying Behaviour......................................................................................15
Improving Consumer’s Involvement.............................................................................................16
Customer Satisfaction....................................................................................................................17
Conclusion.....................................................................................................................................17
Limitation and future scope of the research..................................................................................18
references.......................................................................................................................................19

LIST OF TABLES
Table 1: Frequency distribution of customers on the basis of gender.............................................1
Table 2: Frequency distribution of customers on the basis of age..................................................1
Table 3: Frequency distribution of customers on the basis of monthly income..............................2
Table 4: Reliability Test (Cronbach's Alpha)..................................................................................2
Table 5: Correlation of importance level in purchase decision.......................................................3
Table 6: Communality matrix..........................................................................................................5
Table 7: Variance explained............................................................................................................5
Table 8: Component Matrix.............................................................................................................6
Table 9: Correlation of agreeing HP’s services and Values............................................................7
Table 10: Descriptive statistics of level of influence on purchase decision of HP laptop...............9
Table 11: Descriptive Statistics of services of HP........................................................................10
Table 12: Ranking of Correlation of Paying more for HP Products..............................................11
Table 13: Tabulated value of Chi Square test................................................................................12
Table 14: Chi Square test...............................................................................................................12
⊘ This is a preview!⊘
Do you want full access?
Subscribe today to unlock all pages.
Trusted by 1+ million students worldwide
EXECUTIVE SUMMARY
For determining critical success factors and understanding buying behavior of customers of HP
researcher has used different tools and techniques. Therefore, for analyzing data researcher has
used Correlation coefficient analysis, Factor analysis, descriptive statistics and chi square test,
etc. All these statistical methods have helped in getting suitable findings for attaining aim and
objectives of the investigation. Findings of the investigation has concluded that there are number
of factors which can influence customers behavior at the time of purchasing products and
services of HP these factors are social, cultural, environmental. Psychological and personal.
Along with this, quality and features of the products can influence the brand loyalty of the
organization. So, organization needs to increase the involvement of customer because level of
satisfaction influence the purchase decision in positive manner. So, for motivating customers HP
needs to provide appropriate purchase value to customers as well as encourage customers to
given their review on internet. Along with this, as per the study campaign and ECRM are
appropriate strategies for increasing involvement of customers. For raising satisfaction level HP
should focus on customized products and post purchase services.
4 | P a g e
Paraphrase This Document
Need a fresh take? Get an instant paraphrase of this document with our AI Paraphraser
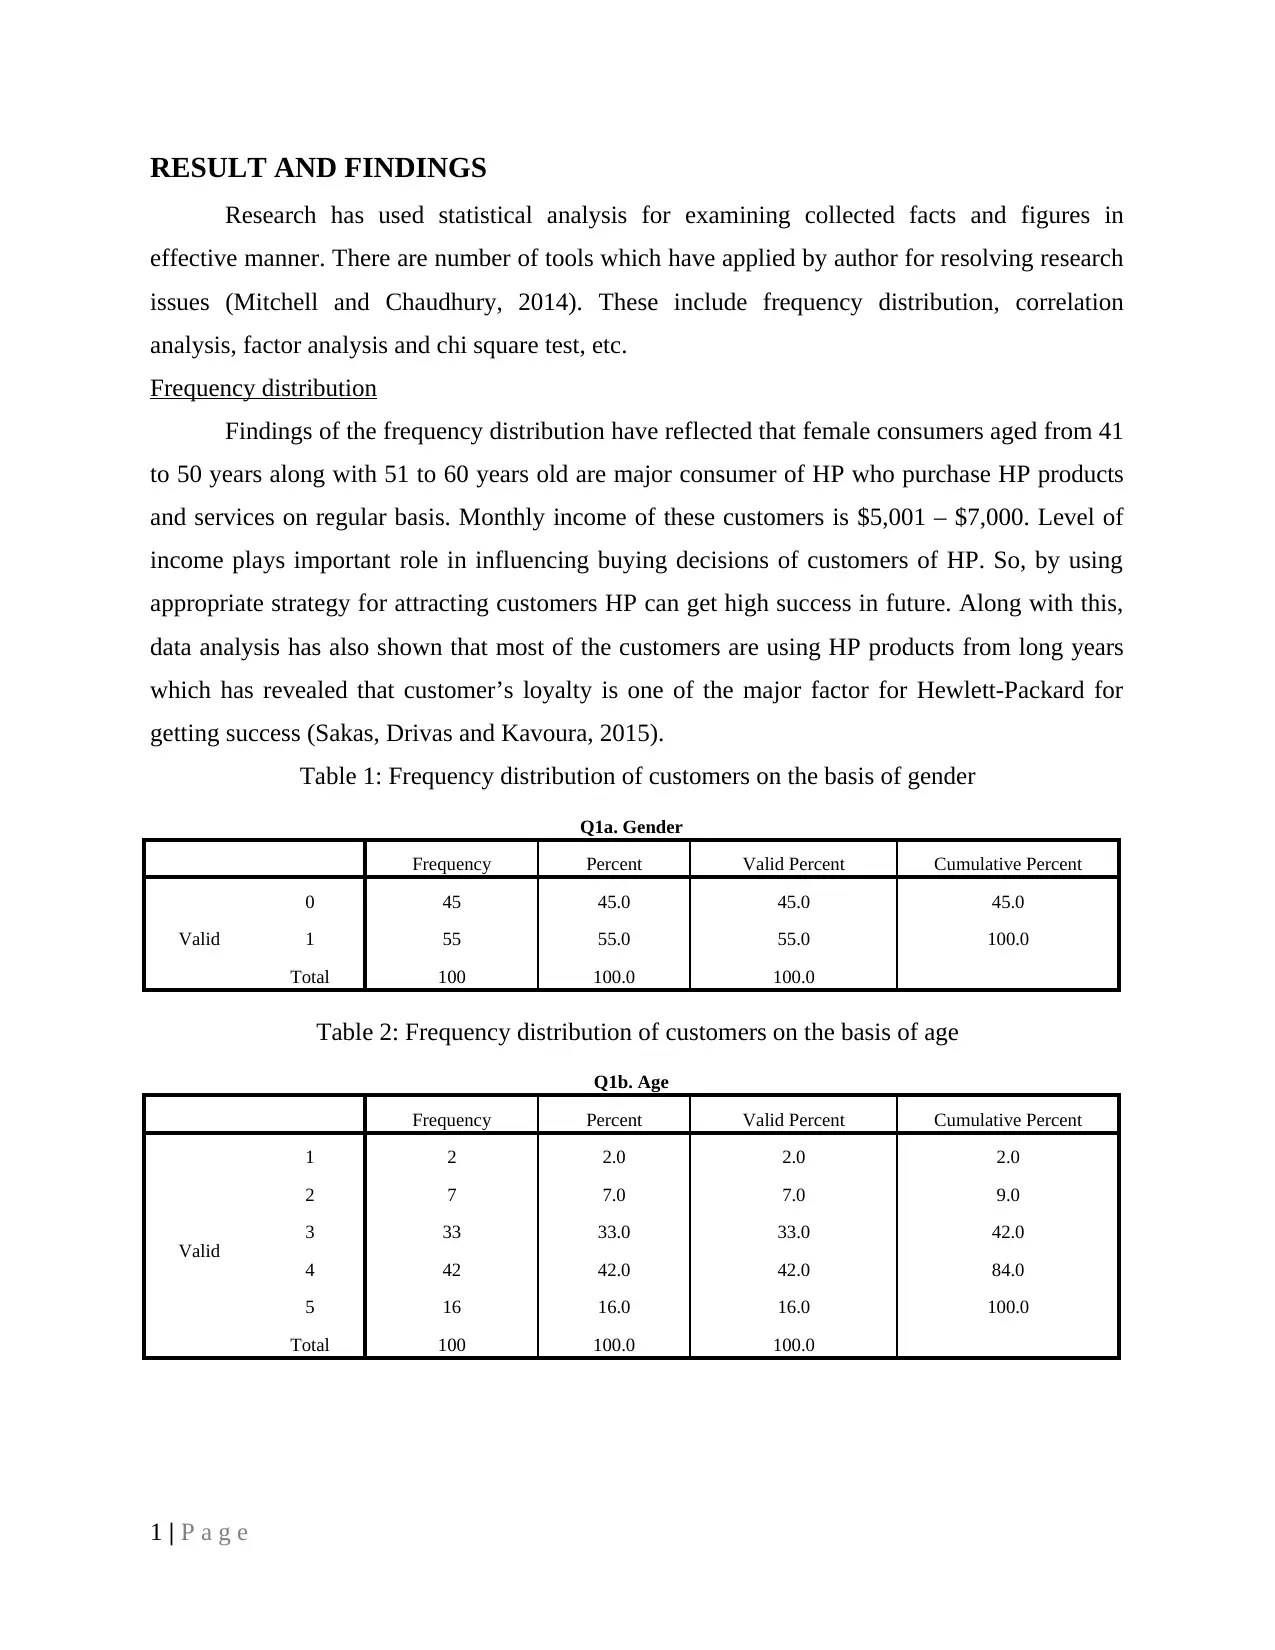
RESULT AND FINDINGS
Research has used statistical analysis for examining collected facts and figures in
effective manner. There are number of tools which have applied by author for resolving research
issues (Mitchell and Chaudhury, 2014). These include frequency distribution, correlation
analysis, factor analysis and chi square test, etc.
Frequency distribution
Findings of the frequency distribution have reflected that female consumers aged from 41
to 50 years along with 51 to 60 years old are major consumer of HP who purchase HP products
and services on regular basis. Monthly income of these customers is $5,001 – $7,000. Level of
income plays important role in influencing buying decisions of customers of HP. So, by using
appropriate strategy for attracting customers HP can get high success in future. Along with this,
data analysis has also shown that most of the customers are using HP products from long years
which has revealed that customer’s loyalty is one of the major factor for Hewlett-Packard for
getting success (Sakas, Drivas and Kavoura, 2015).
Table 1: Frequency distribution of customers on the basis of gender
Q1a. Gender
Frequency Percent Valid Percent Cumulative Percent
Valid
0 45 45.0 45.0 45.0
1 55 55.0 55.0 100.0
Total 100 100.0 100.0
Table 2: Frequency distribution of customers on the basis of age
Q1b. Age
Frequency Percent Valid Percent Cumulative Percent
Valid
1 2 2.0 2.0 2.0
2 7 7.0 7.0 9.0
3 33 33.0 33.0 42.0
4 42 42.0 42.0 84.0
5 16 16.0 16.0 100.0
Total 100 100.0 100.0
1 | P a g e

Table 3: Frequency distribution of customers on the basis of monthly income
Q1c. Monthly Income
Frequency Percent Valid Percent Cumulative Percent
Valid
1 9 9.0 9.0 9.0
2 8 8.0 8.0 17.0
3 29 29.0 29.0 46.0
4 27 27.0 27.0 73.0
5 27 27.0 27.0 100.0
Total 100 100.0 100.0
Reliability test on collected data
Internal consistency of data can be measured by Cronbach's Alpha which is a statistical
test. On the other hand, it is also considered as measure of scale reliability (Pérez and Del
Bosque, 2015). As per the standards, value of alpha (α) must be greater than 0.7. Researcher has
applied Cronbach's Alpha for examining reliability of primary information.
Table 4: Reliability Test (Cronbach's Alpha)
Reliability Statistics
Cronbach's Alpha N of Items
.851 61
Above table has reflected that value of alpha for the current investigation is 0.851
suggesting that sets of data have relatively high internal consistency. Including this, it has also
reflected strong reliability of the collected data which has provided most reliable results for
attaining aim and objectives in effective manner (Tong, Wong and Leung, 2013).
Correlation of importance level in purchase decision
Correlation coefficient can be defined as a measure which helps in determining linear
association between two variables. Coefficient of correlation vary from -1 to +1. In which minus
sign represents the negative relationship between both attributes and plus sign indicates positive
association (Sousa and Voss, 2012). A correlation greater than 0.8 is generally described as
strong, whereas a correlation less than 0.5 is generally described as weak. Therefore, in the
current study researcher has applied correlation methods for determining relationship between
2 | P a g e
⊘ This is a preview!⊘
Do you want full access?
Subscribe today to unlock all pages.
Trusted by 1+ million students worldwide
purchase decision of customers and different influential factors. So, calculation of correlation
coefficient is as follows:
Table 5: Correlation of importance level in purchase decision
Correlations
Q3a.
Level of
influence
of yourself
on
purchase
decision of
HP laptop
Q3b.
Level of
influence
of friends
on
purchase
decision of
HP laptop
Q3c.
Level of
influence
of family
members
on
purchase
decision of
HP laptop
Q3d.
Level of
influence
of spouse
on
purchase
decision of
HP laptop
Q3e. Level
of influence
of celebrity
endorsement
on purchase
decision of
HP laptop
Q3f.
Level of
influence
of
marketing
technique
on
purchase
decision of
HP laptop
Q3g.
Level of
influence
of sales
person on
purchase
decision of
HP laptop
Q3a. Level of
influence of
yourself on
purchase decision
of HP laptop
Pearson
Correlation 1 .147 .065 .210* -.267** -.098 -.065
Sig. (2-tailed) .145 .522 .036 .007 .333 .520
N 100 100 100 100 100 100 100
Q3b. Level of
influence of friends
on purchase
decision of HP
laptop
Pearson
Correlation .147 1 .780** .568** .392** .339** .271**
Sig. (2-tailed) .145 .000 .000 .000 .001 .006
N 100 100 100 100 100 100 100
Q3c. Level of
influence of family
members on
purchase decision
of HP laptop
Pearson
Correlation .065 .780** 1 .671** .367** .190 .235*
Sig. (2-tailed) .522 .000 .000 .000 .059 .019
N 100 100 100 100 100 100 100
Q3d. Level of
influence of spouse
on purchase
decision of HP
laptop
Pearson
Correlation .210* .568** .671** 1 .329** .313** .322**
Sig. (2-tailed) .036 .000 .000 .001 .002 .001
N 100 100 100 100 100 100 100
Q3e. Level of
influence of
celebrity
endorsement on
Pearson
Correlation -.267** .392** .367** .329** 1 .682** .551**
Sig. (2-tailed) .007 .000 .000 .001 .000 .000
N 100 100 100 100 100 100 100
3 | P a g e
Paraphrase This Document
Need a fresh take? Get an instant paraphrase of this document with our AI Paraphraser
purchase decision
Q3f. Level of
influence of
marketing
technique on
purchase decision
of HP laptop
Pearson
Correlation -.098 .339** .190 .313** .682** 1 .585**
Sig. (2-tailed) .333 .001 .059 .002 .000 .000
N 100 100 100 100 100 100 100
Q3g. Level of
influence of sales
person on purchase
decision of HP
laptop
Pearson
Correlation -.065 .271** .235* .322** .551** .585** 1
Sig. (2-tailed) .520 .006 .019 .001 .000 .000
N 100 100 100 100 100 100 100
*. Correlation is significant at the 0.05 level (2-tailed).
**. Correlation is significant at the 0.01 level (2-tailed).
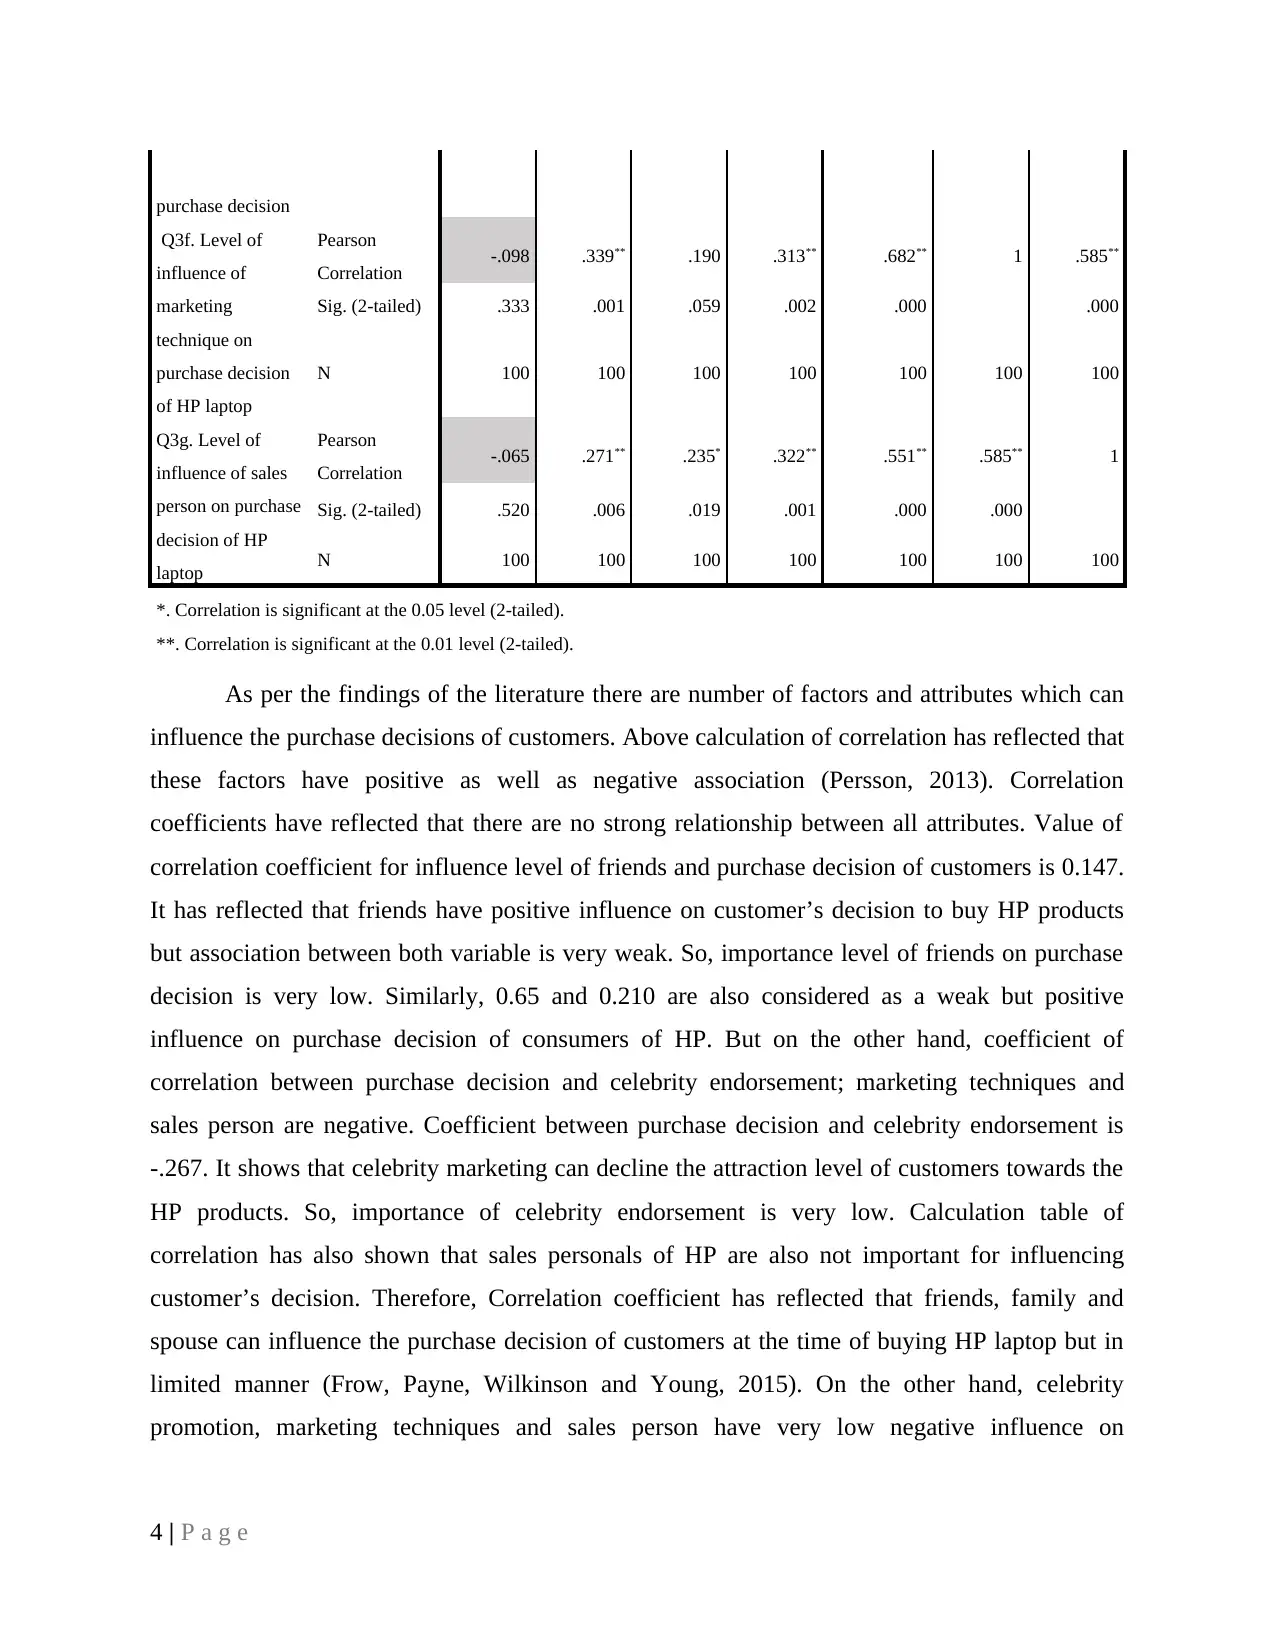
As per the findings of the literature there are number of factors and attributes which can
influence the purchase decisions of customers. Above calculation of correlation has reflected that
these factors have positive as well as negative association (Persson, 2013). Correlation
coefficients have reflected that there are no strong relationship between all attributes. Value of
correlation coefficient for influence level of friends and purchase decision of customers is 0.147.
It has reflected that friends have positive influence on customer’s decision to buy HP products
but association between both variable is very weak. So, importance level of friends on purchase
decision is very low. Similarly, 0.65 and 0.210 are also considered as a weak but positive
influence on purchase decision of consumers of HP. But on the other hand, coefficient of
correlation between purchase decision and celebrity endorsement; marketing techniques and
sales person are negative. Coefficient between purchase decision and celebrity endorsement is
-.267. It shows that celebrity marketing can decline the attraction level of customers towards the
HP products. So, importance of celebrity endorsement is very low. Calculation table of
correlation has also shown that sales personals of HP are also not important for influencing
customer’s decision. Therefore, Correlation coefficient has reflected that friends, family and
spouse can influence the purchase decision of customers at the time of buying HP laptop but in
limited manner (Frow, Payne, Wilkinson and Young, 2015). On the other hand, celebrity
promotion, marketing techniques and sales person have very low negative influence on
4 | P a g e
Q3f. Level of
influence of
marketing
technique on
purchase decision
of HP laptop
Pearson
Correlation -.098 .339** .190 .313** .682** 1 .585**
Sig. (2-tailed) .333 .001 .059 .002 .000 .000
N 100 100 100 100 100 100 100
Q3g. Level of
influence of sales
person on purchase
decision of HP
laptop
Pearson
Correlation -.065 .271** .235* .322** .551** .585** 1
Sig. (2-tailed) .520 .006 .019 .001 .000 .000
N 100 100 100 100 100 100 100
*. Correlation is significant at the 0.05 level (2-tailed).
**. Correlation is significant at the 0.01 level (2-tailed).
As per the findings of the literature there are number of factors and attributes which can
influence the purchase decisions of customers. Above calculation of correlation has reflected that
these factors have positive as well as negative association (Persson, 2013). Correlation
coefficients have reflected that there are no strong relationship between all attributes. Value of
correlation coefficient for influence level of friends and purchase decision of customers is 0.147.
It has reflected that friends have positive influence on customer’s decision to buy HP products
but association between both variable is very weak. So, importance level of friends on purchase
decision is very low. Similarly, 0.65 and 0.210 are also considered as a weak but positive
influence on purchase decision of consumers of HP. But on the other hand, coefficient of
correlation between purchase decision and celebrity endorsement; marketing techniques and
sales person are negative. Coefficient between purchase decision and celebrity endorsement is
-.267. It shows that celebrity marketing can decline the attraction level of customers towards the
HP products. So, importance of celebrity endorsement is very low. Calculation table of
correlation has also shown that sales personals of HP are also not important for influencing
customer’s decision. Therefore, Correlation coefficient has reflected that friends, family and
spouse can influence the purchase decision of customers at the time of buying HP laptop but in
limited manner (Frow, Payne, Wilkinson and Young, 2015). On the other hand, celebrity
promotion, marketing techniques and sales person have very low negative influence on
4 | P a g e
customers. So, level of importance is different for each and every factor but all these factors do
not have high influence on buying behaviour and decision of customers of Hewlett-Packard.
Factor analysis of respondents who influence customer’s purchase
Table 6: Communality matrix
Communalities
Initial Extraction
Q3a. Level of influence of yourself on purchase decision of HP laptop 1.000 .421
Q3b. Level of influence of friends on purchase decision of HP laptop 1.000 .763
Q3c. Level of influence of family members on purchase decision of HP
laptop
1.000 .782
Q3d. Level of influence of spouse on purchase decision of HP laptop 1.000 .709
Q3e. Level of influence of celebrity endorsement on purchase decision of
HP laptop
1.000 .788
Q3f. Level of influence of marketing technique on purchase decision of
HP laptop
1.000 .715
Q3g. Level of influence of sales person on purchase decision of HP laptop 1.000 .600
Table 7: Variance explained
Total Variance Explained
Component
Initial Eigenvalues
Extraction Sums of Squared
Loadings
Total
% of
Varianc
e
Cumulativ
e % Total
% of
Varianc
e
Cumulativ
e %
1 3.205 45.787 45.787 3.205 45.787 45.787
2 1.574 22.482 68.269 1.574 22.482 68.269
5 | P a g e
⊘ This is a preview!⊘
Do you want full access?
Subscribe today to unlock all pages.
Trusted by 1+ million students worldwide

3 .895 12.784 81.053
4 .476 6.803 87.857
5 .406 5.803 93.660
6 .287 4.096 97.756
7 .157 2.244 100.000
Extraction Method: Principal Component Analysis.
Table 8: Component Matrix
Component Matrixa
Component
1 2
Q3a. Level of influence of yourself on purchase decision of HP laptop .003 .649
Q3b. Level of influence of friends on purchase decision of HP laptop .779 .396
Q3c. Level of influence of family members on purchase decision of HP laptop .755 .460
Q3d. Level of influence of spouse on purchase decision of HP laptop .738 .406
Q3e. Level of influence of celebrity endorsement on purchase decision of HP
laptop
.753 -.469
Q3f. Level of influence of marketing technique on purchase decision of HP
laptop
.697 -.480
Q3g. Level of influence of sales person on purchase decision of HP laptop .657 -.411
Extraction Method: Principal Component Analysis.
a. 2 components extracted.
Findings of the factor analysis have reflected that marketing techniques and celebrity
endorsement had the highest percentage of 97.75% and 93.66% of impact on purchase decisions
of customers of HP. Spouse and family had 87.85% and 81.05% respectively. Friendless could
6 | P a g e
Paraphrase This Document
Need a fresh take? Get an instant paraphrase of this document with our AI Paraphraser
also influence the buying decision of customers at 68.26%. Customers could stimulus by
themselves at lowest level which was 45.78%. Overall, factor analysis has extracted two major
factors which can have influence on purchase decision of customers of HP either positive or
negative and these are celebrity endorsement and marketing techniques because these factors can
create question mark on quality of Hewlett-Packard laptop (Holman, 2015). So, organization
needs to use these factors in limits.
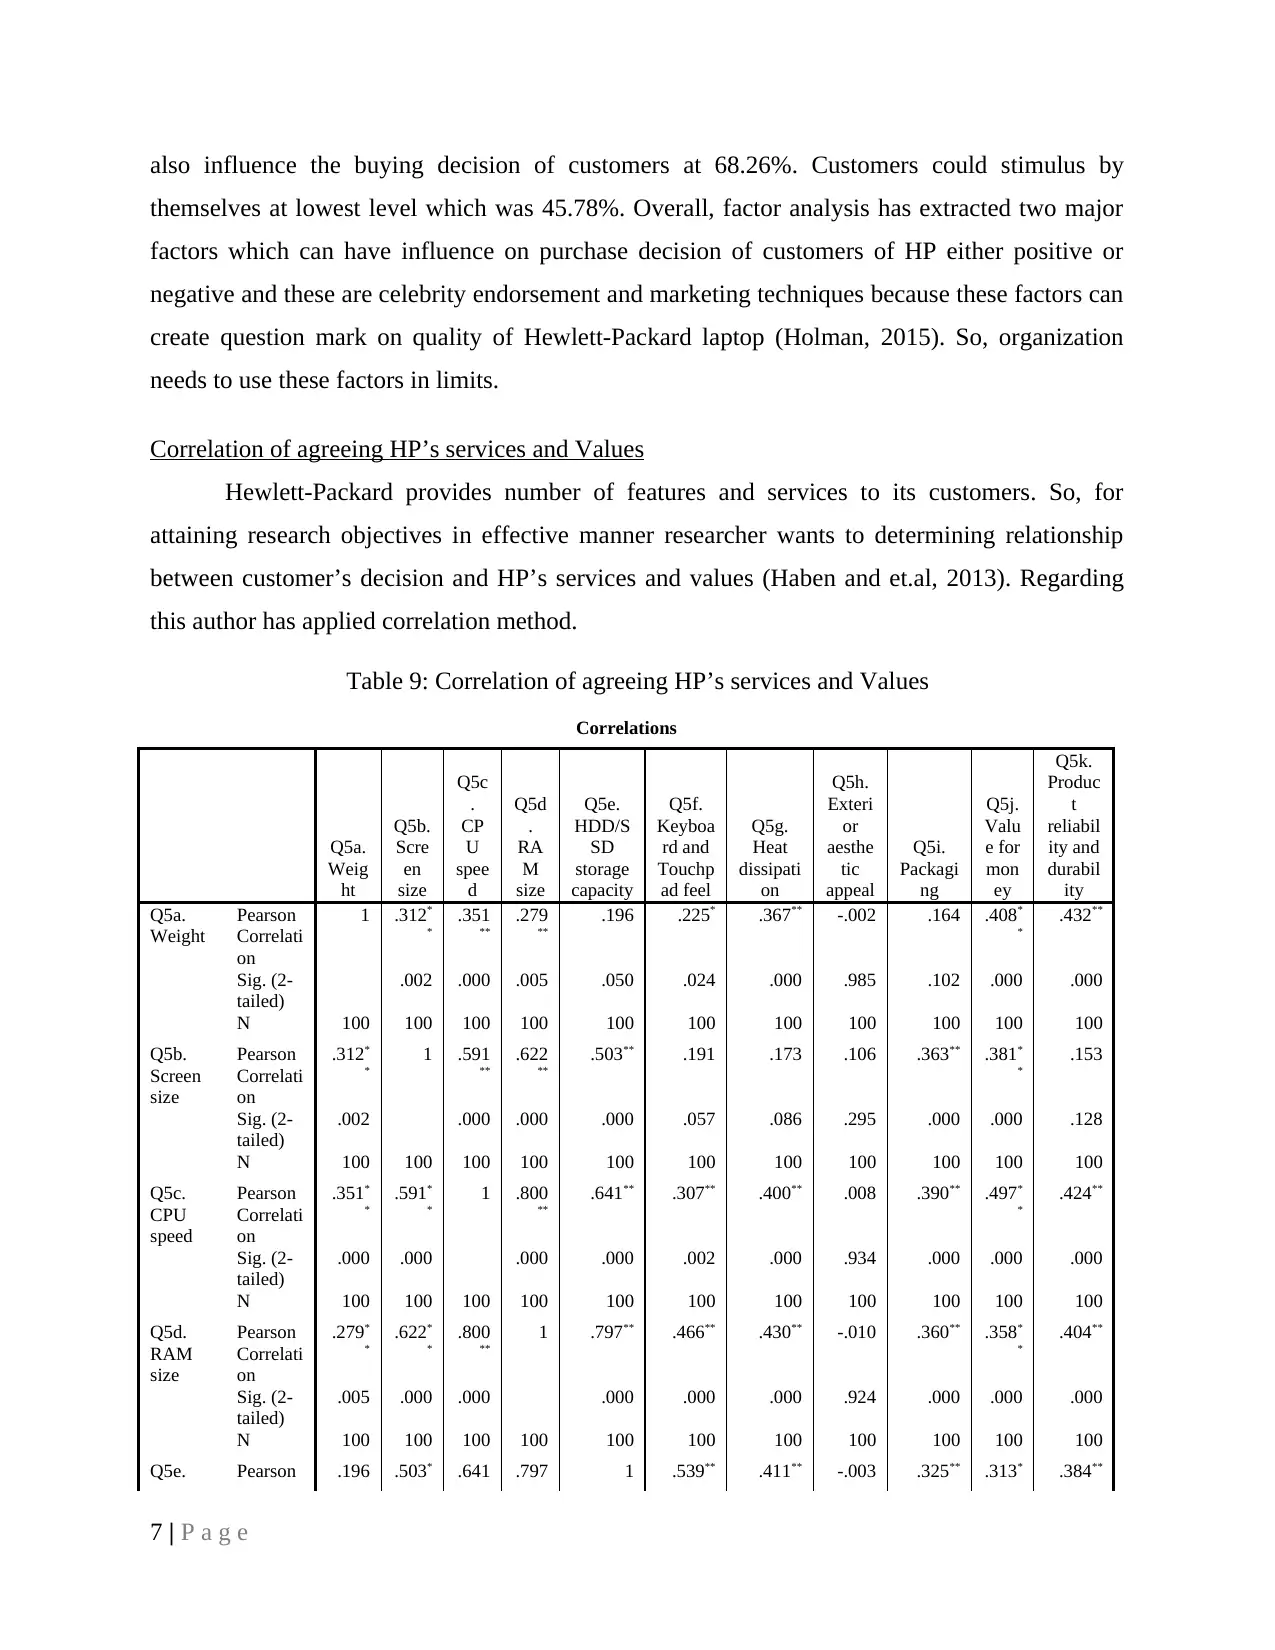
Correlation of agreeing HP’s services and Values
Hewlett-Packard provides number of features and services to its customers. So, for
attaining research objectives in effective manner researcher wants to determining relationship
between customer’s decision and HP’s services and values (Haben and et.al, 2013). Regarding
this author has applied correlation method.
Table 9: Correlation of agreeing HP’s services and Values
Correlations
Q5a.
Weig
ht
Q5b.
Scre
en
size
Q5c
.
CP
U
spee
d
Q5d
.
RA
M
size
Q5e.
HDD/S
SD
storage
capacity
Q5f.
Keyboa
rd and
Touchp
ad feel
Q5g.
Heat
dissipati
on
Q5h.
Exteri
or
aesthe
tic
appeal
Q5i.
Packagi
ng
Q5j.
Valu
e for
mon
ey
Q5k.
Produc
t
reliabil
ity and
durabil
ity
Q5a.
Weight
Pearson
Correlati
on
1 .312*
*
.351
**
.279
**
.196 .225* .367** -.002 .164 .408*
*
.432**
Sig. (2-
tailed)
.002 .000 .005 .050 .024 .000 .985 .102 .000 .000
N 100 100 100 100 100 100 100 100 100 100 100
Q5b.
Screen
size
Pearson
Correlati
on
.312*
*
1 .591
**
.622
**
.503** .191 .173 .106 .363** .381*
*
.153
Sig. (2-
tailed)
.002 .000 .000 .000 .057 .086 .295 .000 .000 .128
N 100 100 100 100 100 100 100 100 100 100 100
Q5c.
CPU
speed
Pearson
Correlati
on
.351*
*
.591*
*
1 .800
**
.641** .307** .400** .008 .390** .497*
*
.424**
Sig. (2-
tailed)
.000 .000 .000 .000 .002 .000 .934 .000 .000 .000
N 100 100 100 100 100 100 100 100 100 100 100
Q5d.
RAM
size
Pearson
Correlati
on
.279*
*
.622*
*
.800
**
1 .797** .466** .430** -.010 .360** .358*
*
.404**
Sig. (2-
tailed)
.005 .000 .000 .000 .000 .000 .924 .000 .000 .000
N 100 100 100 100 100 100 100 100 100 100 100
Q5e. Pearson .196 .503* .641 .797 1 .539** .411** -.003 .325** .313* .384**
7 | P a g e
themselves at lowest level which was 45.78%. Overall, factor analysis has extracted two major
factors which can have influence on purchase decision of customers of HP either positive or
negative and these are celebrity endorsement and marketing techniques because these factors can
create question mark on quality of Hewlett-Packard laptop (Holman, 2015). So, organization
needs to use these factors in limits.
Correlation of agreeing HP’s services and Values
Hewlett-Packard provides number of features and services to its customers. So, for
attaining research objectives in effective manner researcher wants to determining relationship
between customer’s decision and HP’s services and values (Haben and et.al, 2013). Regarding
this author has applied correlation method.
Table 9: Correlation of agreeing HP’s services and Values
Correlations
Q5a.
Weig
ht
Q5b.
Scre
en
size
Q5c
.
CP
U
spee
d
Q5d
.
RA
M
size
Q5e.
HDD/S
SD
storage
capacity
Q5f.
Keyboa
rd and
Touchp
ad feel
Q5g.
Heat
dissipati
on
Q5h.
Exteri
or
aesthe
tic
appeal
Q5i.
Packagi
ng
Q5j.
Valu
e for
mon
ey
Q5k.
Produc
t
reliabil
ity and
durabil
ity
Q5a.
Weight
Pearson
Correlati
on
1 .312*
*
.351
**
.279
**
.196 .225* .367** -.002 .164 .408*
*
.432**
Sig. (2-
tailed)
.002 .000 .005 .050 .024 .000 .985 .102 .000 .000
N 100 100 100 100 100 100 100 100 100 100 100
Q5b.
Screen
size
Pearson
Correlati
on
.312*
*
1 .591
**
.622
**
.503** .191 .173 .106 .363** .381*
*
.153
Sig. (2-
tailed)
.002 .000 .000 .000 .057 .086 .295 .000 .000 .128
N 100 100 100 100 100 100 100 100 100 100 100
Q5c.
CPU
speed
Pearson
Correlati
on
.351*
*
.591*
*
1 .800
**
.641** .307** .400** .008 .390** .497*
*
.424**
Sig. (2-
tailed)
.000 .000 .000 .000 .002 .000 .934 .000 .000 .000
N 100 100 100 100 100 100 100 100 100 100 100
Q5d.
RAM
size
Pearson
Correlati
on
.279*
*
.622*
*
.800
**
1 .797** .466** .430** -.010 .360** .358*
*
.404**
Sig. (2-
tailed)
.005 .000 .000 .000 .000 .000 .924 .000 .000 .000
N 100 100 100 100 100 100 100 100 100 100 100
Q5e. Pearson .196 .503* .641 .797 1 .539** .411** -.003 .325** .313* .384**
7 | P a g e
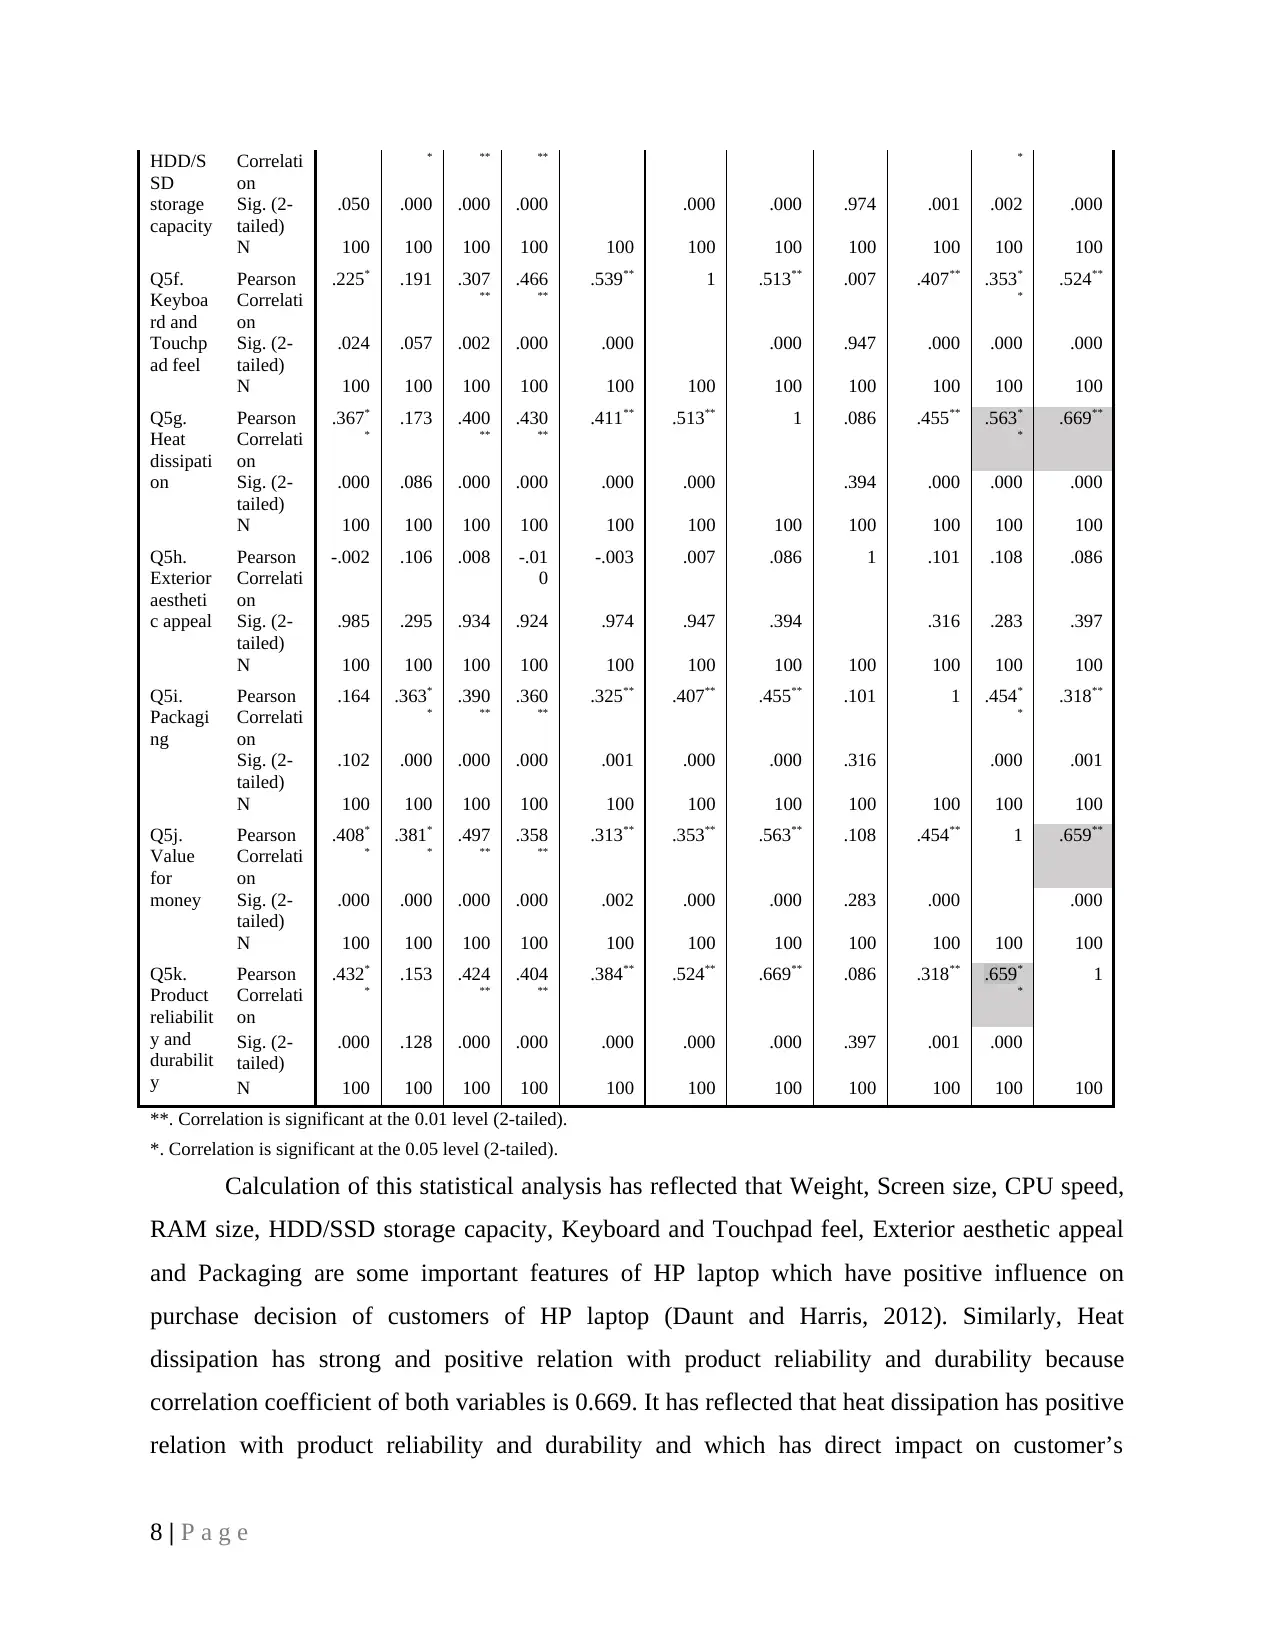
HDD/S
SD
storage
capacity
Correlati
on
* ** ** *
Sig. (2-
tailed)
.050 .000 .000 .000 .000 .000 .974 .001 .002 .000
N 100 100 100 100 100 100 100 100 100 100 100
Q5f.
Keyboa
rd and
Touchp
ad feel
Pearson
Correlati
on
.225* .191 .307
**
.466
**
.539** 1 .513** .007 .407** .353*
*
.524**
Sig. (2-
tailed)
.024 .057 .002 .000 .000 .000 .947 .000 .000 .000
N 100 100 100 100 100 100 100 100 100 100 100
Q5g.
Heat
dissipati
on
Pearson
Correlati
on
.367*
*
.173 .400
**
.430
**
.411** .513** 1 .086 .455** .563*
*
.669**
Sig. (2-
tailed)
.000 .086 .000 .000 .000 .000 .394 .000 .000 .000
N 100 100 100 100 100 100 100 100 100 100 100
Q5h.
Exterior
aestheti
c appeal
Pearson
Correlati
on
-.002 .106 .008 -.01
0
-.003 .007 .086 1 .101 .108 .086
Sig. (2-
tailed)
.985 .295 .934 .924 .974 .947 .394 .316 .283 .397
N 100 100 100 100 100 100 100 100 100 100 100
Q5i.
Packagi
ng
Pearson
Correlati
on
.164 .363*
*
.390
**
.360
**
.325** .407** .455** .101 1 .454*
*
.318**
Sig. (2-
tailed)
.102 .000 .000 .000 .001 .000 .000 .316 .000 .001
N 100 100 100 100 100 100 100 100 100 100 100
Q5j.
Value
for
money
Pearson
Correlati
on
.408*
*
.381*
*
.497
**
.358
**
.313** .353** .563** .108 .454** 1 .659**
Sig. (2-
tailed)
.000 .000 .000 .000 .002 .000 .000 .283 .000 .000
N 100 100 100 100 100 100 100 100 100 100 100
Q5k.
Product
reliabilit
y and
durabilit
y
Pearson
Correlati
on
.432*
*
.153 .424
**
.404
**
.384** .524** .669** .086 .318** .659*
*
1
Sig. (2-
tailed)
.000 .128 .000 .000 .000 .000 .000 .397 .001 .000
N 100 100 100 100 100 100 100 100 100 100 100
**. Correlation is significant at the 0.01 level (2-tailed).
*. Correlation is significant at the 0.05 level (2-tailed).
Calculation of this statistical analysis has reflected that Weight, Screen size, CPU speed,
RAM size, HDD/SSD storage capacity, Keyboard and Touchpad feel, Exterior aesthetic appeal
and Packaging are some important features of HP laptop which have positive influence on
purchase decision of customers of HP laptop (Daunt and Harris, 2012). Similarly, Heat
dissipation has strong and positive relation with product reliability and durability because
correlation coefficient of both variables is 0.669. It has reflected that heat dissipation has positive
relation with product reliability and durability and which has direct impact on customer’s
8 | P a g e
⊘ This is a preview!⊘
Do you want full access?
Subscribe today to unlock all pages.
Trusted by 1+ million students worldwide
1 out of 25
Related Documents

![Retail Grocery Customer Satisfaction Analysis Report - [University]](/_next/image/?url=https%3A%2F%2Fdesklib.com%2Fmedia%2Fimages%2Fbv%2Fb8a73bdc393b4353b49353de50973546.jpg&w=256&q=75)


Your All-in-One AI-Powered Toolkit for Academic Success.
+13062052269
info@desklib.com
Available 24*7 on WhatsApp / Email
![[object Object]](/_next/static/media/star-bottom.7253800d.svg)
Unlock your academic potential
Copyright © 2020–2026 A2Z Services. All Rights Reserved. Developed and managed by ZUCOL.