T1 2019 MN506: Server Availability Monitoring Tools Comparison Report
VerifiedAdded on 2022/12/26
|13
|2083
|28
Report
AI Summary
This report provides a comprehensive comparison of several server availability monitoring tools, including Nagios Core, Ganglia, CollectD, Spiceworks, Cacti, Zabbix, Icinga, OpenNMS, and WhatsUp Gold. The comparison focuses on key metrics such as disk usage, CPU monitoring, process monitoring, bandwidth monitoring, resource measuring, and overall availability. The report evaluates each tool's strengths and weaknesses, discussing their architecture and specific functionalities. A solution proposal is presented to address server vulnerabilities, emphasizing data security through encryption. The potential impact of failure prediction is also examined, highlighting the importance of preventive measures. The conclusion underscores the significance of using top-tier monitoring tools for rapid alerts and overall system security. The report also includes references to relevant academic sources.

Surname 1
Server Availability Monitoring Tools
Student Name
Student Number
Professor’s Name
Institution
Location of Institution
Date
Server Availability Monitoring Tools
Student Name
Student Number
Professor’s Name
Institution
Location of Institution
Date
Paraphrase This Document
Need a fresh take? Get an instant paraphrase of this document with our AI Paraphraser
Surname 2
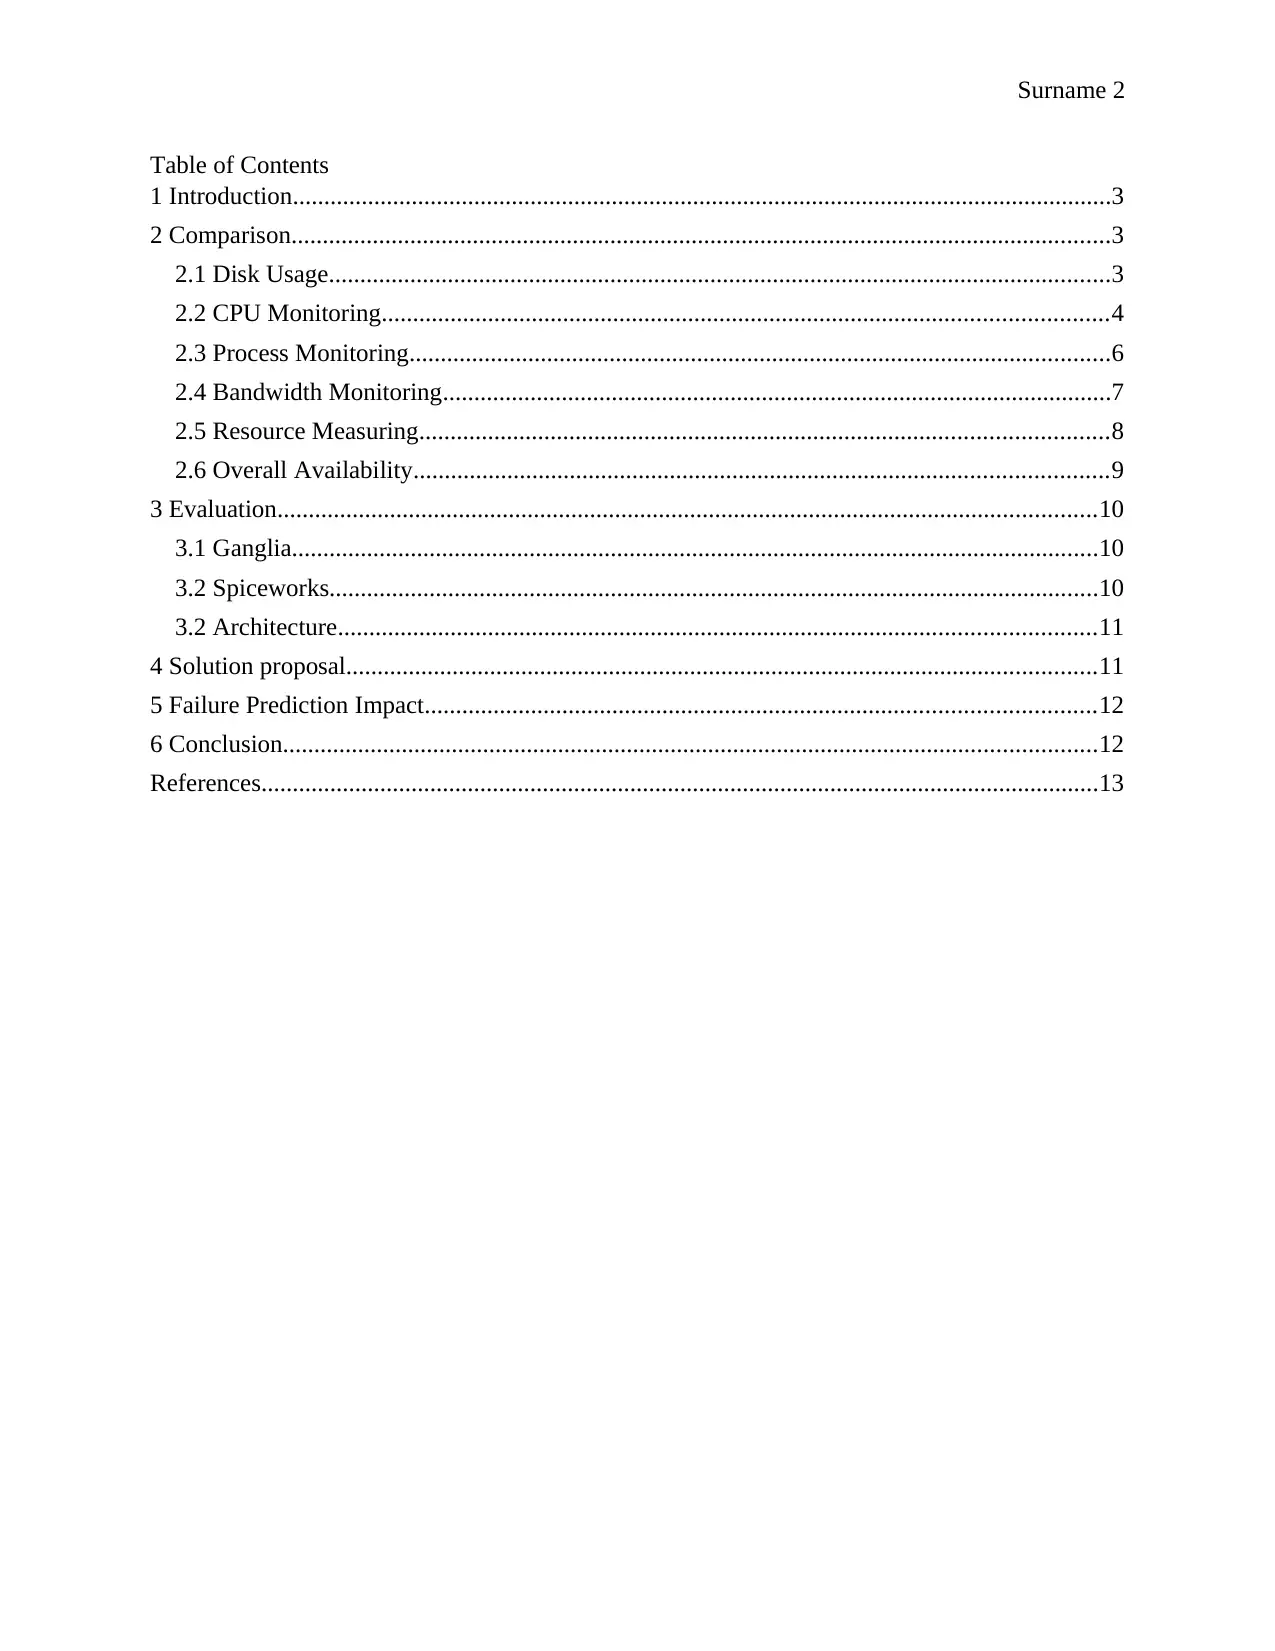
Table of Contents
1 Introduction...................................................................................................................................3
2 Comparison...................................................................................................................................3
2.1 Disk Usage.............................................................................................................................3
2.2 CPU Monitoring....................................................................................................................4
2.3 Process Monitoring................................................................................................................6
2.4 Bandwidth Monitoring...........................................................................................................7
2.5 Resource Measuring..............................................................................................................8
2.6 Overall Availability...............................................................................................................9
3 Evaluation...................................................................................................................................10
3.1 Ganglia.................................................................................................................................10
3.2 Spiceworks...........................................................................................................................10
3.2 Architecture.........................................................................................................................11
4 Solution proposal........................................................................................................................11
5 Failure Prediction Impact...........................................................................................................12
6 Conclusion..................................................................................................................................12
References......................................................................................................................................13
Surname 3
1 Introduction
Security is among the critical things that must be ensured in any organization. In every
organization, the security of information is simply done in the server side and this requires the
administration to ensure that its data is secure. Since a large portion of the task keeps on running
at a full-time premise, nobody can probably observe all edges of the association at a prior.
To avoid issues of framework server failures, there is a need for a few apparatuses that ensure
legitimate checking. In this examination report, we are going to think about the execution and the
utility of a portion of the server accessibility, observing devices including yet not restricted to;
Nagios Core, Ganglia, CollectD, Spiceworks, Cacti, Zabbix, Icinga, OpenNMS and WhatsUp
Gold as for the measurements we will consider in the following segment.
2 Comparison
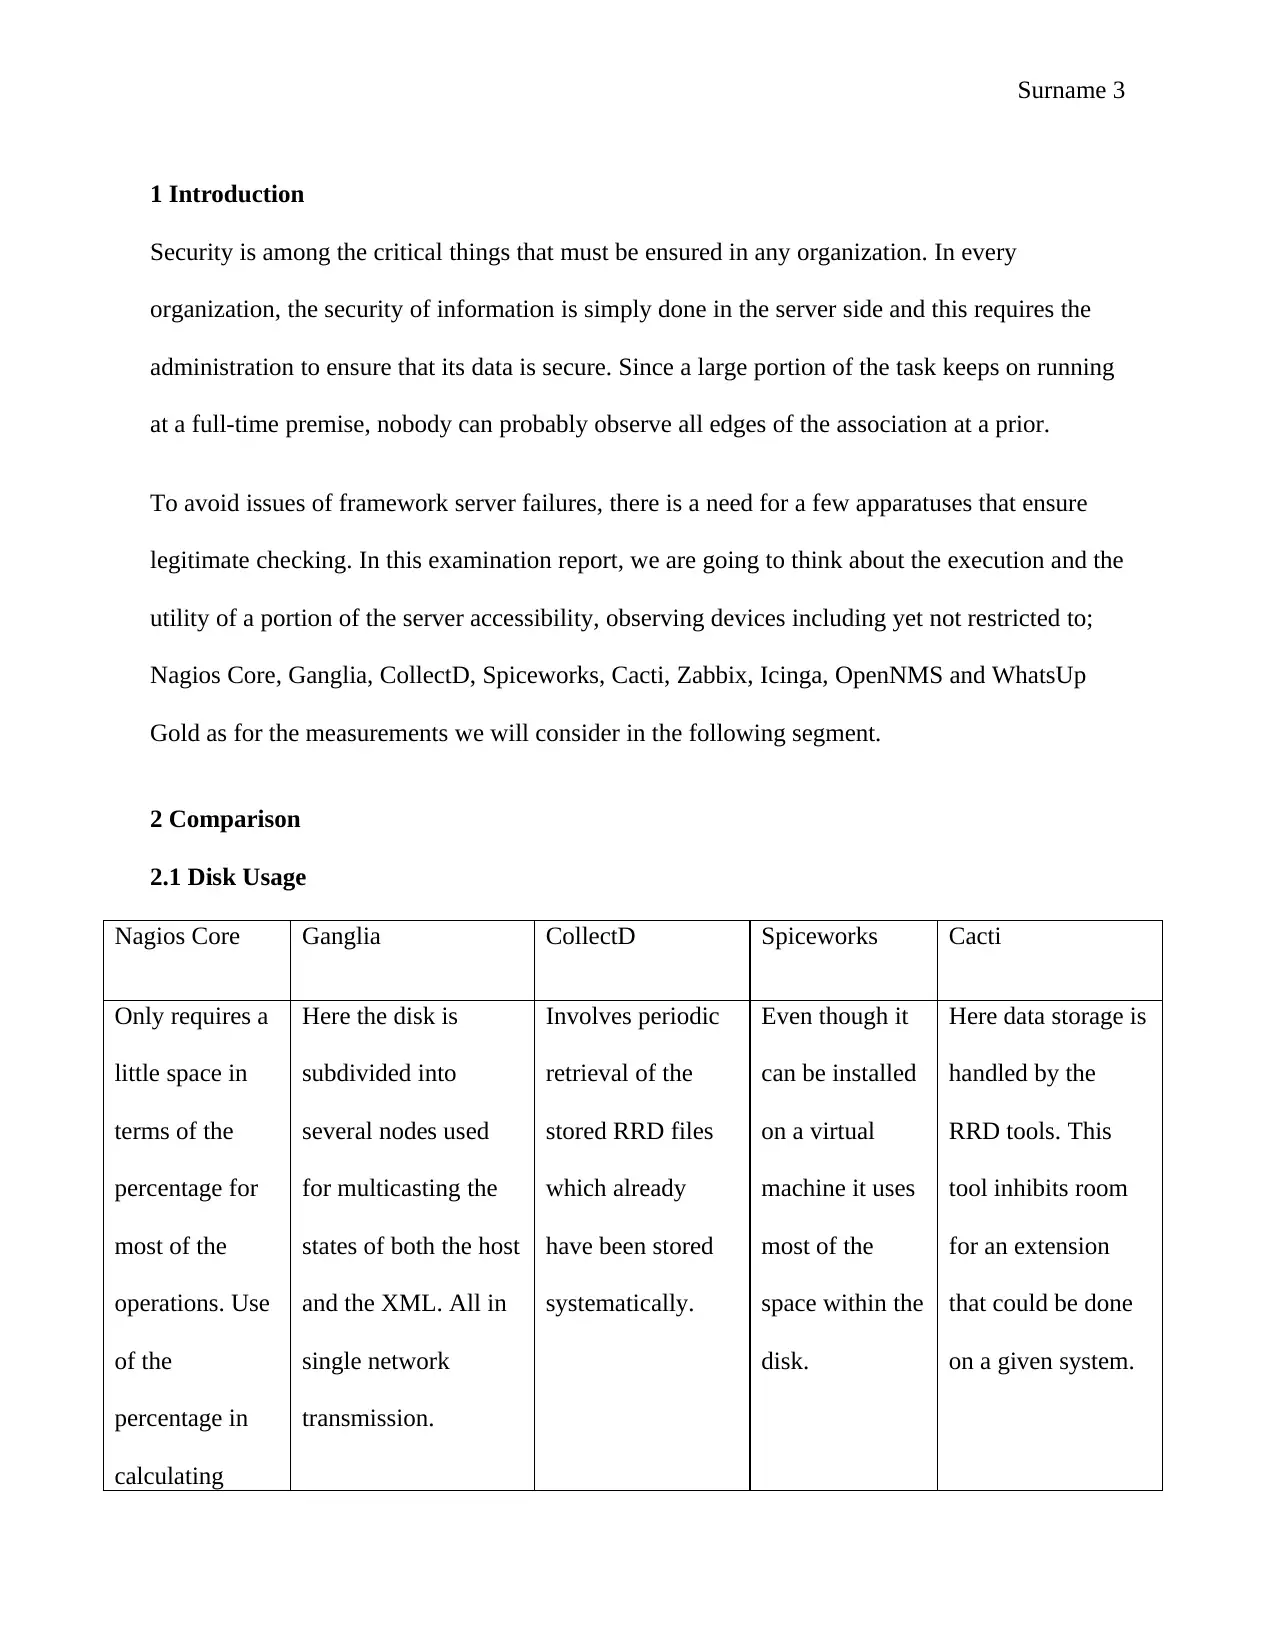
2.1 Disk Usage
Nagios Core Ganglia CollectD Spiceworks Cacti
Only requires a
little space in
terms of the
percentage for
most of the
operations. Use
of the
percentage in
calculating
Here the disk is
subdivided into
several nodes used
for multicasting the
states of both the host
and the XML. All in
single network
transmission.
Involves periodic
retrieval of the
stored RRD files
which already
have been stored
systematically.
Even though it
can be installed
on a virtual
machine it uses
most of the
space within the
disk.
Here data storage is
handled by the
RRD tools. This
tool inhibits room
for an extension
that could be done
on a given system.
⊘ This is a preview!⊘
Do you want full access?
Subscribe today to unlock all pages.

Trusted by 1+ million students worldwide
Surname 4
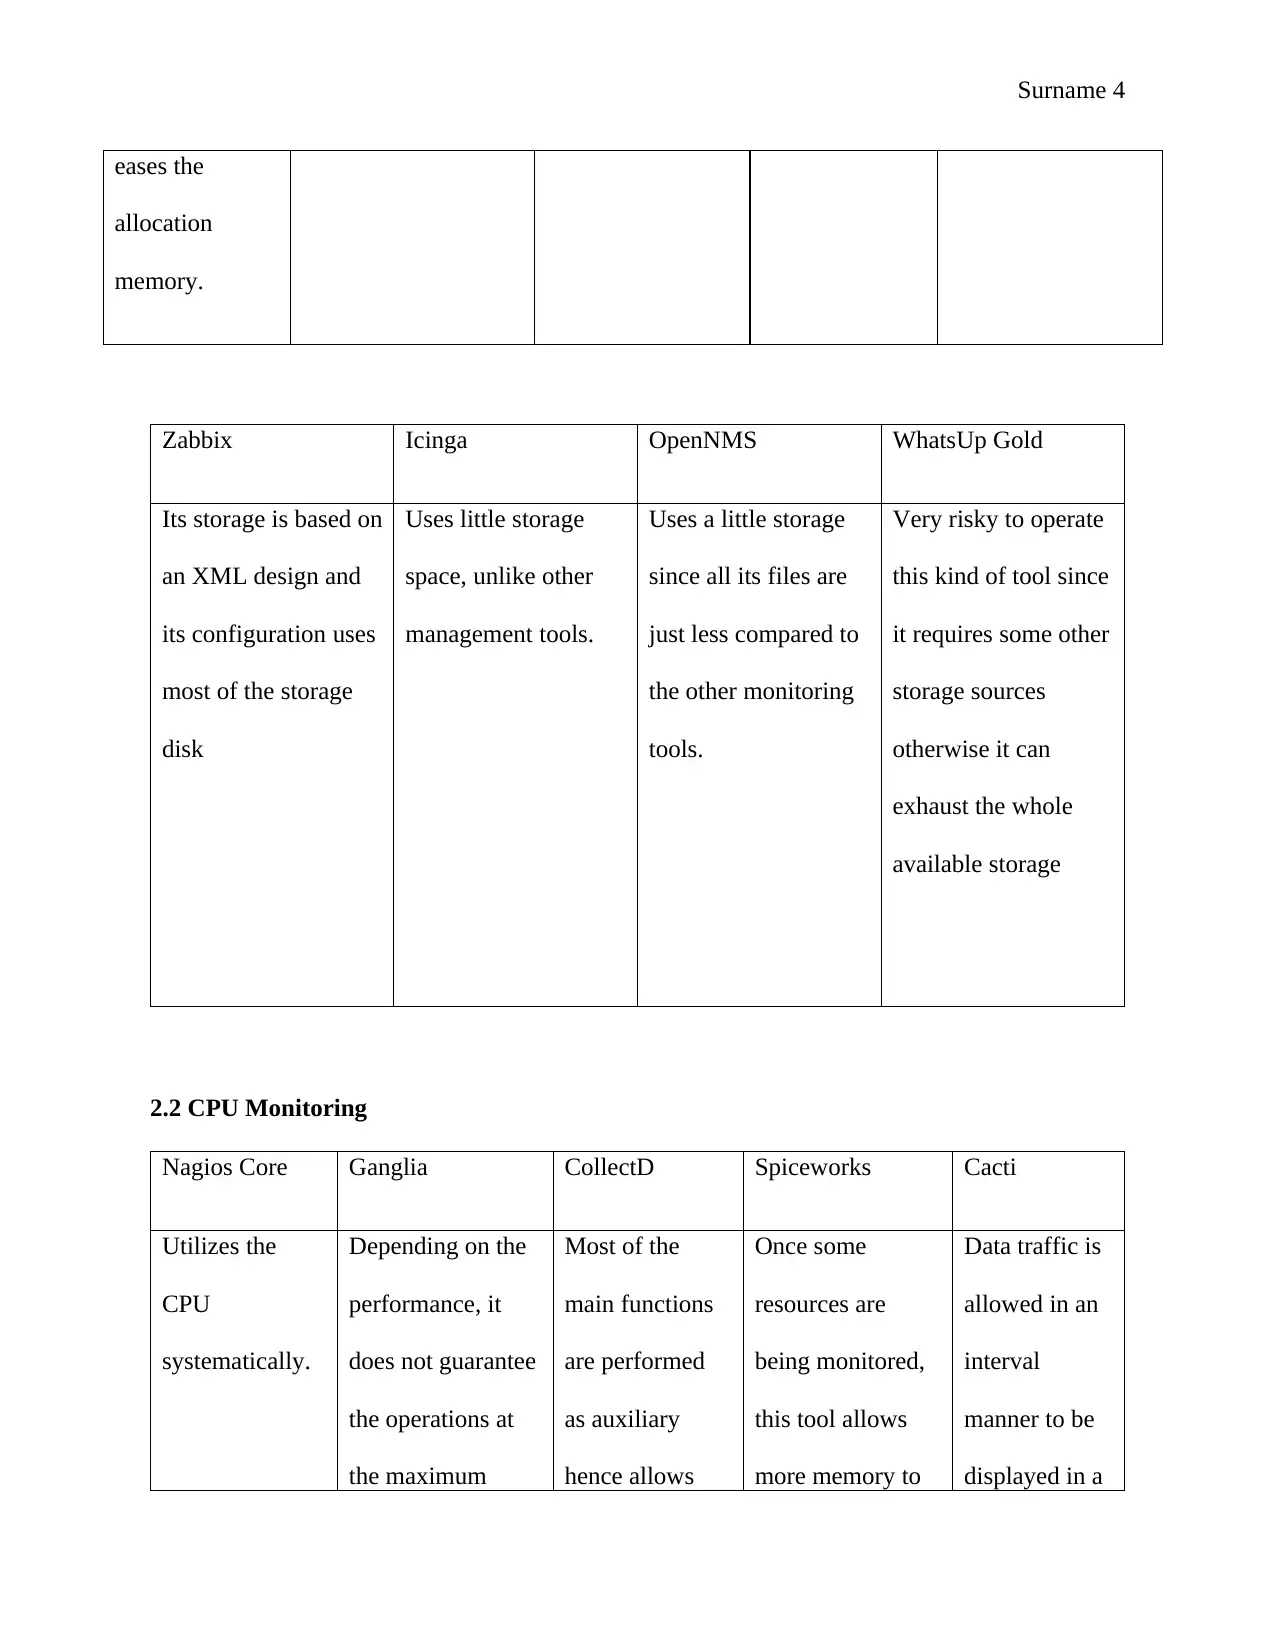
eases the
allocation
memory.
Zabbix Icinga OpenNMS WhatsUp Gold
Its storage is based on
an XML design and
its configuration uses
most of the storage
disk
Uses little storage
space, unlike other
management tools.
Uses a little storage
since all its files are
just less compared to
the other monitoring
tools.
Very risky to operate
this kind of tool since
it requires some other
storage sources
otherwise it can
exhaust the whole
available storage
2.2 CPU Monitoring
Nagios Core Ganglia CollectD Spiceworks Cacti
Utilizes the
CPU
systematically.
Depending on the
performance, it
does not guarantee
the operations at
the maximum
Most of the
main functions
are performed
as auxiliary
hence allows
Once some
resources are
being monitored,
this tool allows
more memory to
Data traffic is
allowed in an
interval
manner to be
displayed in a
Paraphrase This Document
Need a fresh take? Get an instant paraphrase of this document with our AI Paraphraser
Surname 5
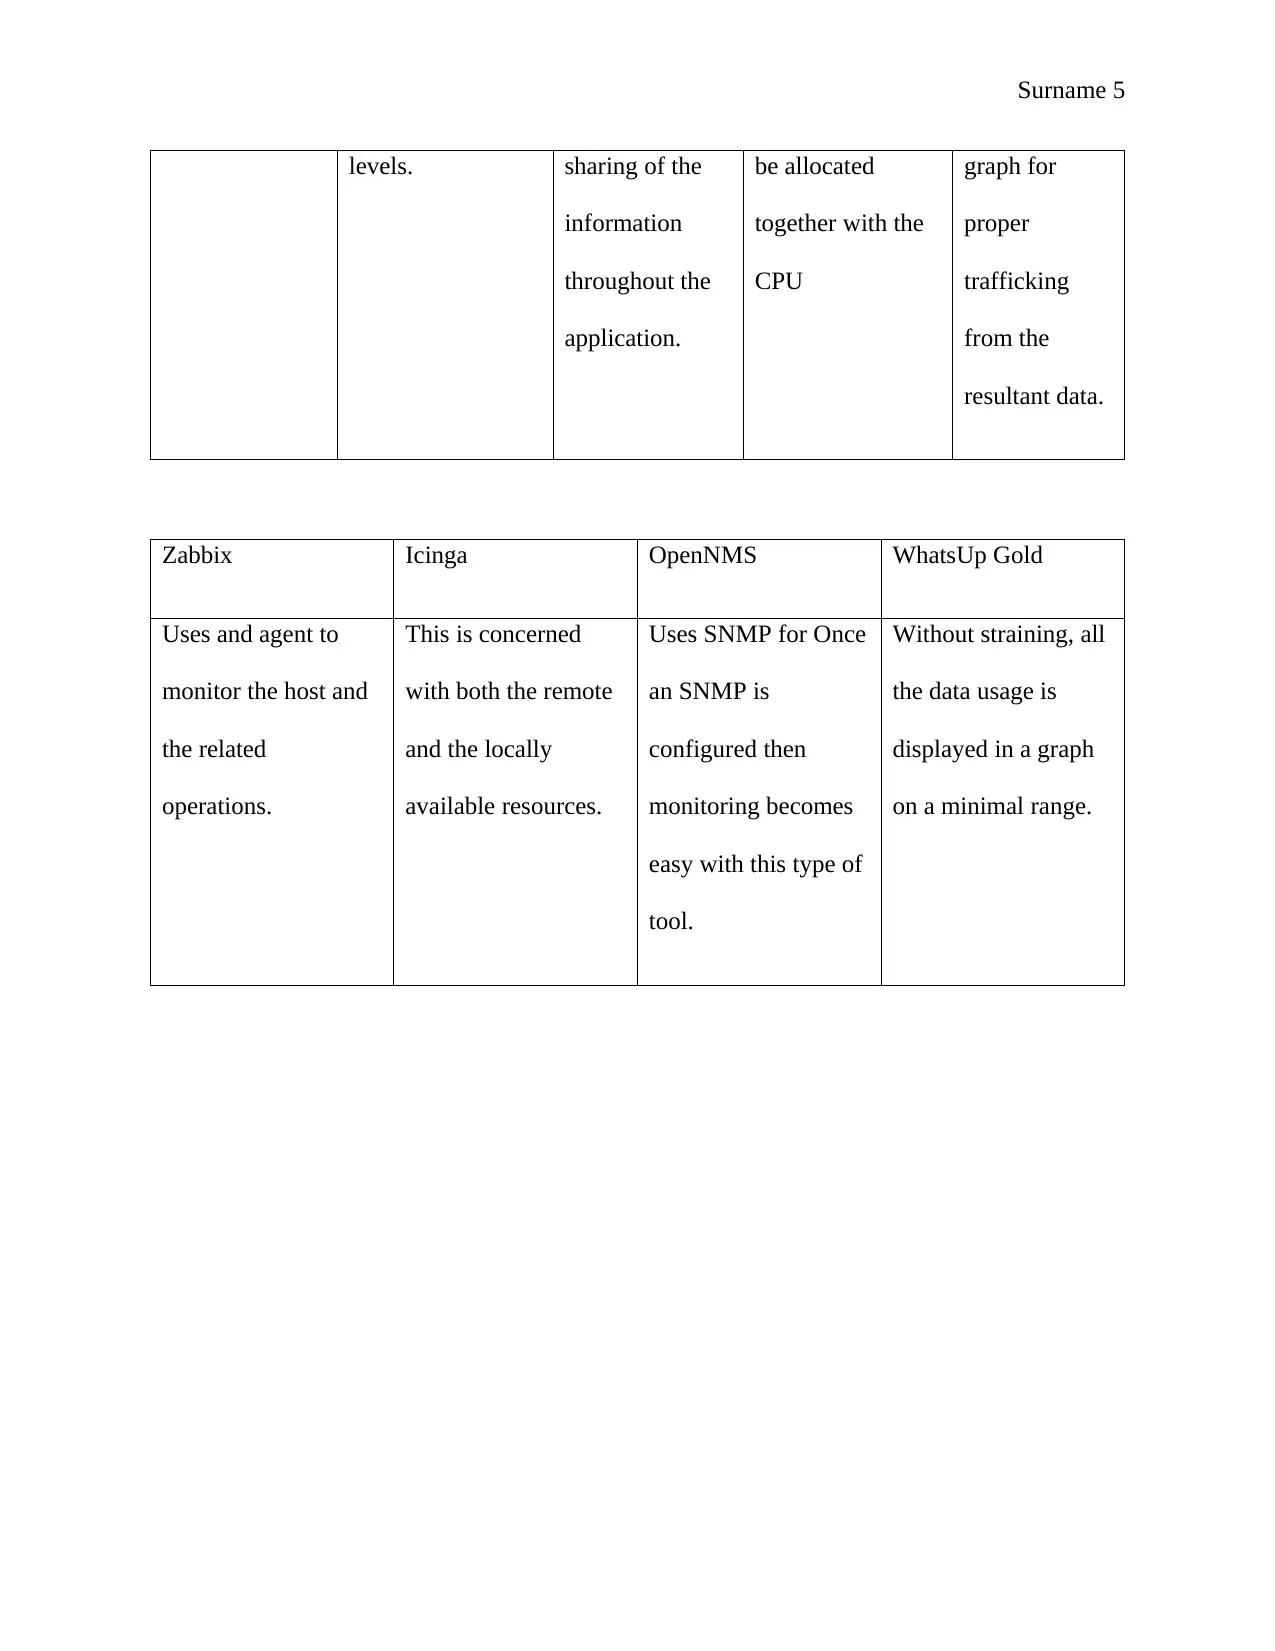
levels. sharing of the
information
throughout the
application.
be allocated
together with the
CPU
graph for
proper
trafficking
from the
resultant data.
Zabbix Icinga OpenNMS WhatsUp Gold
Uses and agent to
monitor the host and
the related
operations.
This is concerned
with both the remote
and the locally
available resources.
Uses SNMP for Once
an SNMP is
configured then
monitoring becomes
easy with this type of
tool.
Without straining, all
the data usage is
displayed in a graph
on a minimal range.
Surname 6
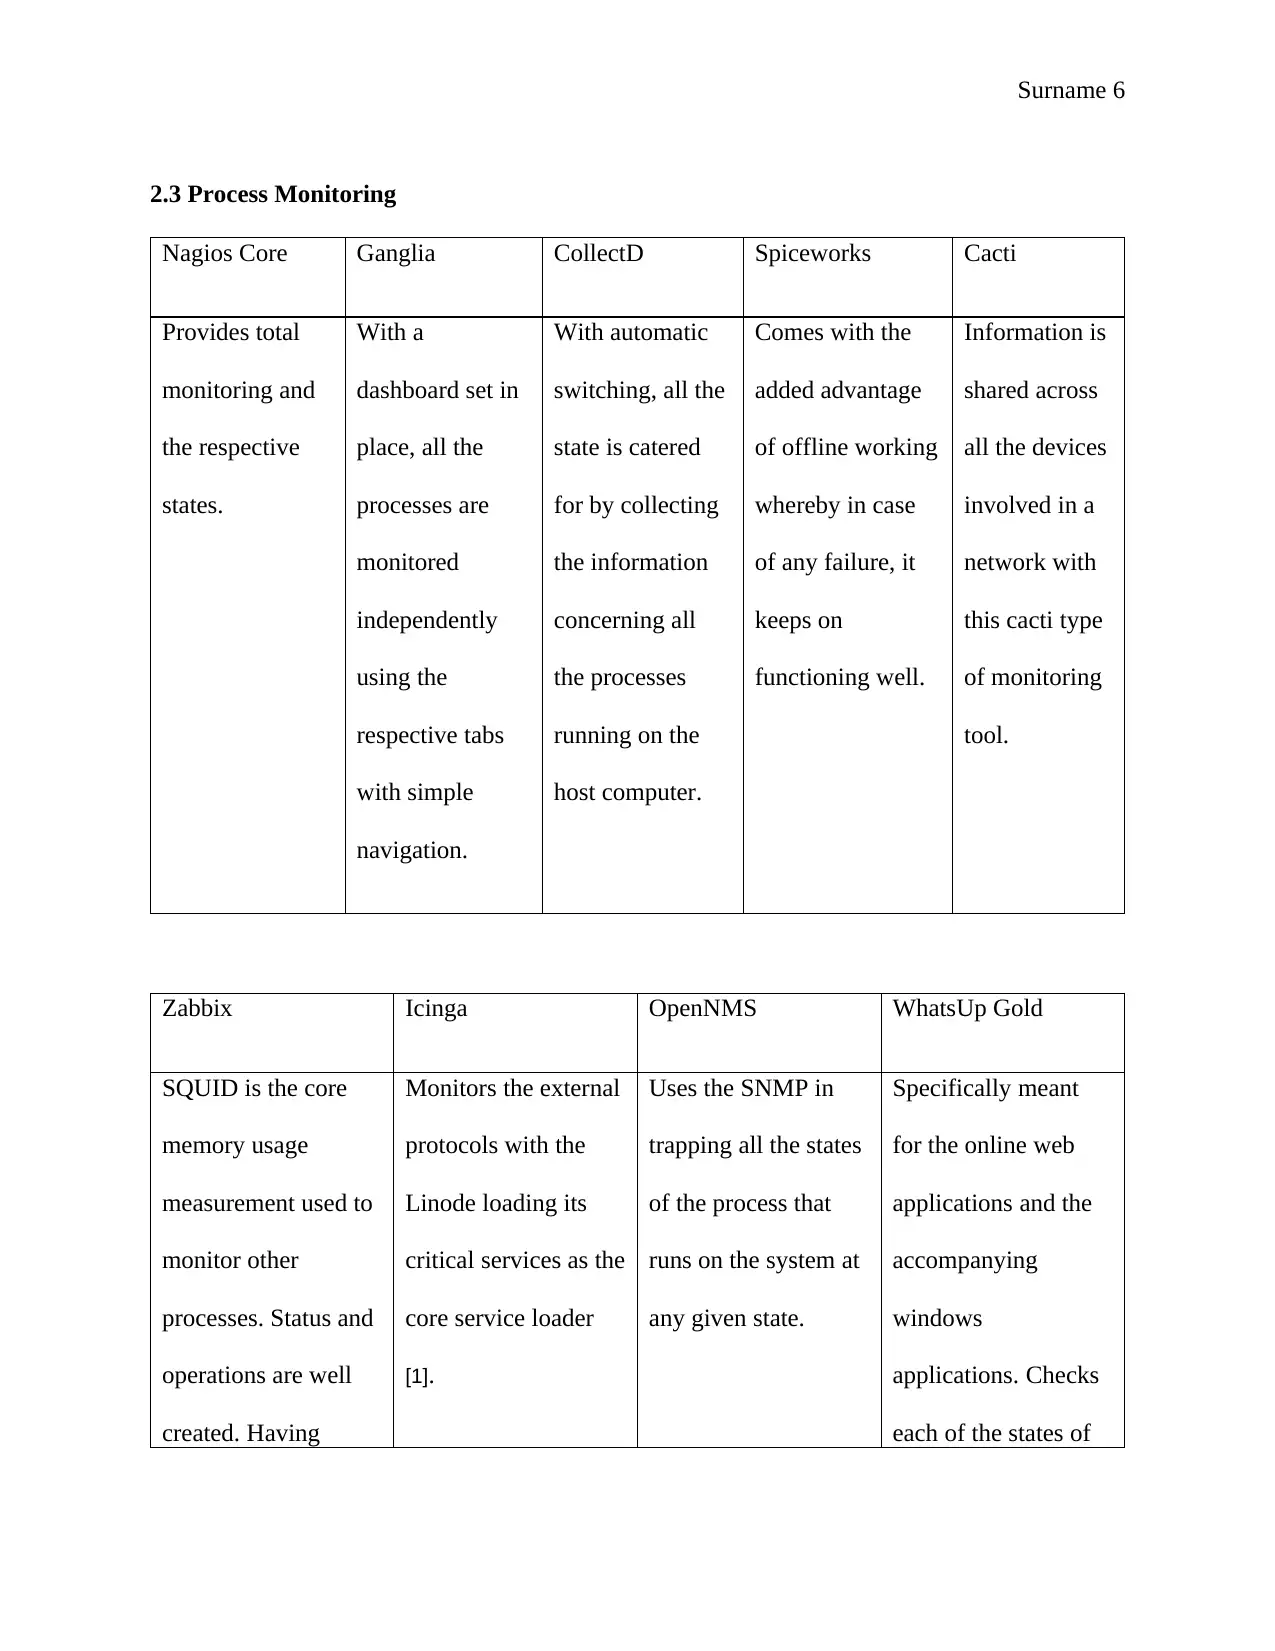
2.3 Process Monitoring
Nagios Core Ganglia CollectD Spiceworks Cacti
Provides total
monitoring and
the respective
states.
With a
dashboard set in
place, all the
processes are
monitored
independently
using the
respective tabs
with simple
navigation.
With automatic
switching, all the
state is catered
for by collecting
the information
concerning all
the processes
running on the
host computer.
Comes with the
added advantage
of offline working
whereby in case
of any failure, it
keeps on
functioning well.
Information is
shared across
all the devices
involved in a
network with
this cacti type
of monitoring
tool.
Zabbix Icinga OpenNMS WhatsUp Gold
SQUID is the core
memory usage
measurement used to
monitor other
processes. Status and
operations are well
created. Having
Monitors the external
protocols with the
Linode loading its
critical services as the
core service loader
[1].
Uses the SNMP in
trapping all the states
of the process that
runs on the system at
any given state.
Specifically meant
for the online web
applications and the
accompanying
windows
applications. Checks
each of the states of
⊘ This is a preview!⊘
Do you want full access?
Subscribe today to unlock all pages.

Trusted by 1+ million students worldwide

Surname 7
created an operation,
this tool uses the
SQUAD as a core
memory usage in
monitoring all other
related processes.
the stated operations.
2.4 Bandwidth Monitoring
Nagios Core Ganglia CollectD Spiceworks Cacti
With the
switches and
the routers set
in place, the
Nagios Core
measures the
bandwidth
and keeps its
operations
using the
SNMP [2].
Bandwidth
monitoring is done
via embedded
metrics to handle
both the local and
other remote
monitoring.
All the processing
traffic under the
devices is done via
an interface which
collects the related
information.
Performance is
historically
provided
through the
use of a
bandwidth
analyzer that is
incorporated
within the tool.
Devices are
stored in a box
where polling
is through the
SNMP that
provides the
used
bandwidth in a
graph mode.
Paraphrase This Document
Need a fresh take? Get an instant paraphrase of this document with our AI Paraphraser

Surname 8
Zabbix Icinga OpenNMS WhatsUp Gold
All the operations are
well analyzed then
allowed a robust
bandwidth from
where they are
monitored
Monitors all the
critical services using
the Linode to easily
monitor all the
internal and the
external protocols of
the systems and the
host.
This allows the users
to manage all the
operations by
creating an alert in
case an operation
exceeds 1GB...
Uses Cisco NBAR to
validate all the
operations as the
number of users
increases.
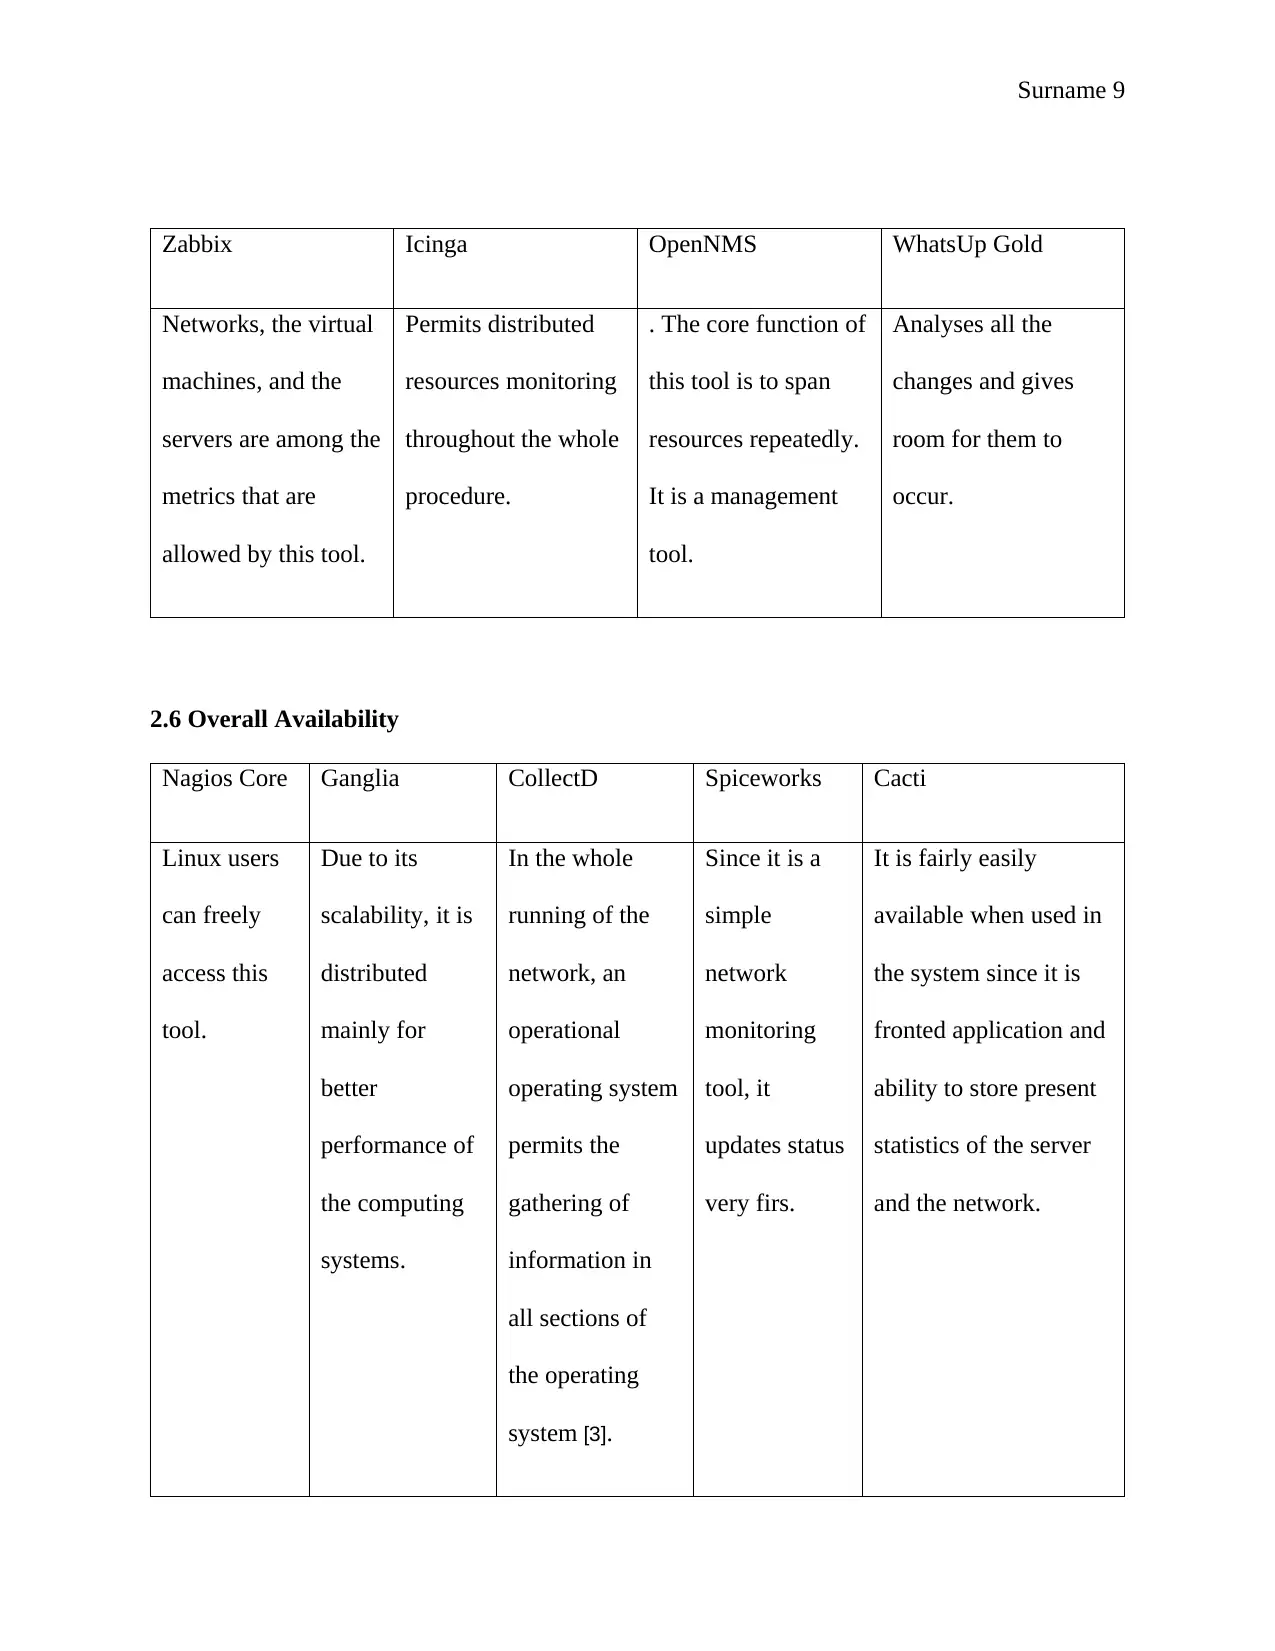
2.5 Resource Measuring
Nagios Core Ganglia CollectD Spiceworks Cacti
Apart from the
monitoring of
resources like
processor
loading and disc
usage, it also
provides
network
services.
It has the
capability of
measuring all
host resource
like the grid and
cluster
computing.
Keeps the
information in a
given period in
some entity
relationship
diagram files.
Spiceworks
identify and
rectify
problems that
come up in the
switches and
servers.
The RRD along
with all the
devices in use
measures Data
stored in MySQL.
Surname 9
Zabbix Icinga OpenNMS WhatsUp Gold
Networks, the virtual
machines, and the
servers are among the
metrics that are
allowed by this tool.
Permits distributed
resources monitoring
throughout the whole
procedure.
. The core function of
this tool is to span
resources repeatedly.
It is a management
tool.
Analyses all the
changes and gives
room for them to
occur.
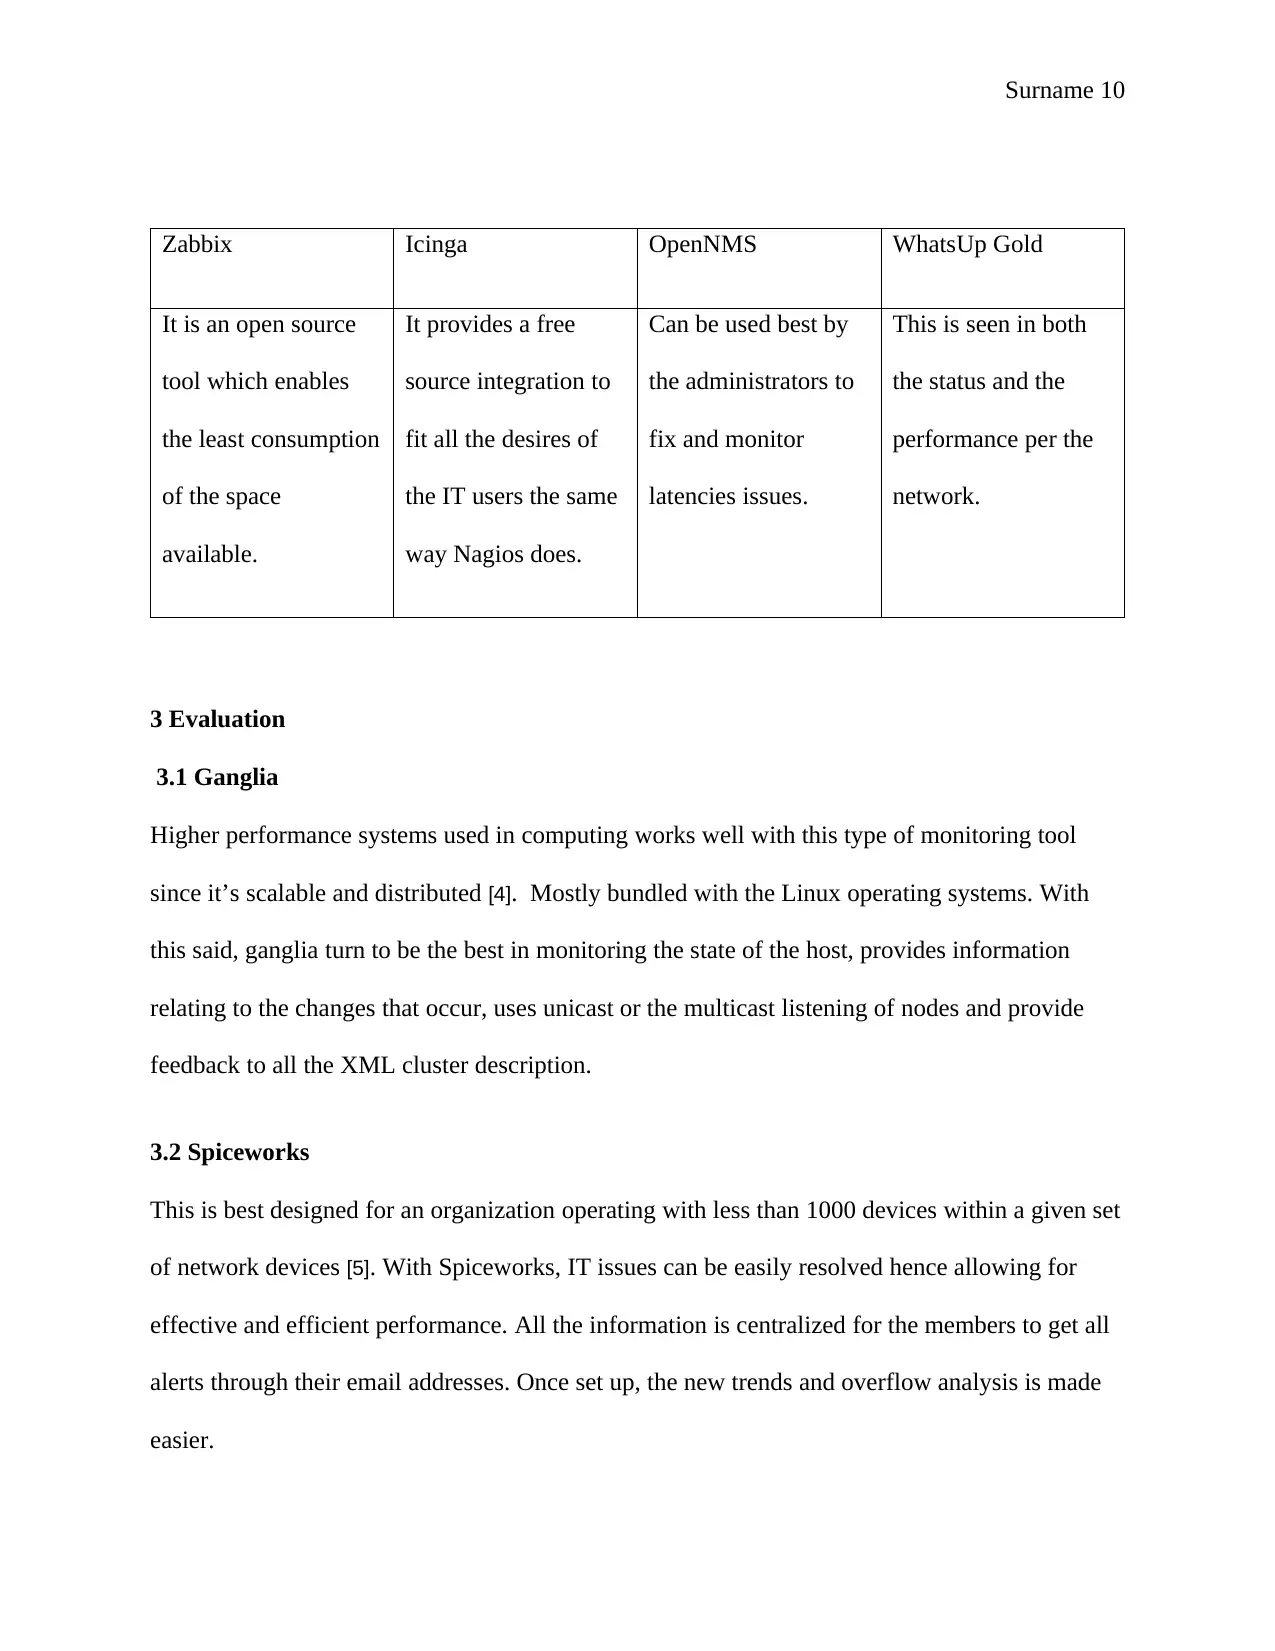
2.6 Overall Availability
Nagios Core Ganglia CollectD Spiceworks Cacti
Linux users
can freely
access this
tool.
Due to its
scalability, it is
distributed
mainly for
better
performance of
the computing
systems.
In the whole
running of the
network, an
operational
operating system
permits the
gathering of
information in
all sections of
the operating
system [3].
Since it is a
simple
network
monitoring
tool, it
updates status
very firs.
It is fairly easily
available when used in
the system since it is
fronted application and
ability to store present
statistics of the server
and the network.
⊘ This is a preview!⊘
Do you want full access?
Subscribe today to unlock all pages.

Trusted by 1+ million students worldwide
Surname 10
Zabbix Icinga OpenNMS WhatsUp Gold
It is an open source
tool which enables
the least consumption
of the space
available.
It provides a free
source integration to
fit all the desires of
the IT users the same
way Nagios does.
Can be used best by
the administrators to
fix and monitor
latencies issues.
This is seen in both
the status and the
performance per the
network.
3 Evaluation
3.1 Ganglia
Higher performance systems used in computing works well with this type of monitoring tool
since it’s scalable and distributed [4]. Mostly bundled with the Linux operating systems. With
this said, ganglia turn to be the best in monitoring the state of the host, provides information
relating to the changes that occur, uses unicast or the multicast listening of nodes and provide
feedback to all the XML cluster description.
3.2 Spiceworks
This is best designed for an organization operating with less than 1000 devices within a given set
of network devices [5]. With Spiceworks, IT issues can be easily resolved hence allowing for
effective and efficient performance. All the information is centralized for the members to get all
alerts through their email addresses. Once set up, the new trends and overflow analysis is made
easier.
Paraphrase This Document
Need a fresh take? Get an instant paraphrase of this document with our AI Paraphraser
Surname 11
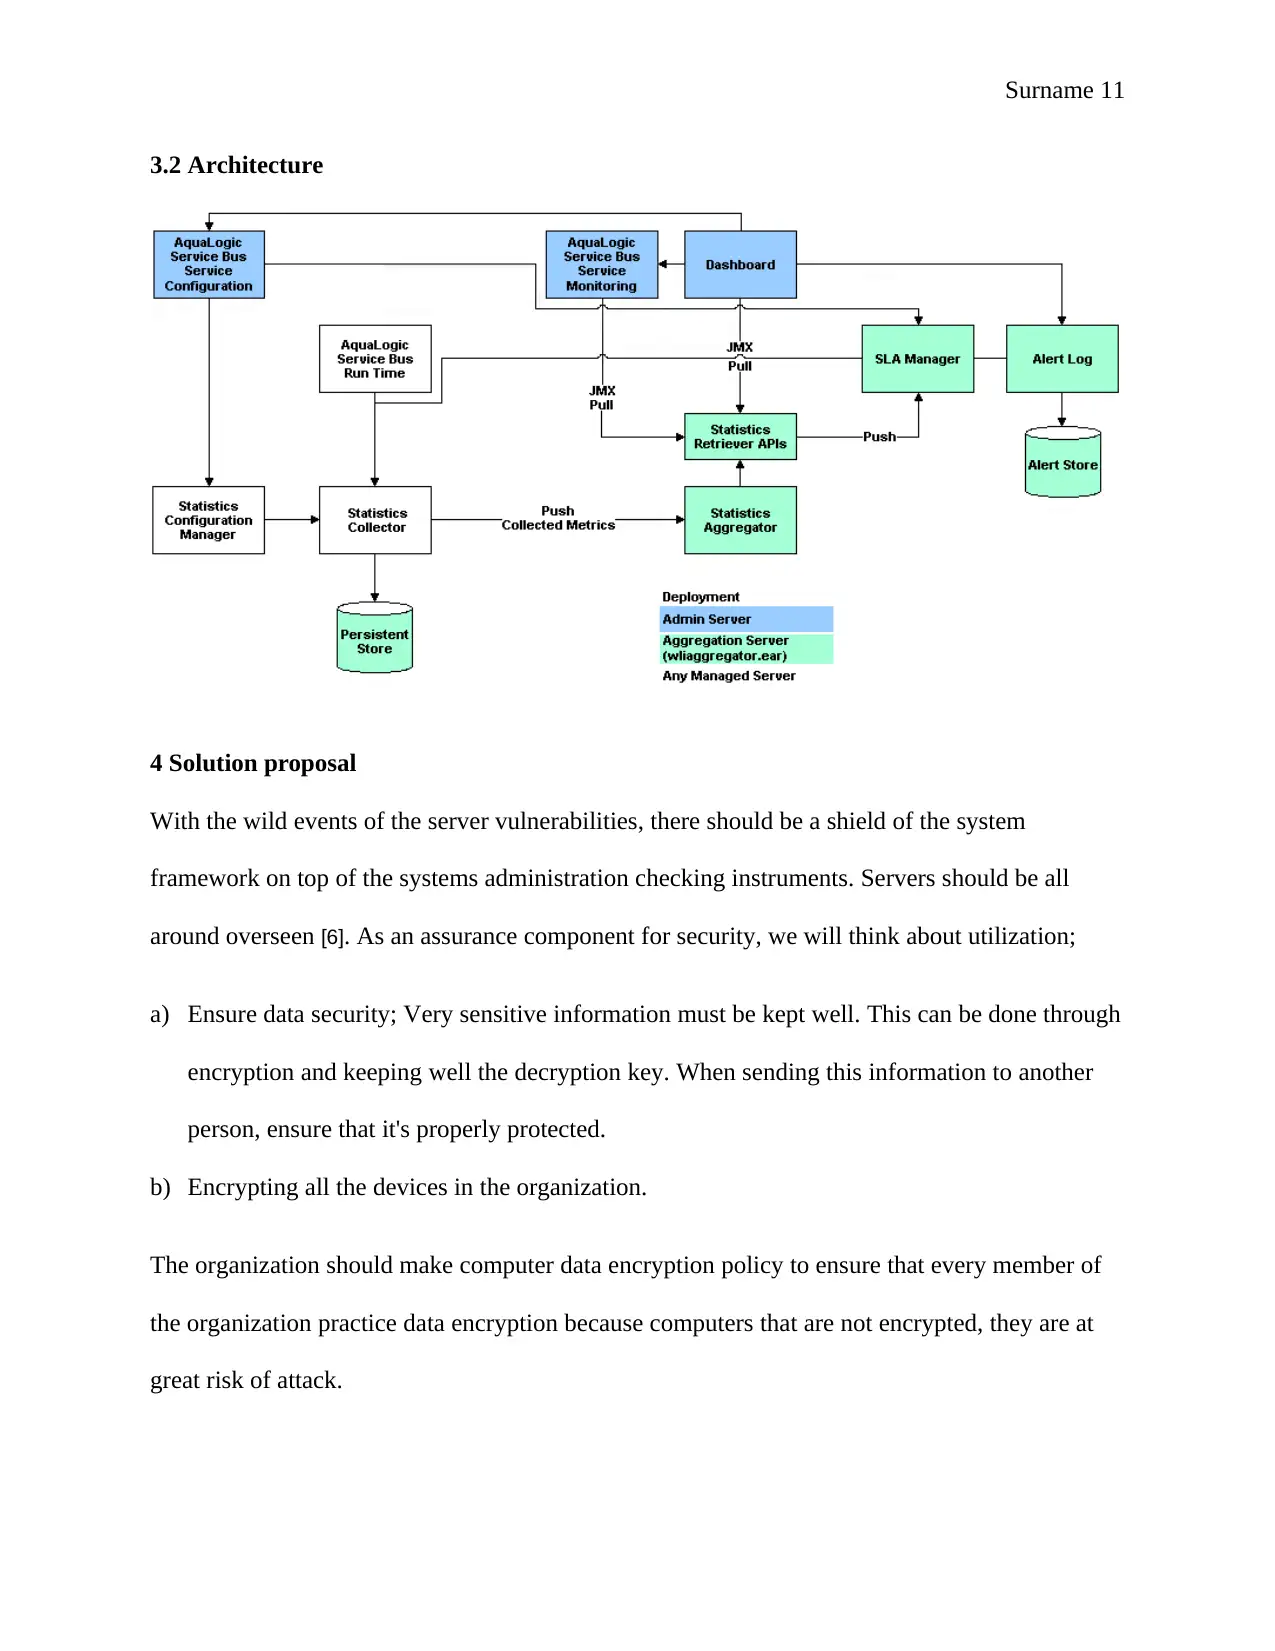
3.2 Architecture
4 Solution proposal
With the wild events of the server vulnerabilities, there should be a shield of the system
framework on top of the systems administration checking instruments. Servers should be all
around overseen [6]. As an assurance component for security, we will think about utilization;
a) Ensure data security; Very sensitive information must be kept well. This can be done through
encryption and keeping well the decryption key. When sending this information to another
person, ensure that it's properly protected.
b) Encrypting all the devices in the organization.
The organization should make computer data encryption policy to ensure that every member of
the organization practice data encryption because computers that are not encrypted, they are at
great risk of attack.
Surname 12
5 Failure Prediction Impact
With the expansion in systems administration tasks, Preventive measures must be put in place in
the organization [7]. This will include:
a) Takes into the record the nature of the general execution. With all the administration setups,
the quality is considered to ensure future development of the foundation.
b) One should be additionally ready to anticipate for the examination and utilizing the
investigation about the assailants.
6 Conclusion
From the above information, we can reason that to have the best execution in an association, we
need checking instruments off the top dimension for fast caution. In this report we've analyzed
the different devices that can be used for server security, even though there must be ways out for
a distinction, having somewhere around will ensure security in the entire organization.
⊘ This is a preview!⊘
Do you want full access?
Subscribe today to unlock all pages.

Trusted by 1+ million students worldwide
1 out of 13
Related Documents
Your All-in-One AI-Powered Toolkit for Academic Success.
+13062052269
info@desklib.com
Available 24*7 on WhatsApp / Email
![[object Object]](/_next/static/media/star-bottom.7253800d.svg)
Unlock your academic potential
Copyright © 2020–2026 A2Z Services. All Rights Reserved. Developed and managed by ZUCOL.


