Detailed Analysis: T-Tests, Hypothesis, and Data Visualisation Report
VerifiedAdded on 2023/06/18
|11
|2653
|196
Report
AI Summary
This report provides a detailed analysis of T-tests and hypothesis testing within the context of data visualisation. It explains the meaning of a T-test and defines hypothesis development, including null and alternative hypotheses. The report includes testable hypotheses, examines the testing of hypotheses to a significance level, and discusses the presence and effect of outliers in the data. Features of the data that appear during investigation are outlined, along with a discussion of the experimental setup and control factors. The analysis also touches upon the infection rate of Covid-19 among different ethnic groups in the UK, specifically comparing white people and BAME individuals. The report concludes with a summary of the findings and their implications.
Analysis And Visualisation
Paraphrase This Document
Need a fresh take? Get an instant paraphrase of this document with our AI Paraphraser
TABLE OF CONTENTS
INTRODUCTION...........................................................................................................................3
MAIN BODY..................................................................................................................................3
Meaning of t-Test........................................................................................................................3
Definition of hypothesis and how develop with null and alternative hypothesis........................4
Set of testable hypotheses (null and alternative).........................................................................4
The testing of hypotheses to significance level...........................................................................5
Presence of any outliers in the data and the effect on outcome...................................................7
Features of the data that appear during investigation..................................................................7
Stated experimental set-up and control these factors.................................................................8
CONCLUSION................................................................................................................................9
REFERENCES................................................................................................................................1
INTRODUCTION
This report will explain about the T-test and hypothesis along with this how this could
help them for developing the null and alternative hypothesis. Moreover, appropriate testable with
having proper data and testing about the data that have been provided. Furthermore, other
features of the data and during investigation of the give things. Along with this also keeping
throughout the experimental set-up together for which the ideas how they are being deal. While
this also examined about those hypothesis in details about it has been identified that the infection
rate of Covid –19 is varied between white people and BAME in the UK
MAIN BODY
Meaning of t-Test
T-test meaning the this is used for statistical data which help in comparing the means of
two groups. This could be often used for the hypothesis testing for which the determining
whether having the process and actually keeping more focus towards the population interested.
This could also help researcher for knowing about various terms and condition for which the
sources can be developed (Kalaignanam and et.al., 2021). Along with this also make sure for
having their effective roles and regulation about many times and different species. The different
between two groups are very different from one another. Statistical data which used to determine
about their significant difference between the means of two group which could make their more
working process and make sure about their things which could having their effective concepts.
T-test help the research about those things which could keep the data set for working with
many activities and keeping more growth about the t-test hypothesis. This could help in terms
with tool, which could allow the use testing assumption applicable to make or reach out the
population. T-distribution values, and keeping the degree about those freedom for determining
about statistical significant and make sure for keeping their tools for working (Schnuerch and
Erdfelder, 2020). This could also keep them for having many thing and make their relationship
conduct about the three test or their various means. A sample by assuming from each other two
sets and established the problem statement while by assuming many tools. This could calculate
about the compared against the making standard values.
⊘ This is a preview!⊘
Do you want full access?
Subscribe today to unlock all pages.
Trusted by 1+ million students worldwide
Definition of hypothesis and how develop with null and alternative hypothesis.
Hypothesis is being proposed about the explanation and make their scientific about the
various methods requires about the generally problem. This could qualify as a logical theory.
Testability implies that should have the choice gather identifiable information in deductively
thorough style survey if upholds supposition. Indicating the exploration speculation perhaps the
main strides in arrange logical quantitative examination study (Nadanyiova and Das, 2020). A
quantitative scientist classically expresses deduced statement regarding the consequences of
examination in at least one exploration theories prior to directing investigation, on grounds that
plan of exploration study and arranged examination configuration frequently is controlled by the
expressed speculations. Along these lines, one of upsides expressing examination theory that
require specialist to completely think.
The actual concepts about the hypothesis can be null and alternative hypothesis. The null
means statements about the no difference between variation. The alternative hypothesis about
there is relationship between variation. This could also help researcher about those things which
could keep the variation about the dataset (Le and Sarkodie, 2020). In such kind of things this
could also keep them for variation in which the people and that could make sure for having more
completion process. Determined about the equal depends on them variance and that could led
with many more terms and alternative hypothesis means more about determination sources and
could make their decision over the dataset.
Set of testable hypotheses (null and alternative)
This investigation turns concentration towards anomalies and leisure approach empower
control of distribution in sequence since it is produced through program rather than gathered. In
this manner anomaly can be added to tests drawn from known typical broadcasting, which
makes it simpler to catch the impact of anomalies without openness with respect to the
dissemination of the basic populace. Regardless of marvellous measure of circulated meanings of
how an anomaly is branded, experts are yet keen approaches to equitably recognize if a
perception (Mertens and Recker, 2020). Specialists can be confront with both outrageous
exceptions and anomalies that are possibly past the wall. Specialists might feel open overseeing
outrageous exceptions, where impact on values are known to important, when contrasted with
anomalies of shifting greatness where the effect on the after effects of examination is more
cloudy. This investigation will add to knowledge of how diverse types anomalies collision. The
Paraphrase This Document
Need a fresh take? Get an instant paraphrase of this document with our AI Paraphraser
main amount is the amount of squares, and the other is levels opportunity related with quantity
of squares. The levels of opportunity is deciphered as number of sovereign snippets of data that
adds to measurement, for this situation, the fluctuation around the mean. While having such
things this could also led them for keeping with various determinants about the opportunities
(Lim and Mandrinos, 2020). This could also making their working process and make sure for
having their alternative hypothesis for which the variation that can take place. Hypothesis can
work with having their effective process and make sure for those led with many more concepts is
no groups means the sample about the calculation about the samples.
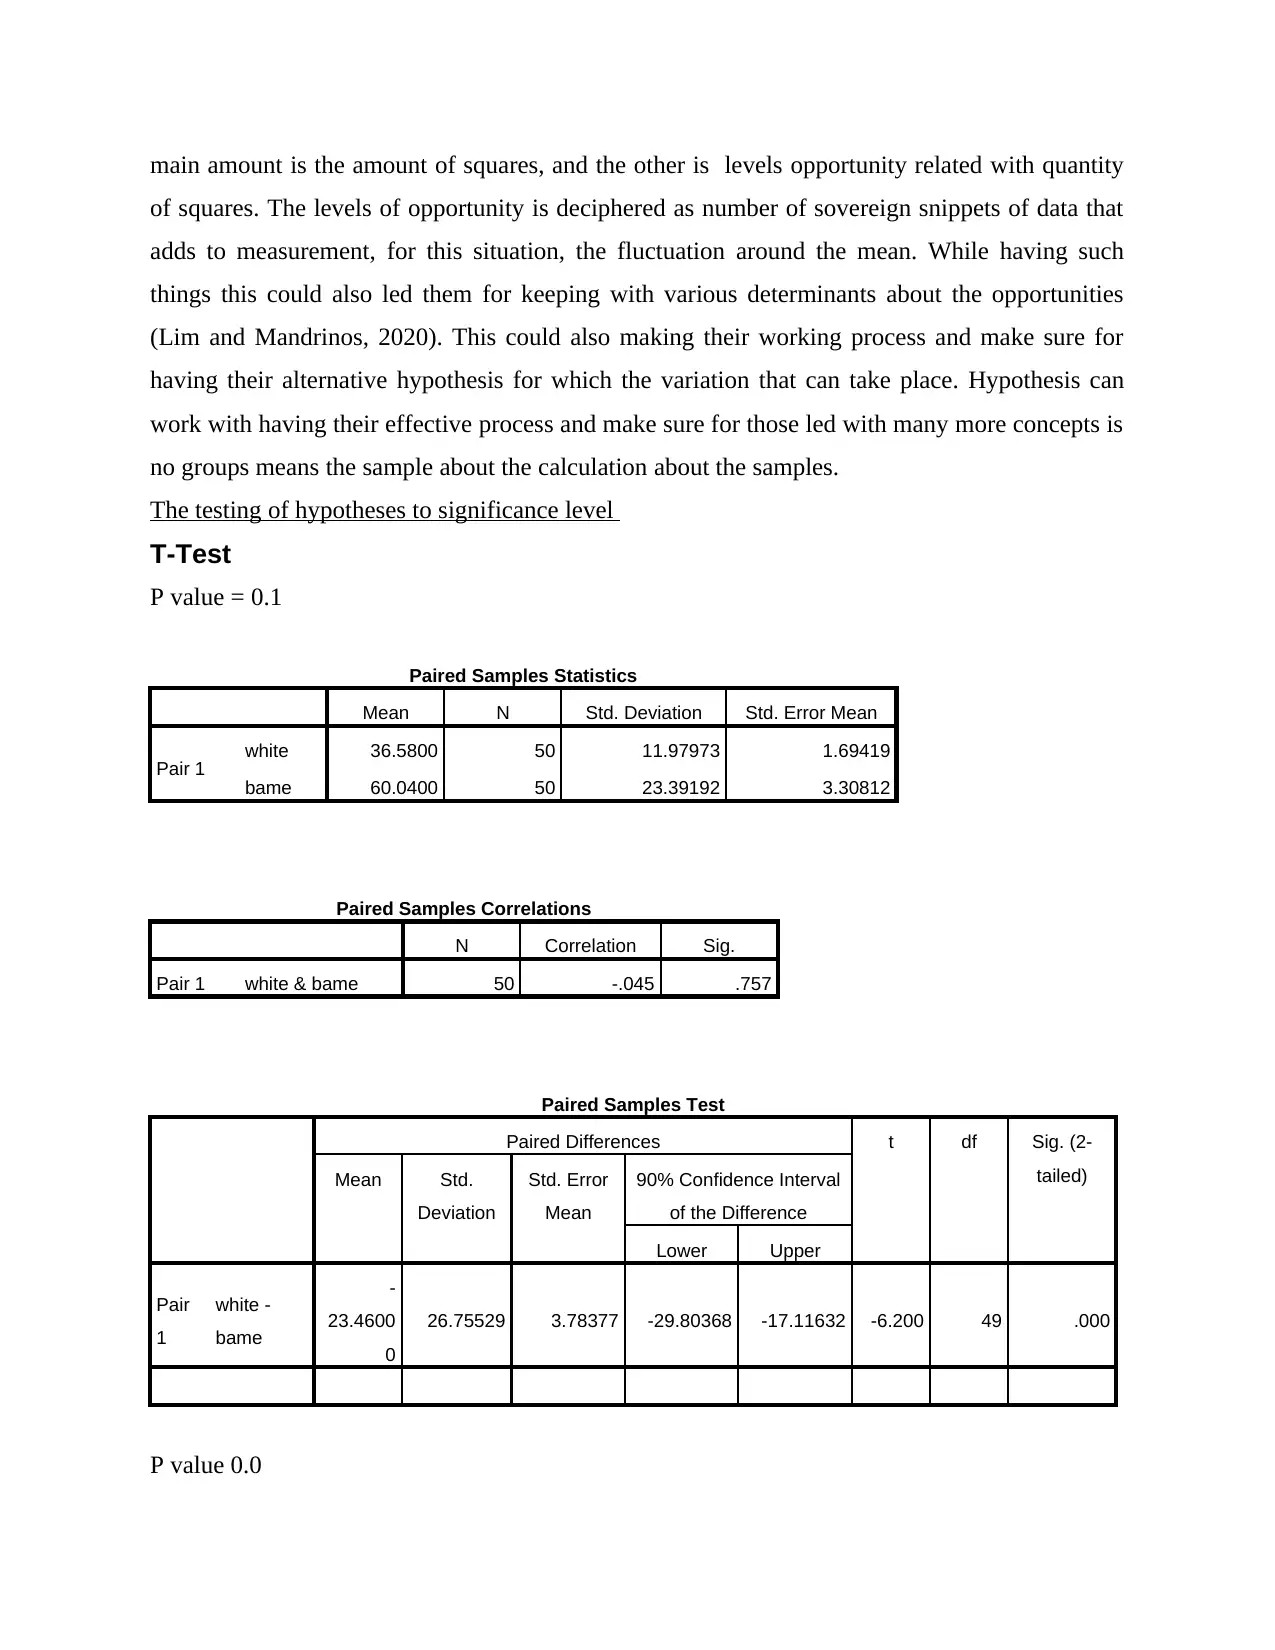
The testing of hypotheses to significance level
T-Test
P value = 0.1
Paired Samples Statistics
Mean N Std. Deviation Std. Error Mean
Pair 1 white 36.5800 50 11.97973 1.69419
bame 60.0400 50 23.39192 3.30812
Paired Samples Correlations
N Correlation Sig.
Pair 1 white & bame 50 -.045 .757
Paired Samples Test
Paired Differences t df Sig. (2-
tailed)Mean Std.
Deviation
Std. Error
Mean
90% Confidence Interval
of the Difference
Lower Upper
Pair
1
white -
bame
-
23.4600
0
26.75529 3.78377 -29.80368 -17.11632 -6.200 49 .000
P value 0.0
of squares. The levels of opportunity is deciphered as number of sovereign snippets of data that
adds to measurement, for this situation, the fluctuation around the mean. While having such
things this could also led them for keeping with various determinants about the opportunities
(Lim and Mandrinos, 2020). This could also making their working process and make sure for
having their alternative hypothesis for which the variation that can take place. Hypothesis can
work with having their effective process and make sure for those led with many more concepts is
no groups means the sample about the calculation about the samples.
The testing of hypotheses to significance level
T-Test
P value = 0.1
Paired Samples Statistics
Mean N Std. Deviation Std. Error Mean
Pair 1 white 36.5800 50 11.97973 1.69419
bame 60.0400 50 23.39192 3.30812
Paired Samples Correlations
N Correlation Sig.
Pair 1 white & bame 50 -.045 .757
Paired Samples Test
Paired Differences t df Sig. (2-
tailed)Mean Std.
Deviation
Std. Error
Mean
90% Confidence Interval
of the Difference
Lower Upper
Pair
1
white -
bame
-
23.4600
0
26.75529 3.78377 -29.80368 -17.11632 -6.200 49 .000
P value 0.0
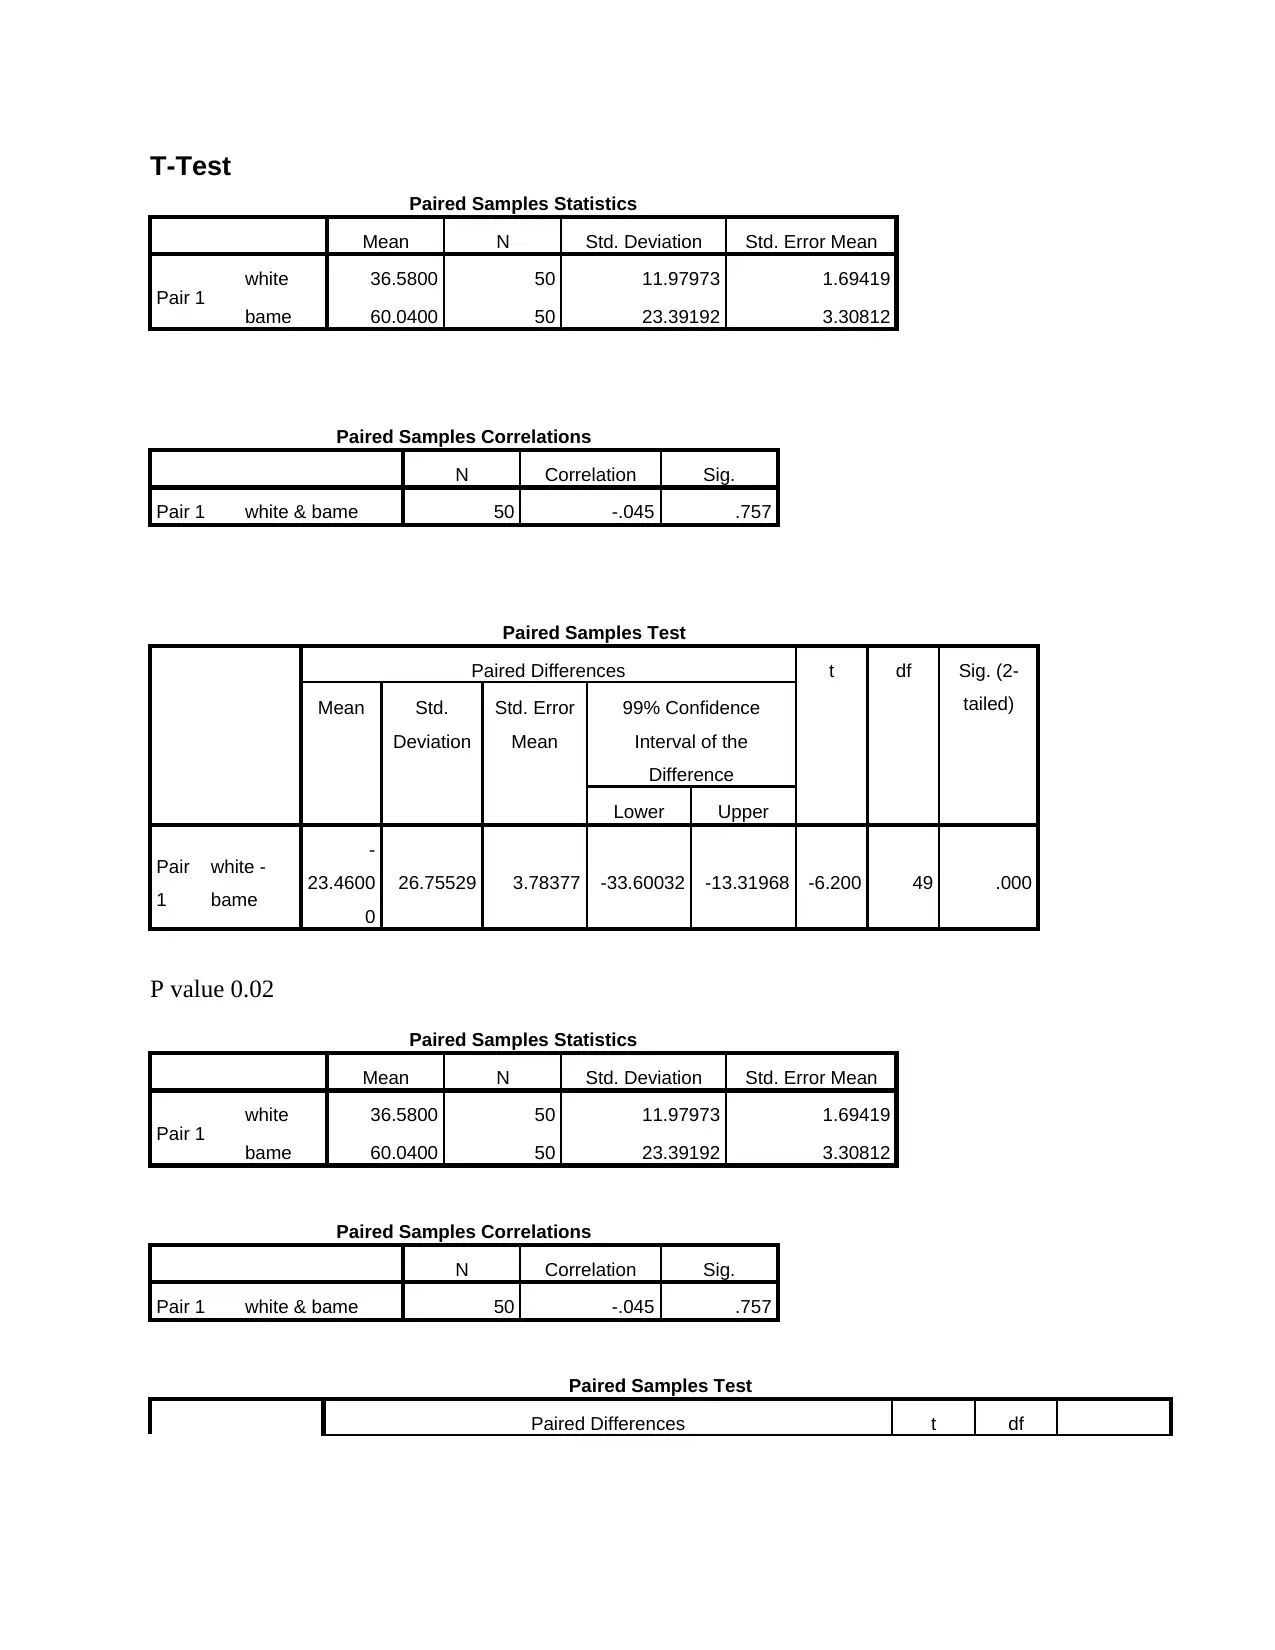
T-Test
Paired Samples Statistics
Mean N Std. Deviation Std. Error Mean
Pair 1 white 36.5800 50 11.97973 1.69419
bame 60.0400 50 23.39192 3.30812
Paired Samples Correlations
N Correlation Sig.
Pair 1 white & bame 50 -.045 .757
Paired Samples Test
Paired Differences t df Sig. (2-
tailed)Mean Std.
Deviation
Std. Error
Mean
99% Confidence
Interval of the
Difference
Lower Upper
Pair
1
white -
bame
-
23.4600
0
26.75529 3.78377 -33.60032 -13.31968 -6.200 49 .000
P value 0.02
Paired Samples Statistics
Mean N Std. Deviation Std. Error Mean
Pair 1 white 36.5800 50 11.97973 1.69419
bame 60.0400 50 23.39192 3.30812
Paired Samples Correlations
N Correlation Sig.
Pair 1 white & bame 50 -.045 .757
Paired Samples Test
Paired Differences t df
Paired Samples Statistics
Mean N Std. Deviation Std. Error Mean
Pair 1 white 36.5800 50 11.97973 1.69419
bame 60.0400 50 23.39192 3.30812
Paired Samples Correlations
N Correlation Sig.
Pair 1 white & bame 50 -.045 .757
Paired Samples Test
Paired Differences t df Sig. (2-
tailed)Mean Std.
Deviation
Std. Error
Mean
99% Confidence
Interval of the
Difference
Lower Upper
Pair
1
white -
bame
-
23.4600
0
26.75529 3.78377 -33.60032 -13.31968 -6.200 49 .000
P value 0.02
Paired Samples Statistics
Mean N Std. Deviation Std. Error Mean
Pair 1 white 36.5800 50 11.97973 1.69419
bame 60.0400 50 23.39192 3.30812
Paired Samples Correlations
N Correlation Sig.
Pair 1 white & bame 50 -.045 .757
Paired Samples Test
Paired Differences t df
⊘ This is a preview!⊘
Do you want full access?
Subscribe today to unlock all pages.
Trusted by 1+ million students worldwide
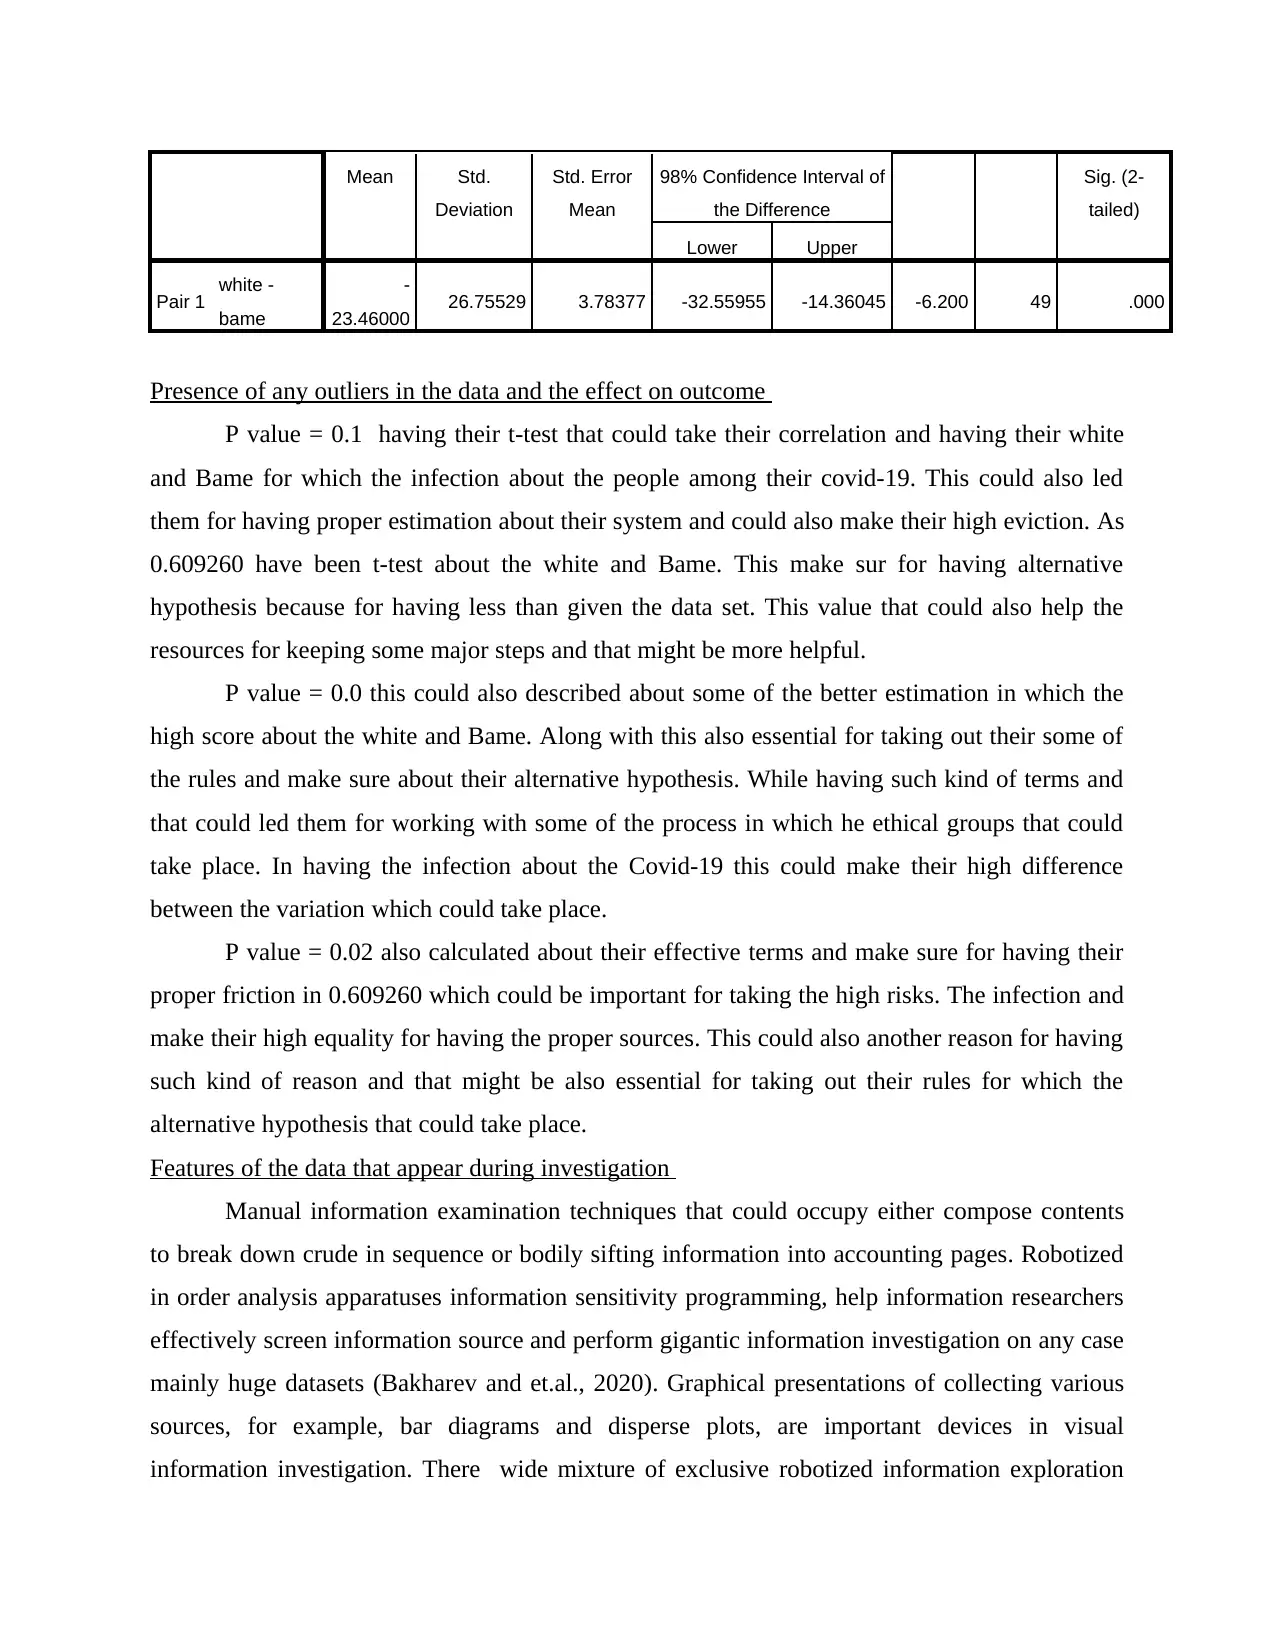
Sig. (2-
tailed)
Mean Std.
Deviation
Std. Error
Mean
98% Confidence Interval of
the Difference
Lower Upper
Pair 1 white -
bame
-
23.46000 26.75529 3.78377 -32.55955 -14.36045 -6.200 49 .000
Presence of any outliers in the data and the effect on outcome
P value = 0.1 having their t-test that could take their correlation and having their white
and Bame for which the infection about the people among their covid-19. This could also led
them for having proper estimation about their system and could also make their high eviction. As
0.609260 have been t-test about the white and Bame. This make sur for having alternative
hypothesis because for having less than given the data set. This value that could also help the
resources for keeping some major steps and that might be more helpful.
P value = 0.0 this could also described about some of the better estimation in which the
high score about the white and Bame. Along with this also essential for taking out their some of
the rules and make sure about their alternative hypothesis. While having such kind of terms and
that could led them for working with some of the process in which he ethical groups that could
take place. In having the infection about the Covid-19 this could make their high difference
between the variation which could take place.
P value = 0.02 also calculated about their effective terms and make sure for having their
proper friction in 0.609260 which could be important for taking the high risks. The infection and
make their high equality for having the proper sources. This could also another reason for having
such kind of reason and that might be also essential for taking out their rules for which the
alternative hypothesis that could take place.
Features of the data that appear during investigation
Manual information examination techniques that could occupy either compose contents
to break down crude in sequence or bodily sifting information into accounting pages. Robotized
in order analysis apparatuses information sensitivity programming, help information researchers
effectively screen information source and perform gigantic information investigation on any case
mainly huge datasets (Bakharev and et.al., 2020). Graphical presentations of collecting various
sources, for example, bar diagrams and disperse plots, are important devices in visual
information investigation. There wide mixture of exclusive robotized information exploration
Paraphrase This Document
Need a fresh take? Get an instant paraphrase of this document with our AI Paraphraser
arrangements, including business insight apparatuses, information perception programming, in
rank planning programming sellers, and correlation stages. There are likewise open source about
the various devices that incorporate relapse abilities and demonstration highlights, which can
assist organization with coordinating different information sources empower nearer information
investigation. Most information examination indoctrination incorporates in a row representation
devices. A Machine Learning project great as establishment of information on which seems to
fabricated (Li and et.al., 2020). To perform well, various models should ingest huge amounts of
collecting many sources, and model precision will endure about many information isn't
completely investigated first. In enormous expletory data apparatuses, intelligence significant
part in view information investigation visual advances and dispersal of experiences. The way
communicate with representations can intensely impact their knowledge of the information just
as worth they put perception structure overall. Python most part viewed most ideal decision for
AI with its adaptability for creation. The best words for information investigation relies entirely
upon the current request and accessible instrument and advance.
Stated experimental set-up and control these factors
Associations and frameworks are engaged with creation and prepare of information
sources. For this assessment, recognize jobs of respondent, the information contributor, the
factual organization and the client. Factual organizations might strengthen more than one bunch
of information to include measurable data (insights). Their errand is to gauge of particular
marvel in the public arena. This may suggest the operation of factual strategies, for example,
gauging, ascription, changing and changing ideas (Richter and Rein, 2020). The measurable
office that could led with profoundly subject to nature information source delivered by collecting
the various provider sources. Dealing with nature of the information source is specifically an
obligation provider. The compulsion of the factual office is to quantify the quality source and to
come to concurrences with information provider about hypothesis and make their proper
conclusion for the effective work.
The rundown of centre regions is helpful for improvement of systems, assessment
standards, self-evaluation and reviews. In addition, this rundown can be utilized topic of
discussion between information providers and measurable organizations about information
quality. All over the regions are being grouped in classifications to arrangement rundown of
centre regions. Grouping rules utilize are awesomely founded on connection between the regions
also, the respondent, the framework, the information provider and the measurable office,
separately (Martínez-García, Zhang and Gordon, 2021). Despite the fact that gave valiant effort
distinguish all identified with the theme under investigation, rundown of that could not make
their finished. The client of rundown is allowed to alter rundown as researcher needs. A
consistent following stage is characterize markers or potentially activities for each gauge or deal
with this space.
CONCLUSION
From the above report it had been concluded, hypothesis for the dataset in such kind of
report which could make the research for having more effective terms. While having such things
this could also essential for taking the knowledge about the correlation in which mean, mode and
standard deviation that could be important. In such things this could keep the proper estimation
about those sources and make sure for knowing about their concepts and that could also led them
for keeping many more things about the null and alternative hypothesis. This report have done
with the alternative hypothesis and that could also have their high effective goals.
⊘ This is a preview!⊘
Do you want full access?
Subscribe today to unlock all pages.
Trusted by 1+ million students worldwide
REFERENCES
Books and journals
Bakharev, F. and et.al., 2020. Numerical investigation of viscous fingering phenomenon for raw
field data. Transport in Porous Media. 132(2). pp.443-464.
Kalaignanam, K. and et.al., 2021. Marketing agility: the concept, antecedents, and a research
agenda. Journal of Marketing. 85(1). pp.35-58.
Le, H.P. and Sarkodie, S.A., 2020. Dynamic linkage between renewable and conventional energy
use, environmental quality and economic growth: evidence from Emerging Market and
Developing Economies. Energy Reports. 6. pp.965-973.
Li, D. and et.al., 2020. Numerical investigation of the water entry of a hydrophobic sphere with
spin. International Journal of Multiphase Flow. 126. p.103234.
Lim, W.M. and Mandrinos, S., 2020. Incidental findings on multimodel comparison, hypothesis
testing error, and its solution. Australasian Journal of Information Systems. 24.
Martínez-García, M., Zhang, Y. and Gordon, T., 2021. Memory pattern identification for
feedback tracking control in human–machine systems. Human factors. 63(2). pp.210-226.
Mertens, W. and Recker, J., 2020. New guidelines for null hypothesis significance testing in
hypothetico-deductive IS research. Journal of the Association for Information
Systems. 21(4). p.1.
Nadanyiova, M. and Das, S., 2020. Millennials as a target segment of socially responsible
communication within the business strategy. Littera Scripta. 13(1). pp.119-134.
Richter, F. and Rein, G., 2020. A multiscale model of wood pyrolysis in fire to study the roles of
chemistry and heat transfer at the mesoscale. Combustion and Flame. 216. pp.316-325.
Schnuerch, M. and Erdfelder, E., 2020. Controlling decision errors with minimal costs: The
sequential probability ratio t test. Psychological methods. 25(2. p.206.
1
Paraphrase This Document
Need a fresh take? Get an instant paraphrase of this document with our AI Paraphraser

2
1 out of 11
Related Documents


Your All-in-One AI-Powered Toolkit for Academic Success.
+13062052269
info@desklib.com
Available 24*7 on WhatsApp / Email
![[object Object]](/_next/static/media/star-bottom.7253800d.svg)
Unlock your academic potential
Copyright © 2020–2025 A2Z Services. All Rights Reserved. Developed and managed by ZUCOL.