Medcycle: Financial Plan and Startup Analysis for Entrepreneurship
VerifiedAdded on 2020/02/19
|17
|2725
|212
Project
AI Summary
This project presents a comprehensive financial plan for Medcycle, a startup venture. The plan meticulously outlines startup costs, including technical infrastructure, staff remuneration, marketing fees, and app development expenses. It analyzes profitability using common financial ratios like net profit ratio, debt ratio, and current ratio, projecting sales, gross margin, and net profit over three years. The project details projected income, cash flow, and break-even analysis. It also addresses cash reserves and exit strategies, such as seeking venture capital. The financial plan is based on the consideration of the key partners, key activities, value proposition strategies, customer relations and customer segments. Some of the other considerations have been taken with the key resources and the channels. The key partners of Medcycle have been seen with the partnerships with the doctors, pharmacy, hospitals and major developers of the app such as Google Play store. The Indian government and bank and the insurance companies has formed a considerable share of the revenues for Medcycle.
Running head: INNOVATION AND ENTREPRENEURSHIP
Innovation and Entrepreneurship
Name of the Student
Name of the University
Author’s Note
Innovation and Entrepreneurship
Name of the Student
Name of the University
Author’s Note
Paraphrase This Document
Need a fresh take? Get an instant paraphrase of this document with our AI Paraphraser
1INNOVATION AND ENTREPRENEURSHIP
Table of Contents
Financial Plan..................................................................................................................................2
Financial Plan..............................................................................................................................2
Start-up Costs..............................................................................................................................2
Profitability..................................................................................................................................4
Cash Reserves.............................................................................................................................6
Projected Income.........................................................................................................................6
Projected Cash Flow....................................................................................................................7
Exit or Harvest Strategies............................................................................................................7
Reference List..................................................................................................................................8
List of Appendix..............................................................................................................................0
2INNOVATION AND ENTREPRENEURSHIP
Financial Plan
Financial Plan
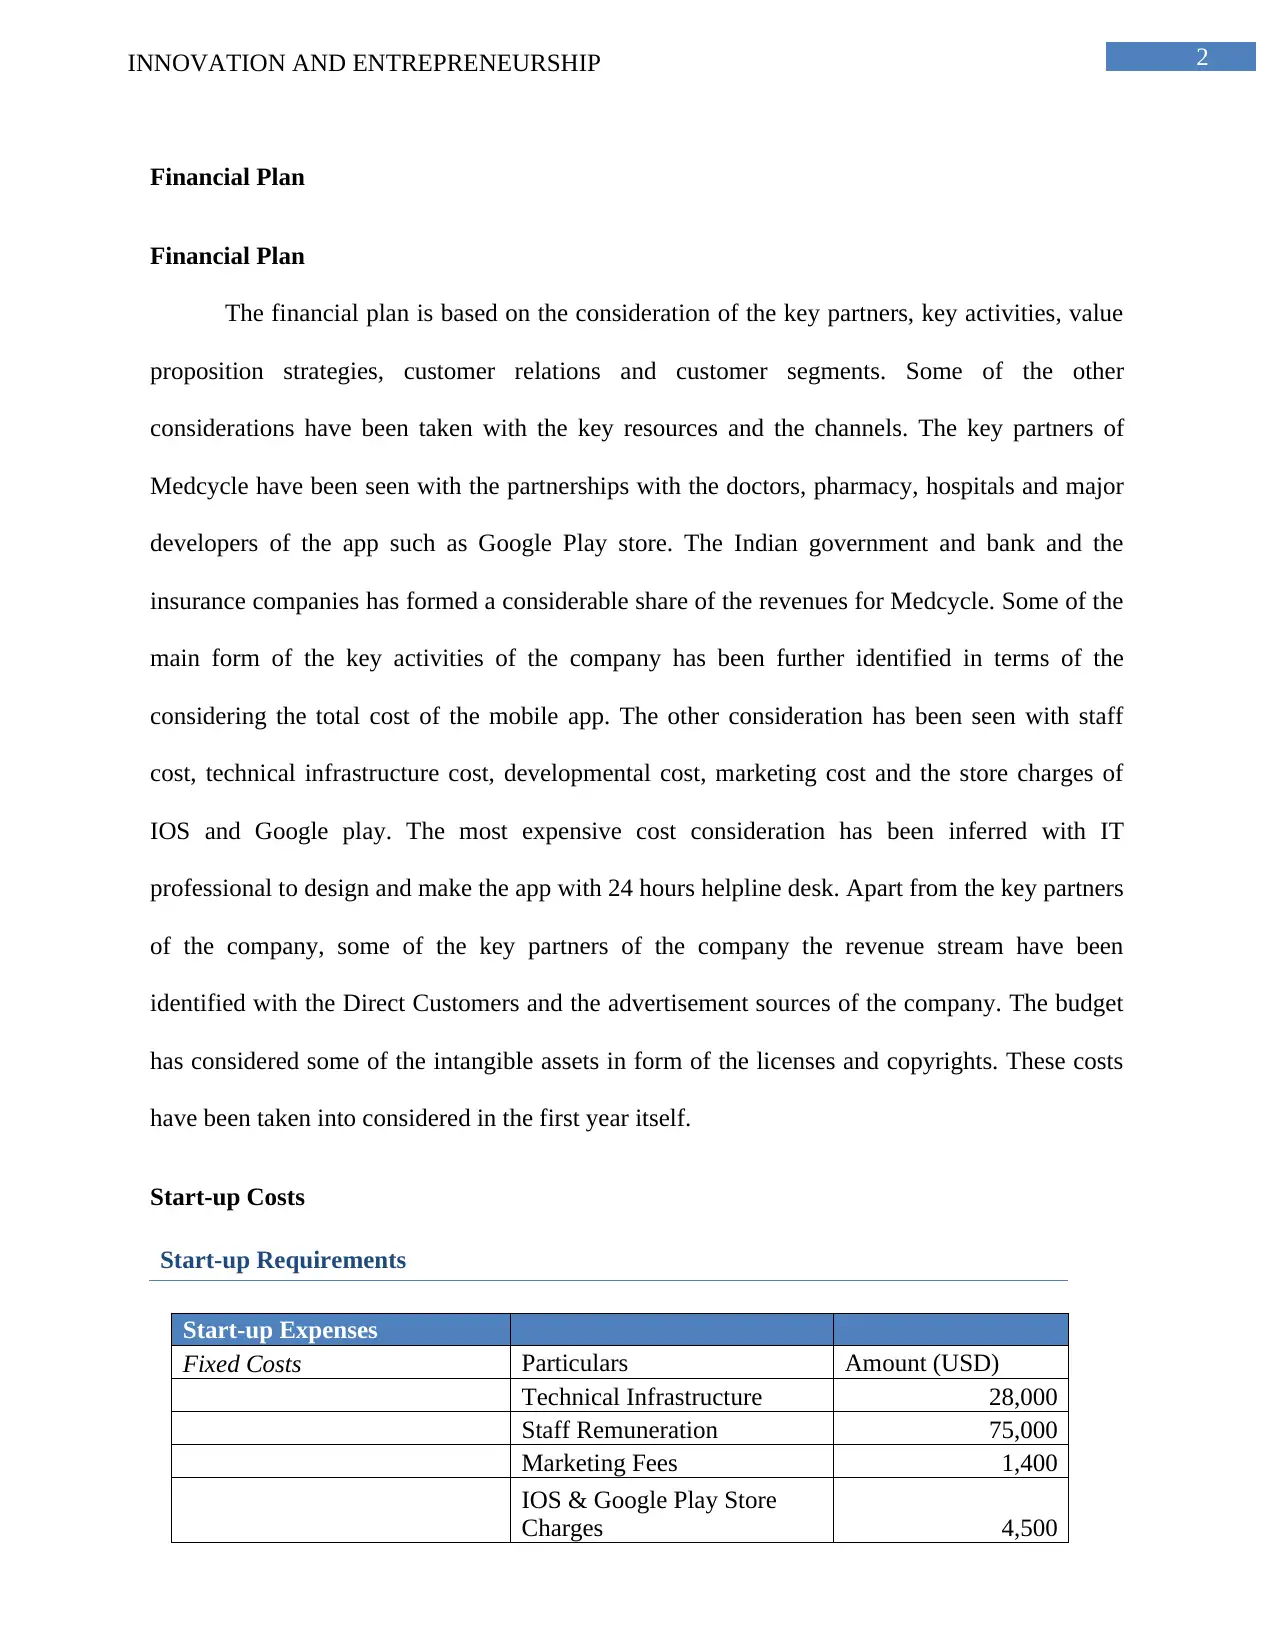
The financial plan is based on the consideration of the key partners, key activities, value
proposition strategies, customer relations and customer segments. Some of the other
considerations have been taken with the key resources and the channels. The key partners of
Medcycle have been seen with the partnerships with the doctors, pharmacy, hospitals and major
developers of the app such as Google Play store. The Indian government and bank and the
insurance companies has formed a considerable share of the revenues for Medcycle. Some of the
main form of the key activities of the company has been further identified in terms of the
considering the total cost of the mobile app. The other consideration has been seen with staff
cost, technical infrastructure cost, developmental cost, marketing cost and the store charges of
IOS and Google play. The most expensive cost consideration has been inferred with IT
professional to design and make the app with 24 hours helpline desk. Apart from the key partners
of the company, some of the key partners of the company the revenue stream have been
identified with the Direct Customers and the advertisement sources of the company. The budget
has considered some of the intangible assets in form of the licenses and copyrights. These costs
have been taken into considered in the first year itself.
Start-up Costs
Start-up Requirements
Start-up Expenses
Fixed Costs Particulars Amount (USD)
Technical Infrastructure 28,000
Staff Remuneration 75,000
Marketing Fees 1,400
IOS & Google Play Store
Charges 4,500
Financial Plan
Financial Plan
The financial plan is based on the consideration of the key partners, key activities, value
proposition strategies, customer relations and customer segments. Some of the other
considerations have been taken with the key resources and the channels. The key partners of
Medcycle have been seen with the partnerships with the doctors, pharmacy, hospitals and major
developers of the app such as Google Play store. The Indian government and bank and the
insurance companies has formed a considerable share of the revenues for Medcycle. Some of the
main form of the key activities of the company has been further identified in terms of the
considering the total cost of the mobile app. The other consideration has been seen with staff
cost, technical infrastructure cost, developmental cost, marketing cost and the store charges of
IOS and Google play. The most expensive cost consideration has been inferred with IT
professional to design and make the app with 24 hours helpline desk. Apart from the key partners
of the company, some of the key partners of the company the revenue stream have been
identified with the Direct Customers and the advertisement sources of the company. The budget
has considered some of the intangible assets in form of the licenses and copyrights. These costs
have been taken into considered in the first year itself.
Start-up Costs
Start-up Requirements
Start-up Expenses
Fixed Costs Particulars Amount (USD)
Technical Infrastructure 28,000
Staff Remuneration 75,000
Marketing Fees 1,400
IOS & Google Play Store
Charges 4,500
⊘ This is a preview!⊘
Do you want full access?
Subscribe today to unlock all pages.
Trusted by 1+ million students worldwide
3INNOVATION AND ENTREPRENEURSHIP
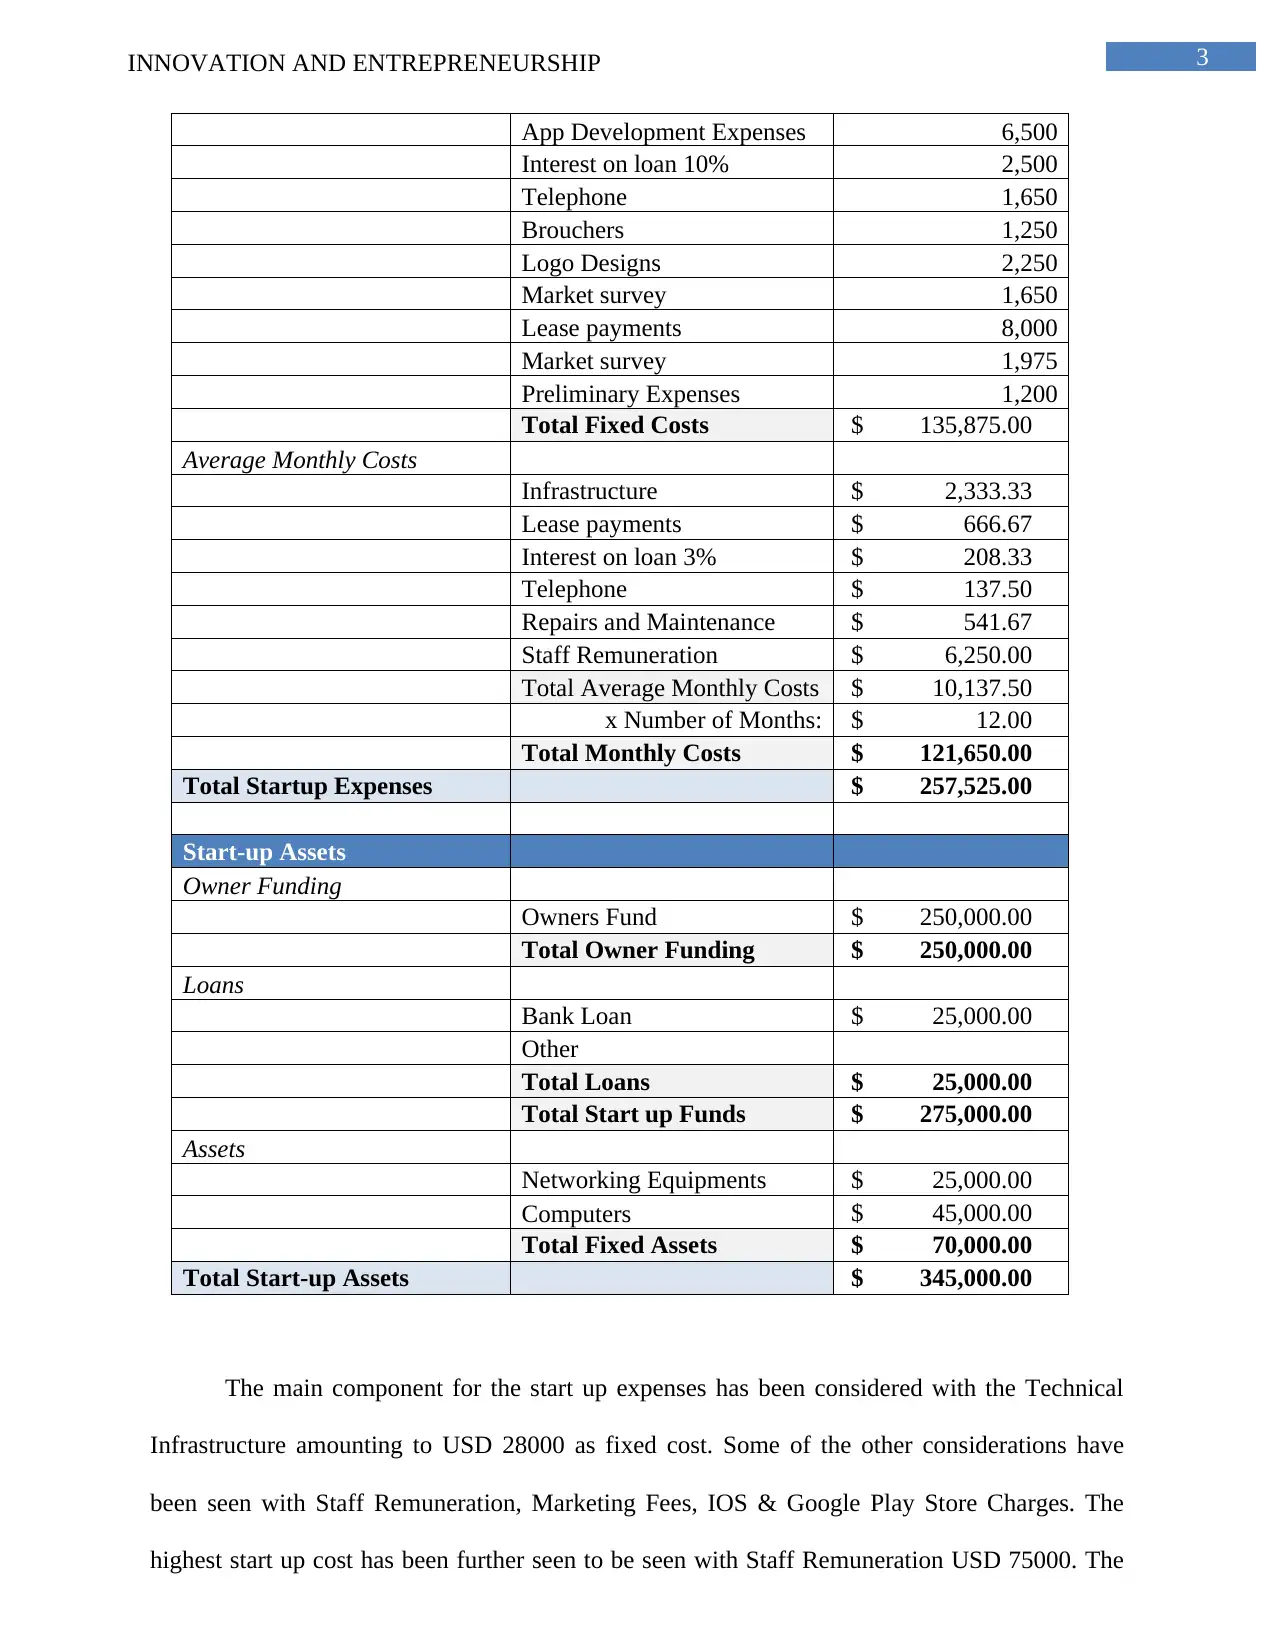
App Development Expenses 6,500
Interest on loan 10% 2,500
Telephone 1,650
Brouchers 1,250
Logo Designs 2,250
Market survey 1,650
Lease payments 8,000
Market survey 1,975
Preliminary Expenses 1,200
Total Fixed Costs $ 135,875.00
Average Monthly Costs
Infrastructure $ 2,333.33
Lease payments $ 666.67
Interest on loan 3% $ 208.33
Telephone $ 137.50
Repairs and Maintenance $ 541.67
Staff Remuneration $ 6,250.00
Total Average Monthly Costs $ 10,137.50
x Number of Months: $ 12.00
Total Monthly Costs $ 121,650.00
Total Startup Expenses $ 257,525.00
Start-up Assets
Owner Funding
Owners Fund $ 250,000.00
Total Owner Funding $ 250,000.00
Loans
Bank Loan $ 25,000.00
Other
Total Loans $ 25,000.00
Total Start up Funds $ 275,000.00
Assets
Networking Equipments $ 25,000.00
Computers $ 45,000.00
Total Fixed Assets $ 70,000.00
Total Start-up Assets $ 345,000.00
The main component for the start up expenses has been considered with the Technical
Infrastructure amounting to USD 28000 as fixed cost. Some of the other considerations have
been seen with Staff Remuneration, Marketing Fees, IOS & Google Play Store Charges. The
highest start up cost has been further seen to be seen with Staff Remuneration USD 75000. The
Paraphrase This Document
Need a fresh take? Get an instant paraphrase of this document with our AI Paraphraser
4INNOVATION AND ENTREPRENEURSHIP
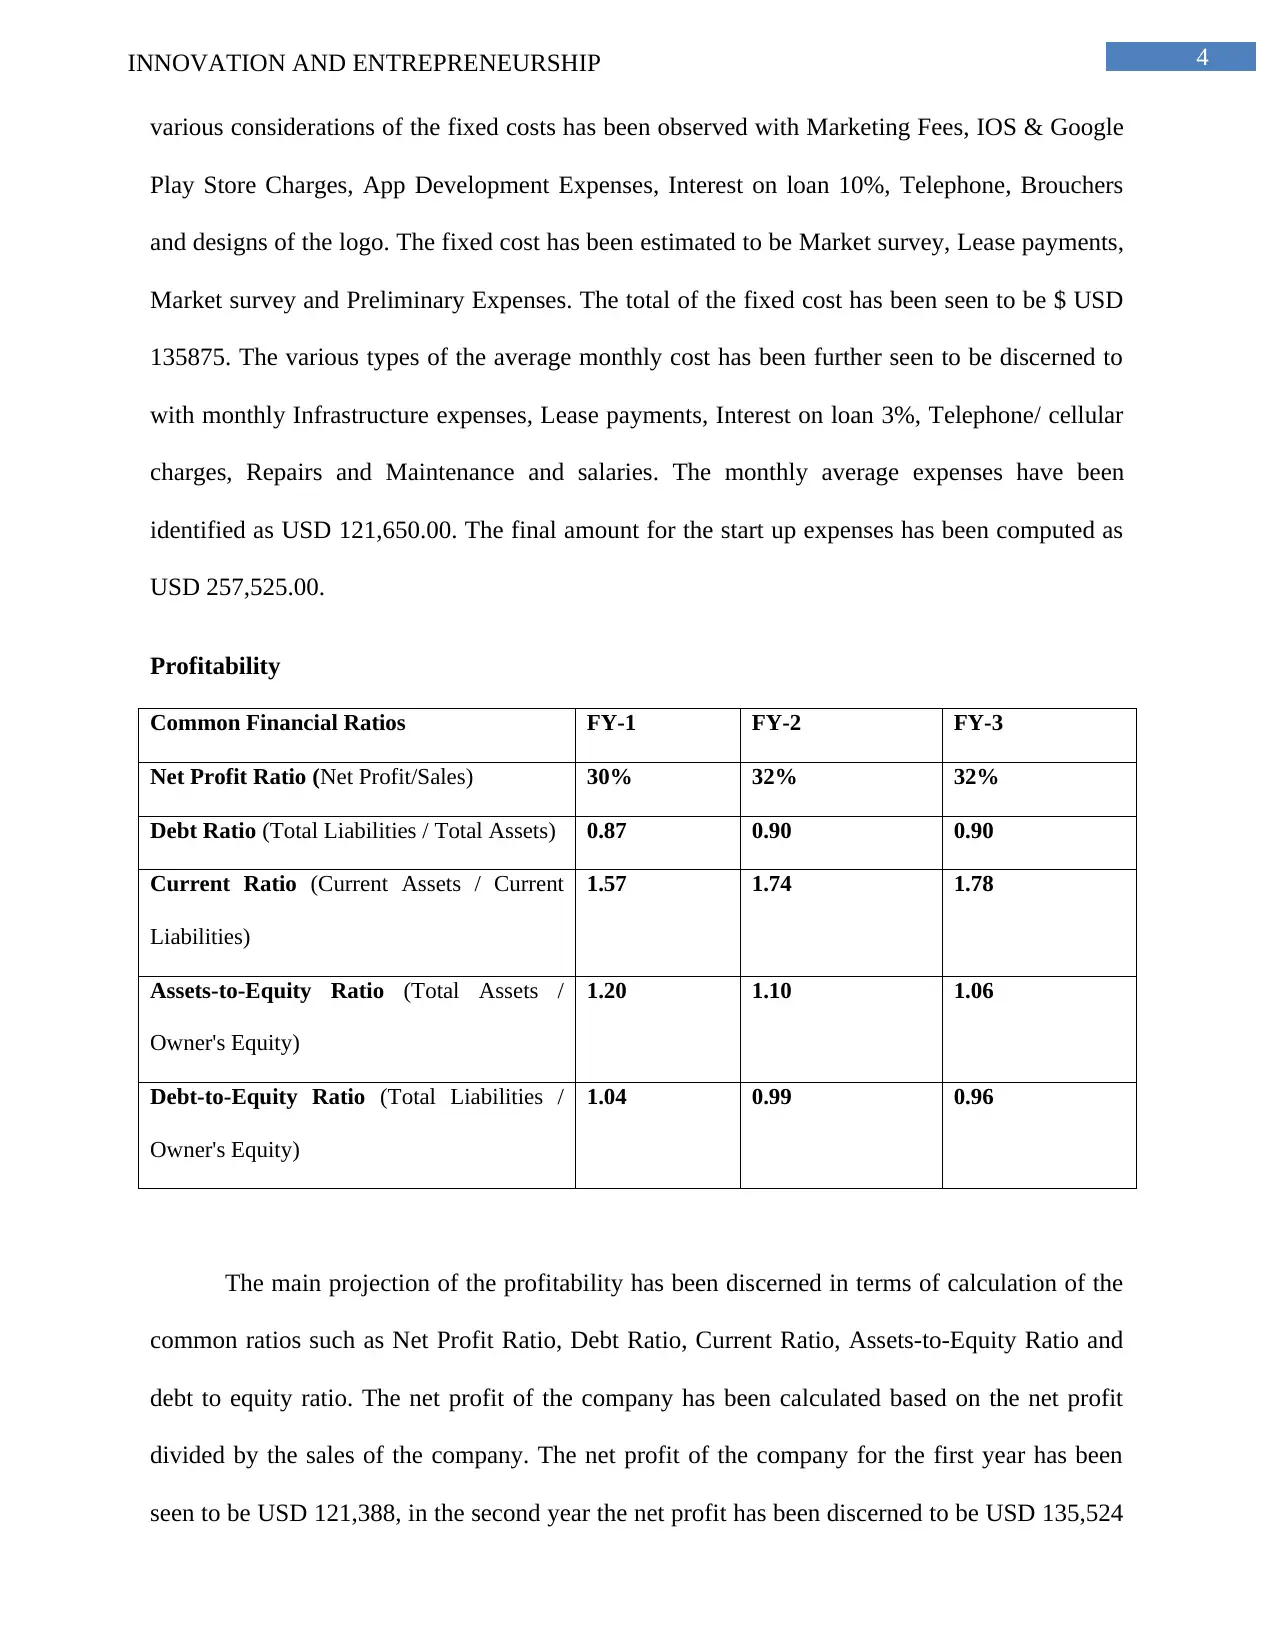
various considerations of the fixed costs has been observed with Marketing Fees, IOS & Google
Play Store Charges, App Development Expenses, Interest on loan 10%, Telephone, Brouchers
and designs of the logo. The fixed cost has been estimated to be Market survey, Lease payments,
Market survey and Preliminary Expenses. The total of the fixed cost has been seen to be $ USD
135875. The various types of the average monthly cost has been further seen to be discerned to
with monthly Infrastructure expenses, Lease payments, Interest on loan 3%, Telephone/ cellular
charges, Repairs and Maintenance and salaries. The monthly average expenses have been
identified as USD 121,650.00. The final amount for the start up expenses has been computed as
USD 257,525.00.
Profitability
Common Financial Ratios FY-1 FY-2 FY-3
Net Profit Ratio (Net Profit/Sales) 30% 32% 32%
Debt Ratio (Total Liabilities / Total Assets) 0.87 0.90 0.90
Current Ratio (Current Assets / Current
Liabilities)
1.57 1.74 1.78
Assets-to-Equity Ratio (Total Assets /
Owner's Equity)
1.20 1.10 1.06
Debt-to-Equity Ratio (Total Liabilities /
Owner's Equity)
1.04 0.99 0.96
The main projection of the profitability has been discerned in terms of calculation of the
common ratios such as Net Profit Ratio, Debt Ratio, Current Ratio, Assets-to-Equity Ratio and
debt to equity ratio. The net profit of the company has been calculated based on the net profit
divided by the sales of the company. The net profit of the company for the first year has been
seen to be USD 121,388, in the second year the net profit has been discerned to be USD 135,524
5INNOVATION AND ENTREPRENEURSHIP
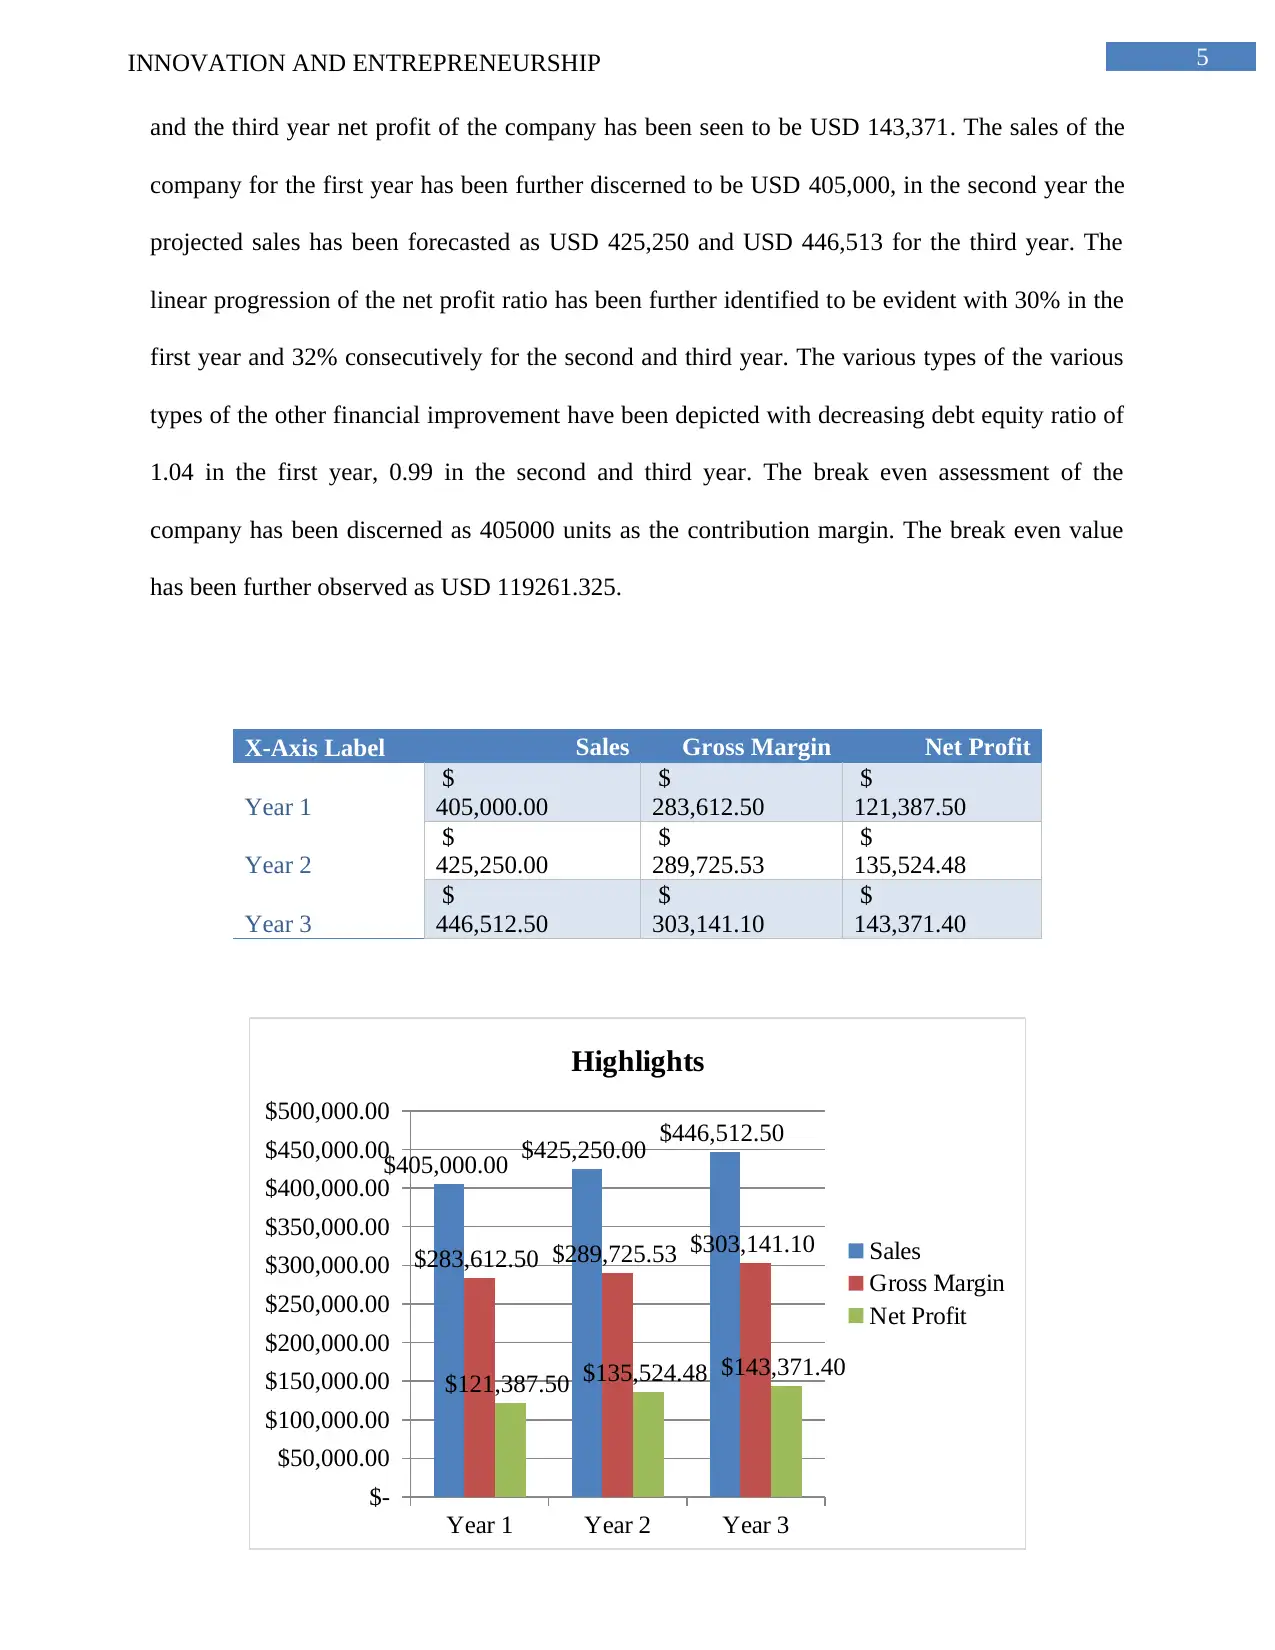
and the third year net profit of the company has been seen to be USD 143,371. The sales of the
company for the first year has been further discerned to be USD 405,000, in the second year the
projected sales has been forecasted as USD 425,250 and USD 446,513 for the third year. The
linear progression of the net profit ratio has been further identified to be evident with 30% in the
first year and 32% consecutively for the second and third year. The various types of the various
types of the other financial improvement have been depicted with decreasing debt equity ratio of
1.04 in the first year, 0.99 in the second and third year. The break even assessment of the
company has been discerned as 405000 units as the contribution margin. The break even value
has been further observed as USD 119261.325.
X-Axis Label Sales Gross Margin Net Profit
Year 1
$
405,000.00
$
283,612.50
$
121,387.50
Year 2
$
425,250.00
$
289,725.53
$
135,524.48
Year 3
$
446,512.50
$
303,141.10
$
143,371.40
Year 1 Year 2 Year 3
$-
$50,000.00
$100,000.00
$150,000.00
$200,000.00
$250,000.00
$300,000.00
$350,000.00
$400,000.00
$450,000.00
$500,000.00
$405,000.00 $425,250.00 $446,512.50
$283,612.50 $289,725.53 $303,141.10
$121,387.50 $135,524.48 $143,371.40
Highlights
Sales
Gross Margin
Net Profit
⊘ This is a preview!⊘
Do you want full access?
Subscribe today to unlock all pages.
Trusted by 1+ million students worldwide
6INNOVATION AND ENTREPRENEURSHIP
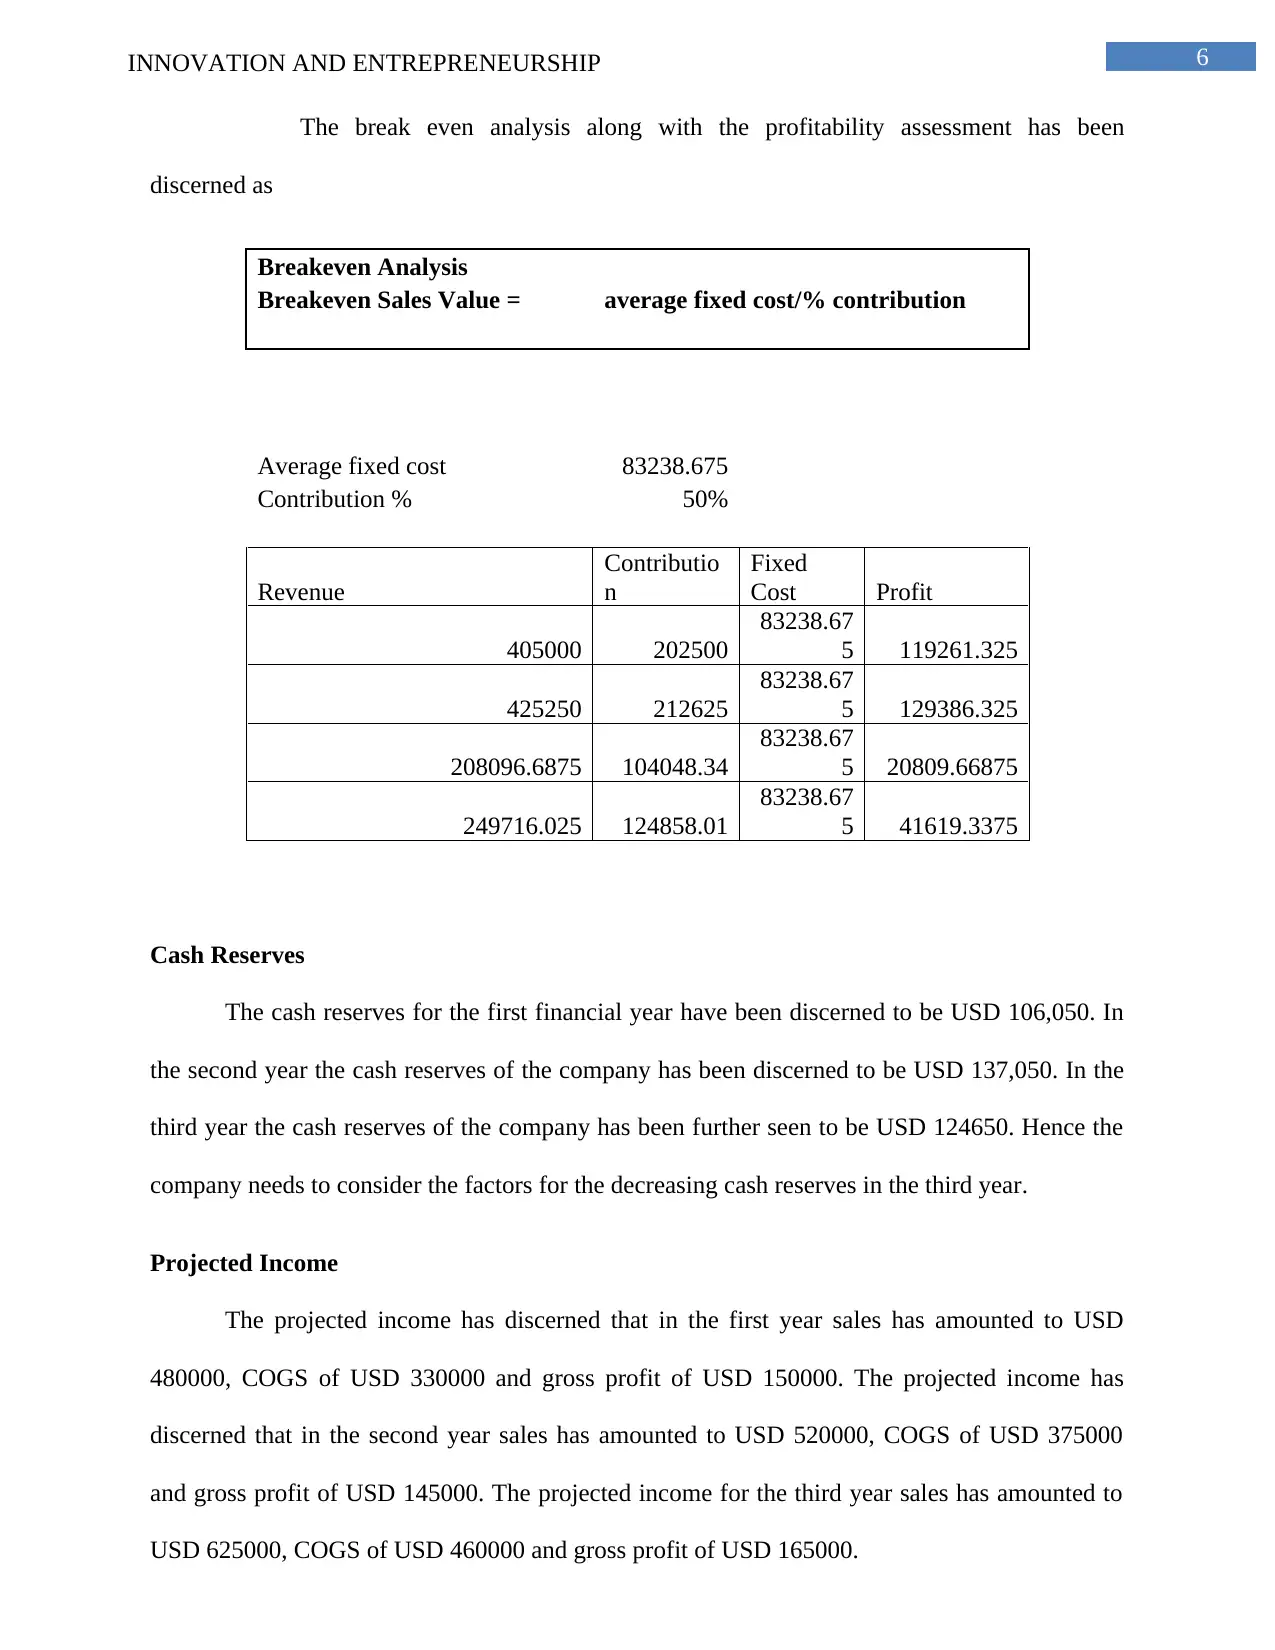
The break even analysis along with the profitability assessment has been
discerned as
Breakeven Analysis
Breakeven Sales Value = average fixed cost/% contribution
Average fixed cost 83238.675
Contribution % 50%
Revenue
Contributio
n
Fixed
Cost Profit
405000 202500
83238.67
5 119261.325
425250 212625
83238.67
5 129386.325
208096.6875 104048.34
83238.67
5 20809.66875
249716.025 124858.01
83238.67
5 41619.3375
Cash Reserves
The cash reserves for the first financial year have been discerned to be USD 106,050. In
the second year the cash reserves of the company has been discerned to be USD 137,050. In the
third year the cash reserves of the company has been further seen to be USD 124650. Hence the
company needs to consider the factors for the decreasing cash reserves in the third year.
Projected Income
The projected income has discerned that in the first year sales has amounted to USD
480000, COGS of USD 330000 and gross profit of USD 150000. The projected income has
discerned that in the second year sales has amounted to USD 520000, COGS of USD 375000
and gross profit of USD 145000. The projected income for the third year sales has amounted to
USD 625000, COGS of USD 460000 and gross profit of USD 165000.
Paraphrase This Document
Need a fresh take? Get an instant paraphrase of this document with our AI Paraphraser
7INNOVATION AND ENTREPRENEURSHIP
Projected Cash Flow
The projected cash flows have been taken into consideration as per the cash from Sales,
director’s loans and the capital employed. The cash from the sales has discerned a linear growth
with USD 405,000 in the first year, USD 425,250 in the second year and USD 446,513. The total
amount of the director’s loans has been further seen to be USD 25000. The cash inflow has
shown an increasing trend of USD 125000 in the first year, USD 680000 in the second year,
USD 712,750 and USD 747138.
Exit or Harvest Strategies
The assistance from the venture capitalist can be taken to provide the investment to
startup ventures or support the capital funding. The capitalists have been further seen to be
willing to earn a huge amount of investment for the success of the organization. The venture
capitalist will be able to help the business to provide a strong management team and explore
large potential in the market.
8INNOVATION AND ENTREPRENEURSHIP
Reference List
Brinckmann, J., & Kim, S. M. (2015). Why we plan: the impact of nascent entrepreneurs'
cognitive characteristics and human capital on business planning. Strategic Entrepreneurship
Journal, 9(2), 153-166.
Brinckmann, J., Read, S., Mayer-Haug, K., Dew, N., & Grichnik, D. (2015, January). Of those
who plan: A meta-analysis of the relationship between human capital and business planning.
In Academy of Management Proceedings (Vol. 2015, No. 1, p. 16198). Academy of
Management.
Fulker, D., Timur, A., Dew, K., & Butler, J. (2016). A Case Study of the Grey Oaks Community
and Club: Creation of a High-Performance Culture Through the Innovative Use of a Data-Driven
Business Plan. International Journal of Hospitality & Tourism Administration, 17(1), 72-99.
McKeever, M. (2016). How to write a business plan. Nolo.
Rutz, E., Tappel, J., & Zirger, B. J. (2014). A MOOC with a business plan. In ASEE Annual
Conference and Exposition. American Society for Engineering Education.
Schaper, M. T., Volery, T., Weber, P. C., & Gibson, B. (2014). Entrepreneurship and small
business.
Watson, K., McGowan, P., & Cooper, S. (2016). Reimagining the extracurricular business plan
competition through the incorporation of effectuation.
⊘ This is a preview!⊘
Do you want full access?
Subscribe today to unlock all pages.
Trusted by 1+ million students worldwide
0INNOVATION AND ENTREPRENEURSHIP
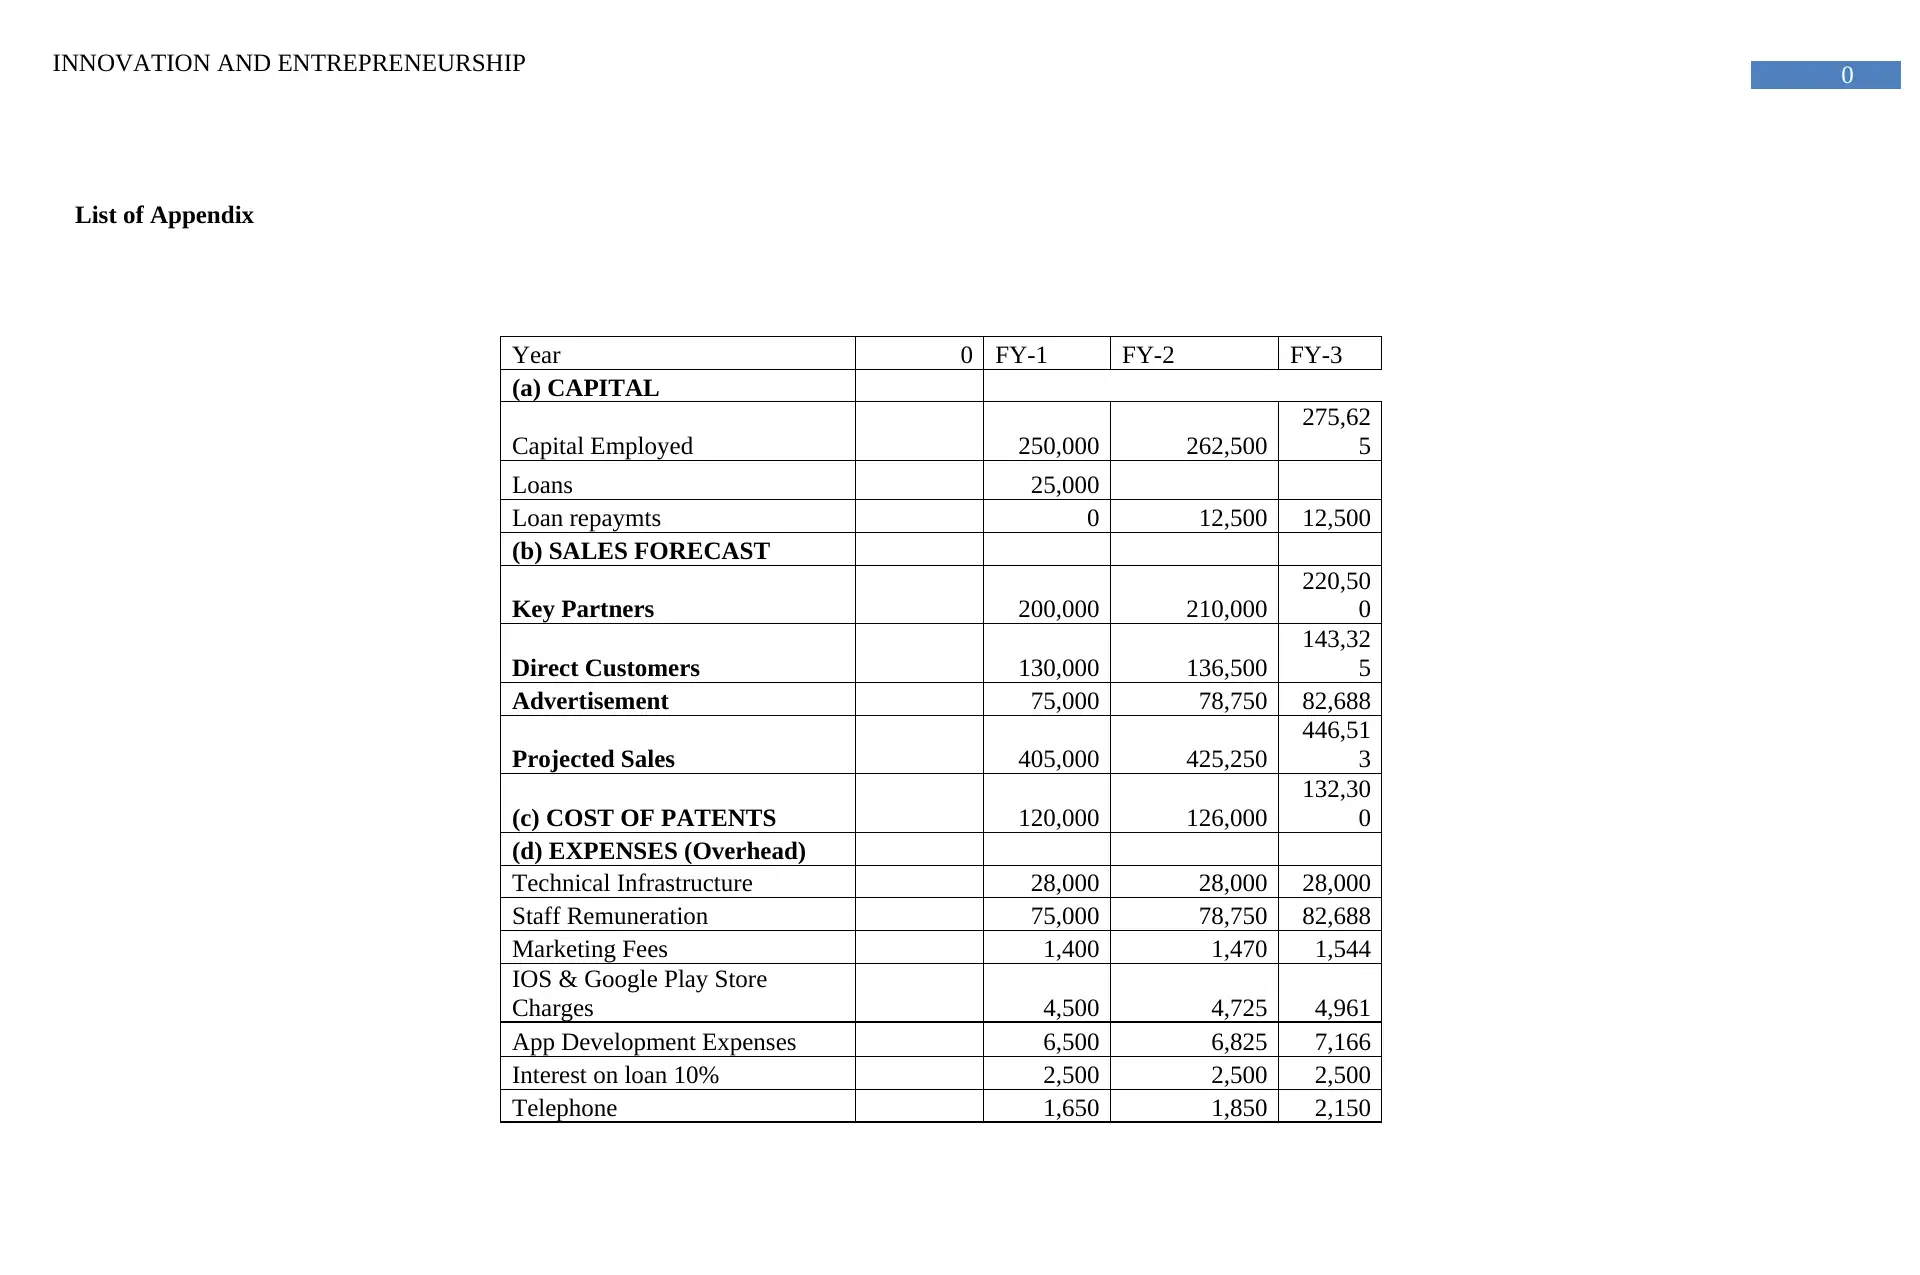
List of Appendix
Year 0 FY-1 FY-2 FY-3
(a) CAPITAL
Capital Employed 250,000 262,500
275,62
5
Loans 25,000
Loan repaymts 0 12,500 12,500
(b) SALES FORECAST
Key Partners 200,000 210,000
220,50
0
Direct Customers 130,000 136,500
143,32
5
Advertisement 75,000 78,750 82,688
Projected Sales 405,000 425,250
446,51
3
(c) COST OF PATENTS 120,000 126,000
132,30
0
(d) EXPENSES (Overhead)
Technical Infrastructure 28,000 28,000 28,000
Staff Remuneration 75,000 78,750 82,688
Marketing Fees 1,400 1,470 1,544
IOS & Google Play Store
Charges 4,500 4,725 4,961
App Development Expenses 6,500 6,825 7,166
Interest on loan 10% 2,500 2,500 2,500
Telephone 1,650 1,850 2,150
Paraphrase This Document
Need a fresh take? Get an instant paraphrase of this document with our AI Paraphraser
1INNOVATION AND ENTREPRENEURSHIP
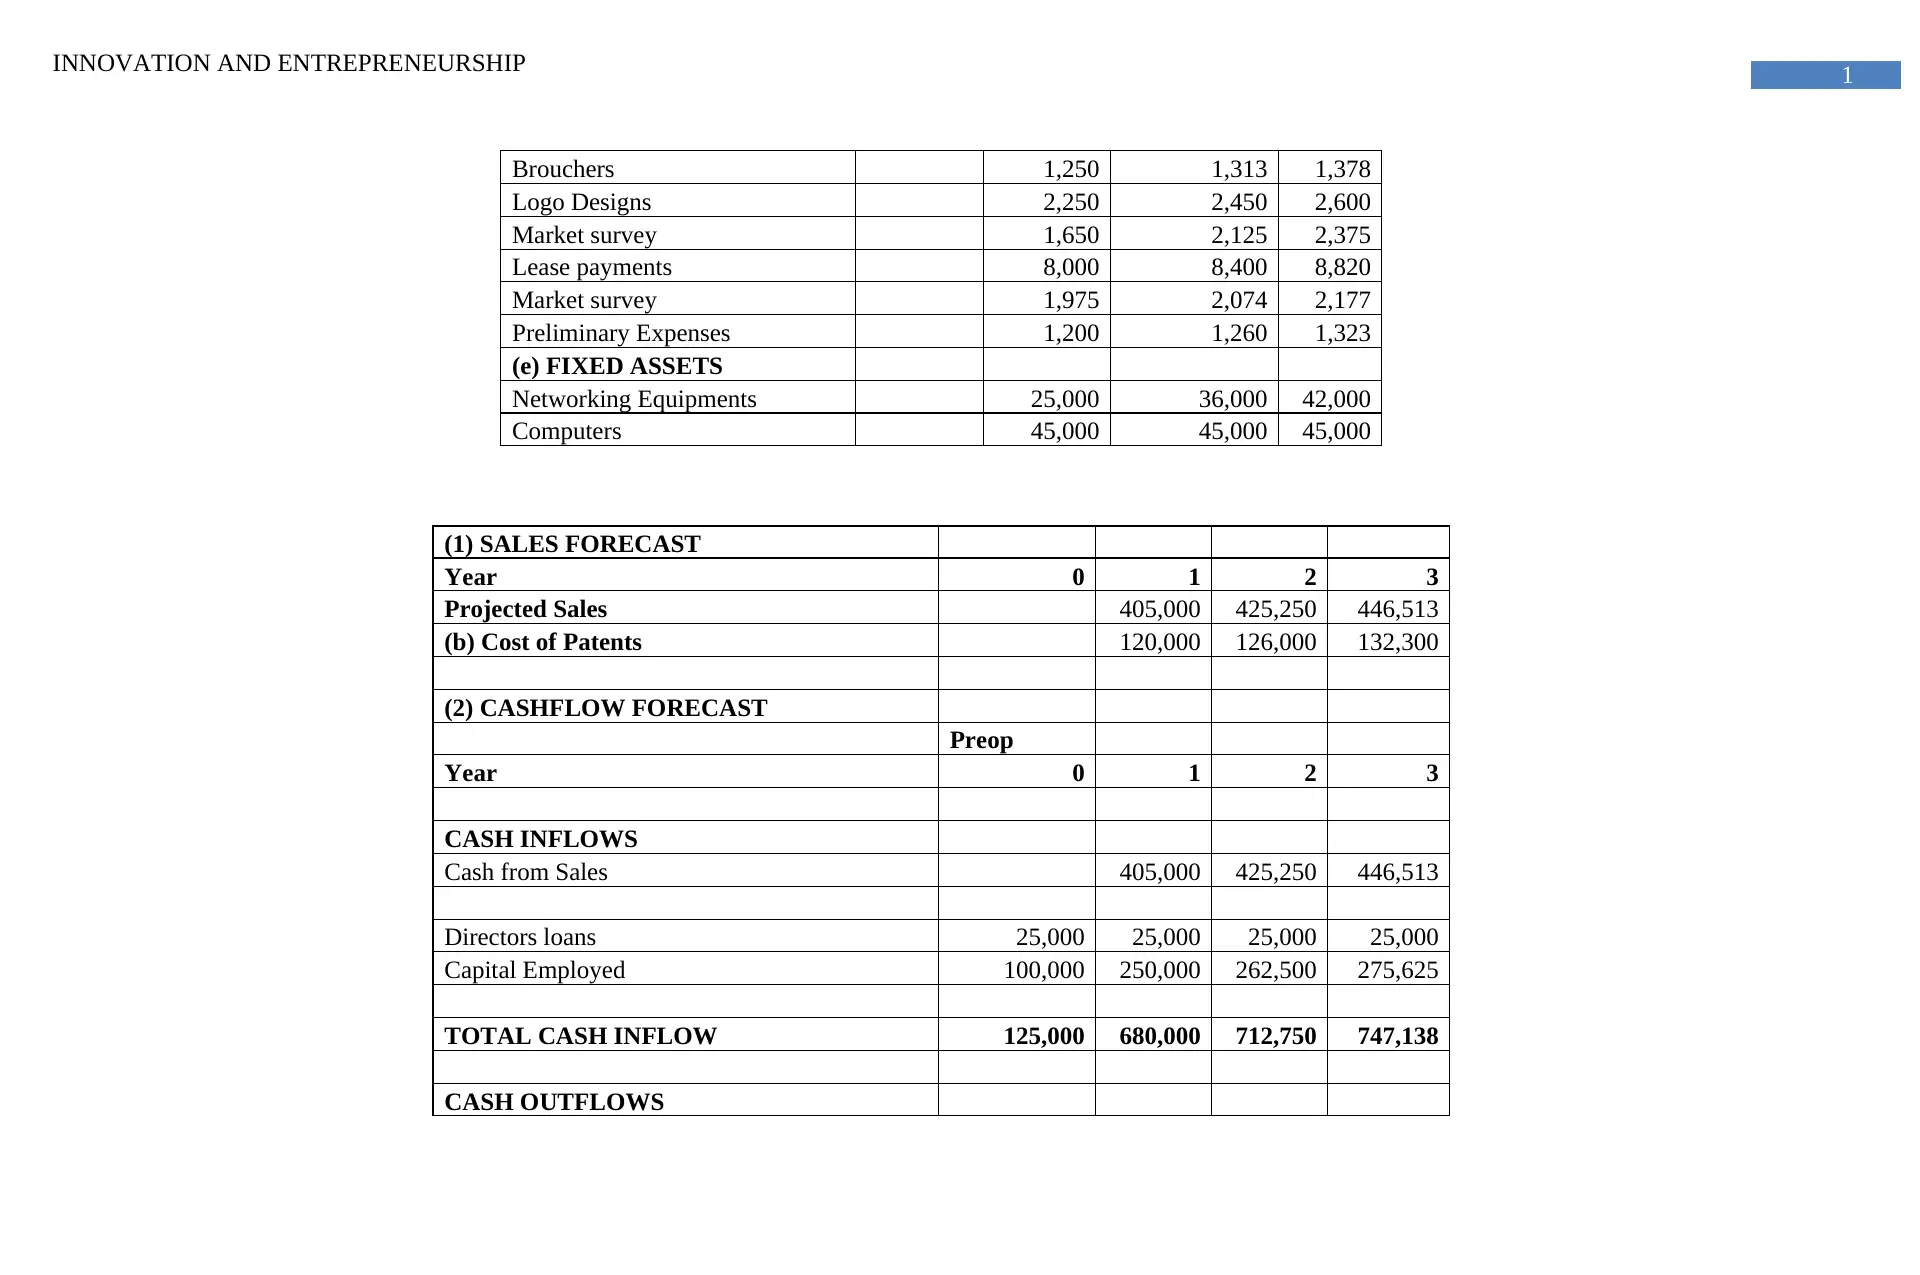
Brouchers 1,250 1,313 1,378
Logo Designs 2,250 2,450 2,600
Market survey 1,650 2,125 2,375
Lease payments 8,000 8,400 8,820
Market survey 1,975 2,074 2,177
Preliminary Expenses 1,200 1,260 1,323
(e) FIXED ASSETS
Networking Equipments 25,000 36,000 42,000
Computers 45,000 45,000 45,000
(1) SALES FORECAST
Year 0 1 2 3
Projected Sales 405,000 425,250 446,513
(b) Cost of Patents 120,000 126,000 132,300
(2) CASHFLOW FORECAST
Preop
Year 0 1 2 3
CASH INFLOWS
Cash from Sales 405,000 425,250 446,513
Directors loans 25,000 25,000 25,000 25,000
Capital Employed 100,000 250,000 262,500 275,625
TOTAL CASH INFLOW 125,000 680,000 712,750 747,138
CASH OUTFLOWS
2INNOVATION AND ENTREPRENEURSHIP
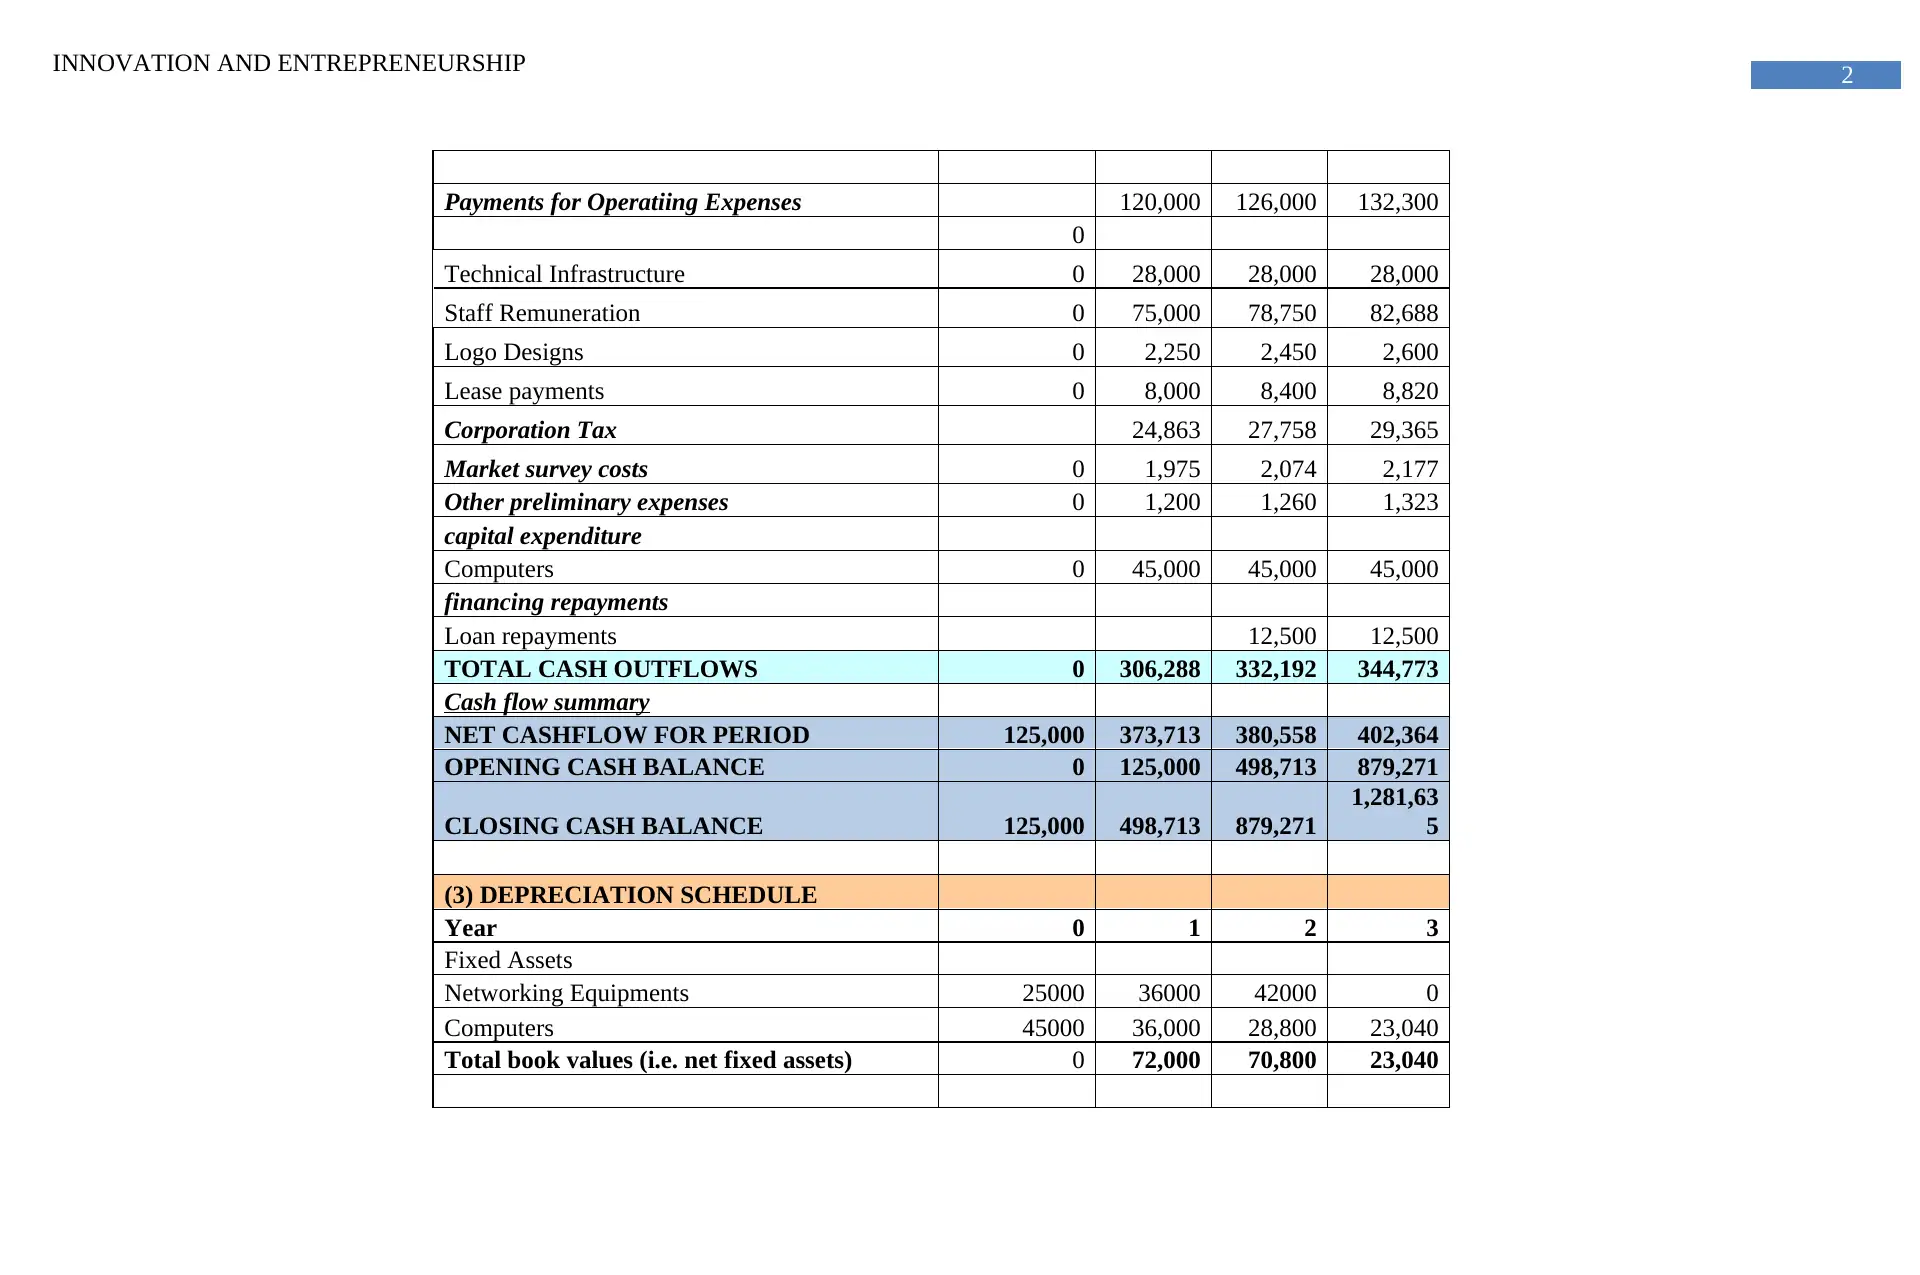
Payments for Operatiing Expenses 120,000 126,000 132,300
0
Technical Infrastructure 0 28,000 28,000 28,000
Staff Remuneration 0 75,000 78,750 82,688
Logo Designs 0 2,250 2,450 2,600
Lease payments 0 8,000 8,400 8,820
Corporation Tax 24,863 27,758 29,365
Market survey costs 0 1,975 2,074 2,177
Other preliminary expenses 0 1,200 1,260 1,323
capital expenditure
Computers 0 45,000 45,000 45,000
financing repayments
Loan repayments 12,500 12,500
TOTAL CASH OUTFLOWS 0 306,288 332,192 344,773
Cash flow summary
NET CASHFLOW FOR PERIOD 125,000 373,713 380,558 402,364
OPENING CASH BALANCE 0 125,000 498,713 879,271
CLOSING CASH BALANCE 125,000 498,713 879,271
1,281,63
5
(3) DEPRECIATION SCHEDULE
Year 0 1 2 3
Fixed Assets
Networking Equipments 25000 36000 42000 0
Computers 45000 36,000 28,800 23,040
Total book values (i.e. net fixed assets) 0 72,000 70,800 23,040
⊘ This is a preview!⊘
Do you want full access?
Subscribe today to unlock all pages.
Trusted by 1+ million students worldwide
1 out of 17

Your All-in-One AI-Powered Toolkit for Academic Success.
+13062052269
info@desklib.com
Available 24*7 on WhatsApp / Email
![[object Object]](/_next/static/media/star-bottom.7253800d.svg)
Unlock your academic potential
Copyright © 2020–2026 A2Z Services. All Rights Reserved. Developed and managed by ZUCOL.