The Global Economy- Assignment
25 Pages3692 Words103 Views
Added on 2021-05-31
The Global Economy- Assignment
Added on 2021-05-31
ShareRelated Documents
Running Head: THE GLOBAL ECONOMY The Global EconomyName of the StudentName of the UniversityCourse ID
THE GLOBAL ECONOMY 1Table of ContentsPart A...............................................................................................................................................2Answer 1......................................................................................................................................2Answer 2......................................................................................................................................3Answer 3....................................................................................................................................12Part B.............................................................................................................................................13Answer 4....................................................................................................................................14Answer 5....................................................................................................................................16Part C.............................................................................................................................................19Introduction................................................................................................................................19Public Policy Planner: Responsibilities and Skills....................................................................19My strengths as an aspirant........................................................................................................20Video Interpretation...................................................................................................................20Action Plan................................................................................................................................21Reference list.................................................................................................................................23
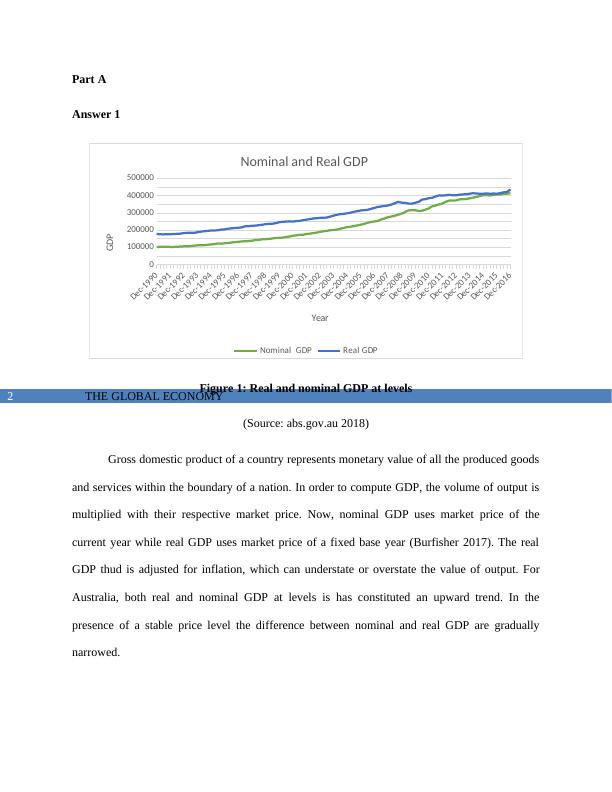
THE GLOBAL ECONOMY 2Part AAnswer 1Dec-1990Dec-1991Dec-1992Dec-1993Dec-1994Dec-1995Dec-1996Dec-1997Dec-1998Dec-1999Dec-2000Dec-2001Dec-2002Dec-2003Dec-2004Dec-2005Dec-2006Dec-2007Dec-2008Dec-2009Dec-2010Dec-2011Dec-2012Dec-2013Dec-2014Dec-2015Dec-20160100000200000300000400000500000Nominal and Real GDP Nominal GDPReal GDPYearGDPFigure 1: Real and nominal GDP at levels (Source: abs.gov.au 2018)Gross domestic product of a country represents monetary value of all the produced goodsand services within the boundary of a nation. In order to compute GDP, the volume of output ismultiplied with their respective market price. Now, nominal GDP uses market price of thecurrent year while real GDP uses market price of a fixed base year (Burfisher 2017). The realGDP thud is adjusted for inflation, which can understate or overstate the value of output. ForAustralia, both real and nominal GDP at levels is has constituted an upward trend. In thepresence of a stable price level the difference between nominal and real GDP are graduallynarrowed.
THE GLOBAL ECONOMY 3Dec-1990Dec-1991Dec-1992Dec-1993Dec-1994Dec-1995Dec-1996Dec-1997Dec-1998Dec-1999Dec-2000Dec-2001Dec-2002Dec-2003Dec-2004Dec-2005Dec-2006Dec-2007Dec-2008Dec-2009Dec-2010Dec-2011Dec-2012Dec-2013Dec-2014Dec-2015Dec-2016-1.5-1-0.500.511.522.533.5GDP Growth Real GDPNominal GDPQuartersGrowth(%)Figure 2: Trend in real and nominal GDP growth rate (Source: abs.gov.au 2018)So far as the growth rate is concerned the nominal GDP growth is slightly above realGDP growth rate for all the years. The implicit price deflator used to compute real GDP fromnominal real changes in response to changes in terms of trade (aph.gov.au 2018). The decline inthe terms of trade since the beginning of 2011 creates a deflationary pressure on the economycasing real GDP growth rate to exceeds the nominal GDP as shown from the figures. Answer 2Table 1: Inflation, unemployment, gross capital formation and expense in AustraliaAustraliaYearInflation UnemploymentGross capital formationExpense19913.2226799139.57999992424.2229999723.159318719920.98591549310.7299995422.344143324.4239642219931.81311018110.8699998923.5940877624.9497828219941.8949771699.72000026724.2503371125.0602512819954.6381357838.47000026725.9369142425.3703517119962.61241978.51000022924.7791721324.53408057
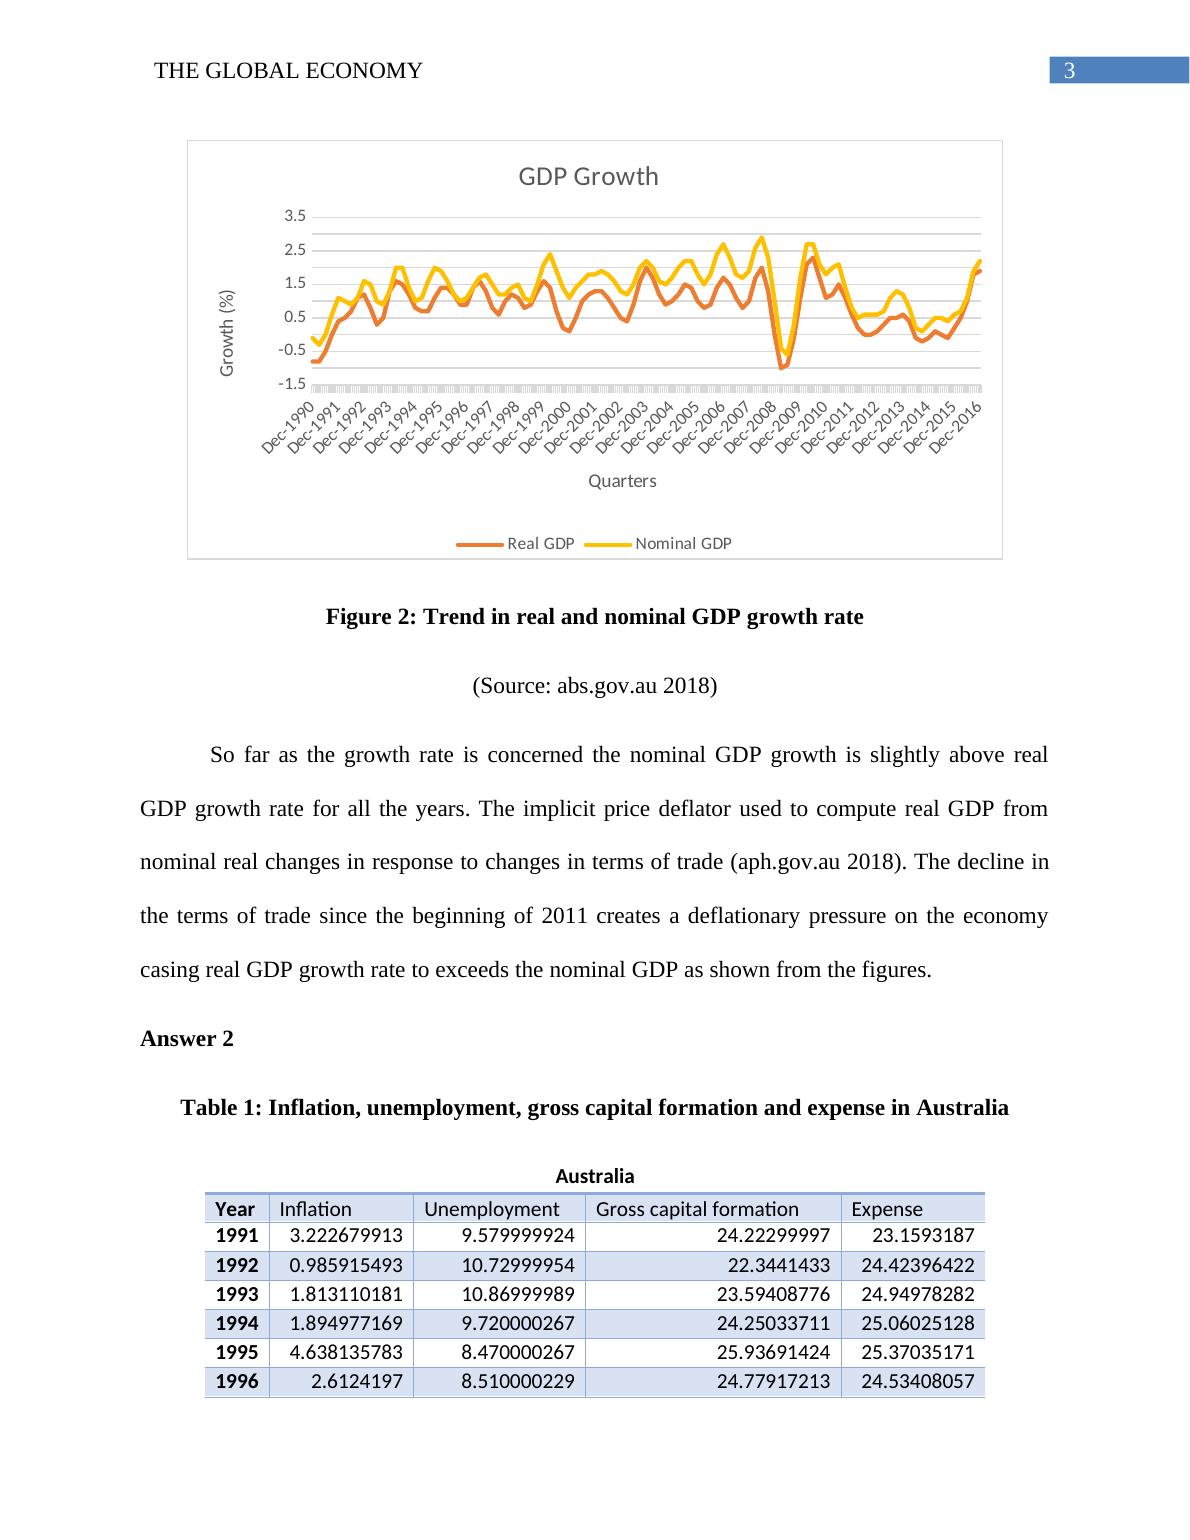
THE GLOBAL ECONOMY 419970.2504173628.35999965724.797127323.7807000919980.8534554547.67999982825.4656477721.3215607919991.4654282776.86999988626.0980676324.5338164320004.4751830766.2800002126.2765016724.0709583320014.3808411216.73999977123.4228275426.330303320023.003171056.36999988624.3996510326.4461144420032.7707352415.92999982825.925445425.834001820042.3436123355.38999986627.0608743325.6732918220052.6687327825.0300002127.425407325.6157859720063.5384873394.7800002127.6579485624.9206276120072.3323615164.38000011427.8458581624.4784999620084.3526432424.23000001929.1260076924.3173406420091.820112245.55999994327.9060256726.48235520102.8452256825.21000003827.552893726.7754033120113.3038501565.07999992427.1134155125.9692351820121.7627801565.2199997928.3266331126.2460440520132.4498886415.65999984728.4405075125.9832055620142.4879227056.07000017227.2049259726.4056505320151.5083667226.05999994326.7376451426.8622573920161.2769909455.7199997925.5370229827.03986551(Source: data.worldbank.org)Table 2: Inflation, unemployment, gross capital formation and expense in South KoreaSouth KoreaYearInflation UnemploymentGross capital formationExpense19919.32.41000008641.3740616513.379259319926.3063062.5099999938.4851980113.6291412719934.7457632.88000011437.4795411513.3348942519946.2567422.48000001938.539128913.4198706119954.4796952.05999994339.003294513.2959656819964.9234292.04999995239.6809624113.5174568419974.4468692.60999989537.4246790513.3378687319987.512086.96000003827.7618952815.6455078719990.8114486.34000015330.9162955915.2211619320002.2653334.42000007632.941714915.7895095420014.06642431.5595869516.7782429820022.7625113.27999997130.9395805915.9015875220033.5148793.55999994332.0149095717.8654388420043.5905913.67000007632.1170741217.8039440520052.754093.73000001932.1630646218.5488802820062.2418473.45000004832.7006879319.31135155
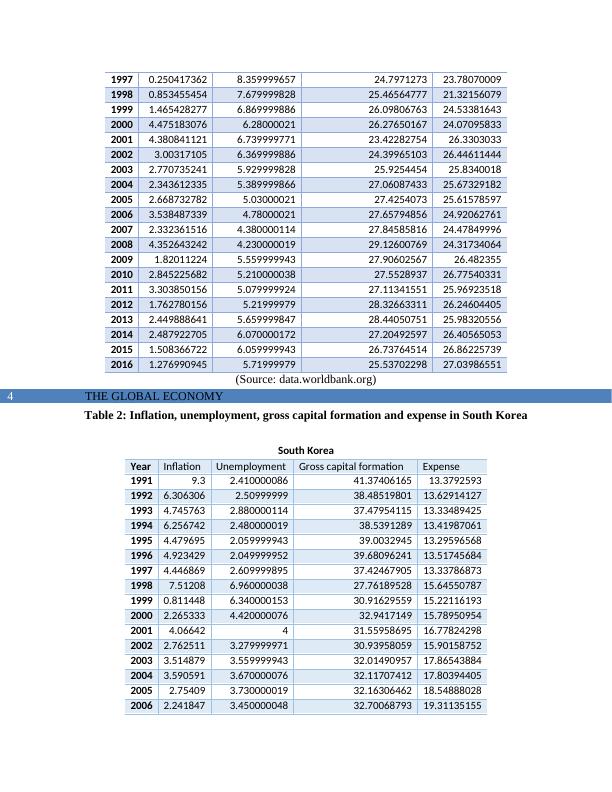
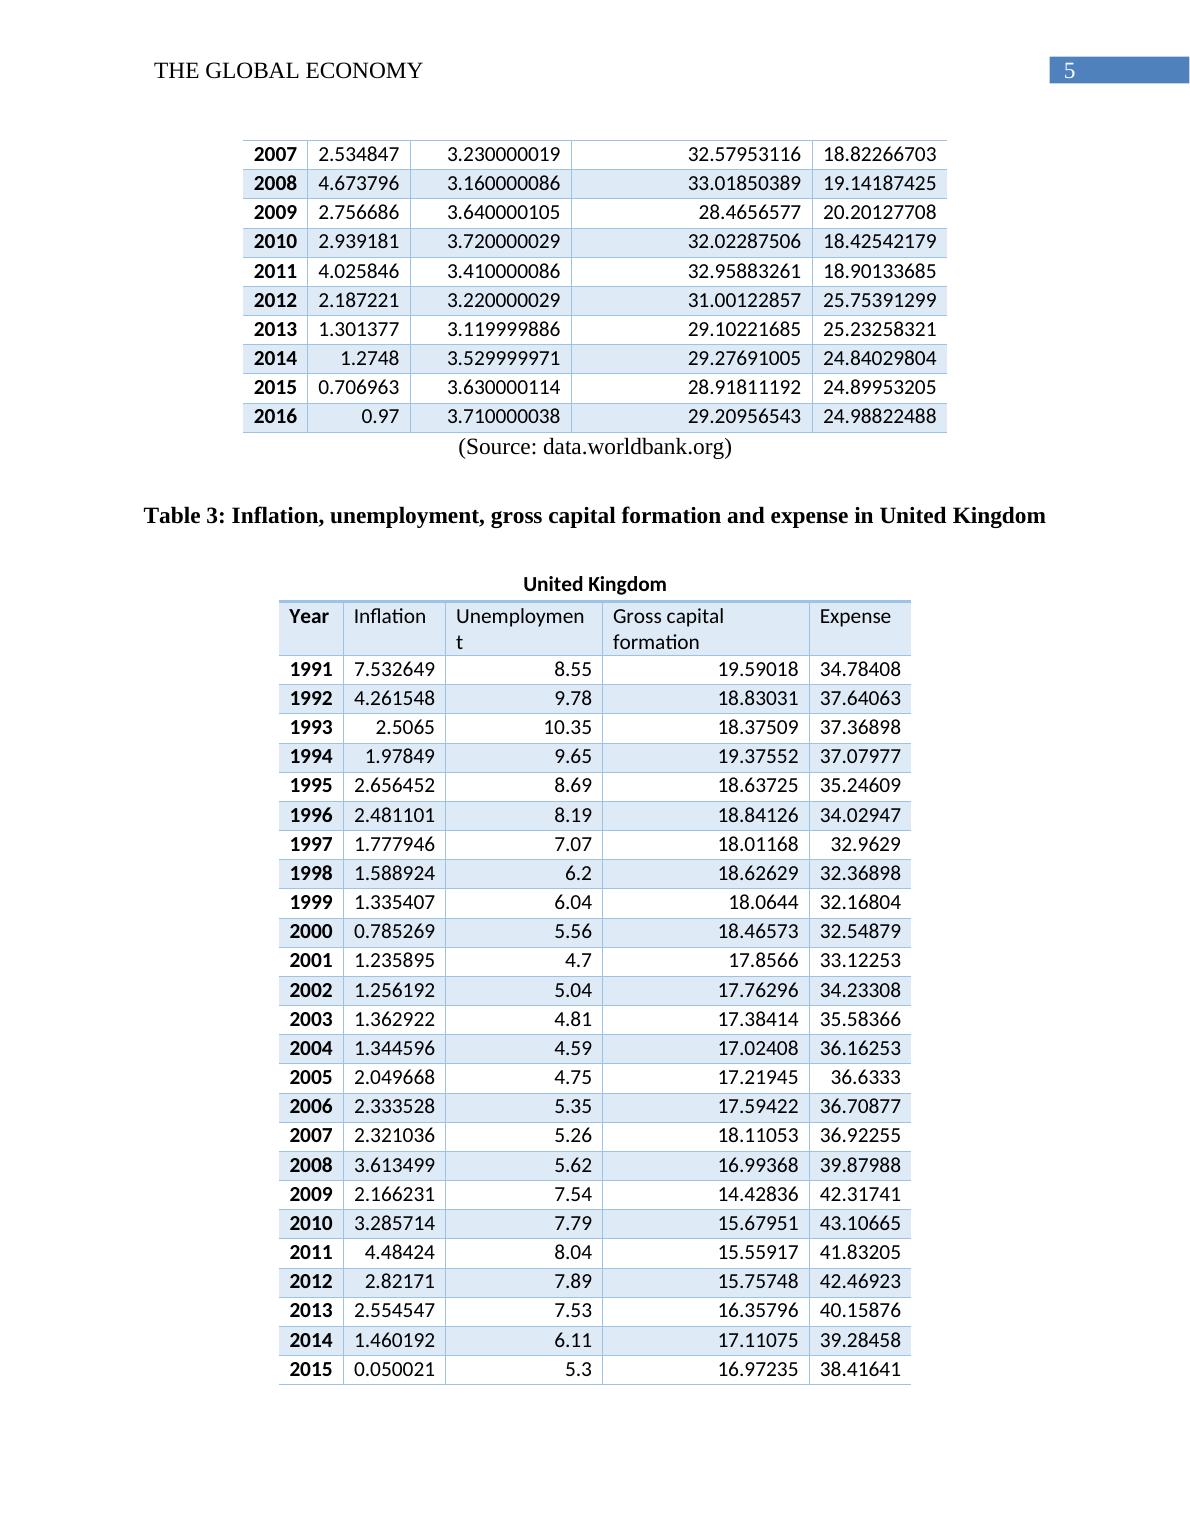
THE GLOBAL ECONOMY 520072.5348473.23000001932.5795311618.8226670320084.6737963.16000008633.0185038919.1418742520092.7566863.64000010528.465657720.2012770820102.9391813.72000002932.0228750618.4254217920114.0258463.41000008632.9588326118.9013368520122.1872213.22000002931.0012285725.7539129920131.3013773.11999988629.1022168525.2325832120141.27483.52999997129.2769100524.8402980420150.7069633.63000011428.9181119224.8995320520160.973.71000003829.2095654324.98822488(Source: data.worldbank.org)Table 3: Inflation, unemployment, gross capital formation and expense in United Kingdom United KingdomYearInflation UnemploymentGross capital formationExpense19917.5326498.5519.5901834.7840819924.2615489.7818.8303137.6406319932.506510.3518.3750937.3689819941.978499.6519.3755237.0797719952.6564528.6918.6372535.2460919962.4811018.1918.8412634.0294719971.7779467.0718.0116832.962919981.5889246.218.6262932.3689819991.3354076.0418.064432.1680420000.7852695.5618.4657332.5487920011.2358954.717.856633.1225320021.2561925.0417.7629634.2330820031.3629224.8117.3841435.5836620041.3445964.5917.0240836.1625320052.0496684.7517.2194536.633320062.3335285.3517.5942236.7087720072.3210365.2618.1105336.9225520083.6134995.6216.9936839.8798820092.1662317.5414.4283642.3174120103.2857147.7915.6795143.1066520114.484248.0415.5591741.8320520122.821717.8915.7574842.4692320132.5545477.5316.3579640.1587620141.4601926.1117.1107539.2845820150.0500215.316.9723538.41641
End of preview
Want to access all the pages? Upload your documents or become a member.
Related Documents
The GLOBAL ECONOMY 20 20 Running Headlg...
|22
|3600
|159
GLOBAL ECONOMY Global Economy Name of the Student Name of the Universitylg...
|27
|4035
|322
Online Library for Study Material with Solved Assignments - Deskliblg...
|23
|4338
|228
GDP per capita growth rate (in Y axis) Report 2022lg...
|19
|3893
|52
Report on America's Economylg...
|9
|1475
|46
Explaining the World Through Macroeconomic Analysislg...
|41
|11591
|34