The ratio between stress and strain
Added on 2022-09-13
32 Pages5460 Words28 Views
Laboratory Investigations 1
INTRODUCTION TO ENGINEERING MATERIALS
By Name
Course
Instructor
Institution
Location
Date
INTRODUCTION TO ENGINEERING MATERIALS
By Name
Course
Instructor
Institution
Location
Date
Laboratory Investigations 2
EXPERIMENT 1
OBJECTIVE
To determine the value of Young’s Elasticity Modulus of four different types of materials,
namely wood, coper, aluminium, and carbon steel.
INTRODUCTION
Young’s modulus is a property of a material that determine sits elasticity and stiffness. The ratio
between stress and strain is what determines the Young’s modulus. Strain is the ratio of
deflection length to the original length while stress is the ration of force to area. Young’s
modulus can be calculated by the use of material deflection when load is subjected. The beam
deflection is affected by how the beam is supported, force applied, the type of material, cross-
sectional shape, and the length.
APPARATUS
i. Brass
ii. Pure Copper
iii. Stainless steel
iv. Carbon steel
v. Extensometer
vi. Hounsfield Tensometer with 5kN beam
PROCEDURE
The first step is to accurately determine the diameters of the specimens (wood, coper,
aluminium, and carbon steel) as well as the cross-sectional areas of the specimens. The
specimens are then positioned in the extensometer and ensuring that the length of the gauge is
50mm. The collets are then connected on the specimen and then fixed into the tensometer. The
load is then adjusted on the mercury scale and then adjusting the extensometer so the light is just
Laboratory Investigations 3
extinguished. The readings of the indent and loadreading are then noted (Brožovský & Dufka,
2015). The same procedure is then performed four times and the results tabulated by labelling
the type of the material used. The same procedure was then performed for the remaining three
specimens and then the strain and stress determined for every result from every specimen. An
accurate graph of stress against strain was then plotted using suitable scale on graph papers
(Knowles, 2017). The slope of the graph was then determined by the use trigonometry which
represents the Young’s Elasticity modulus for every material. The result of the Young’s Modulus
was the compared with the data published.
RESULTS
The measurement of the test results are tabulated below:
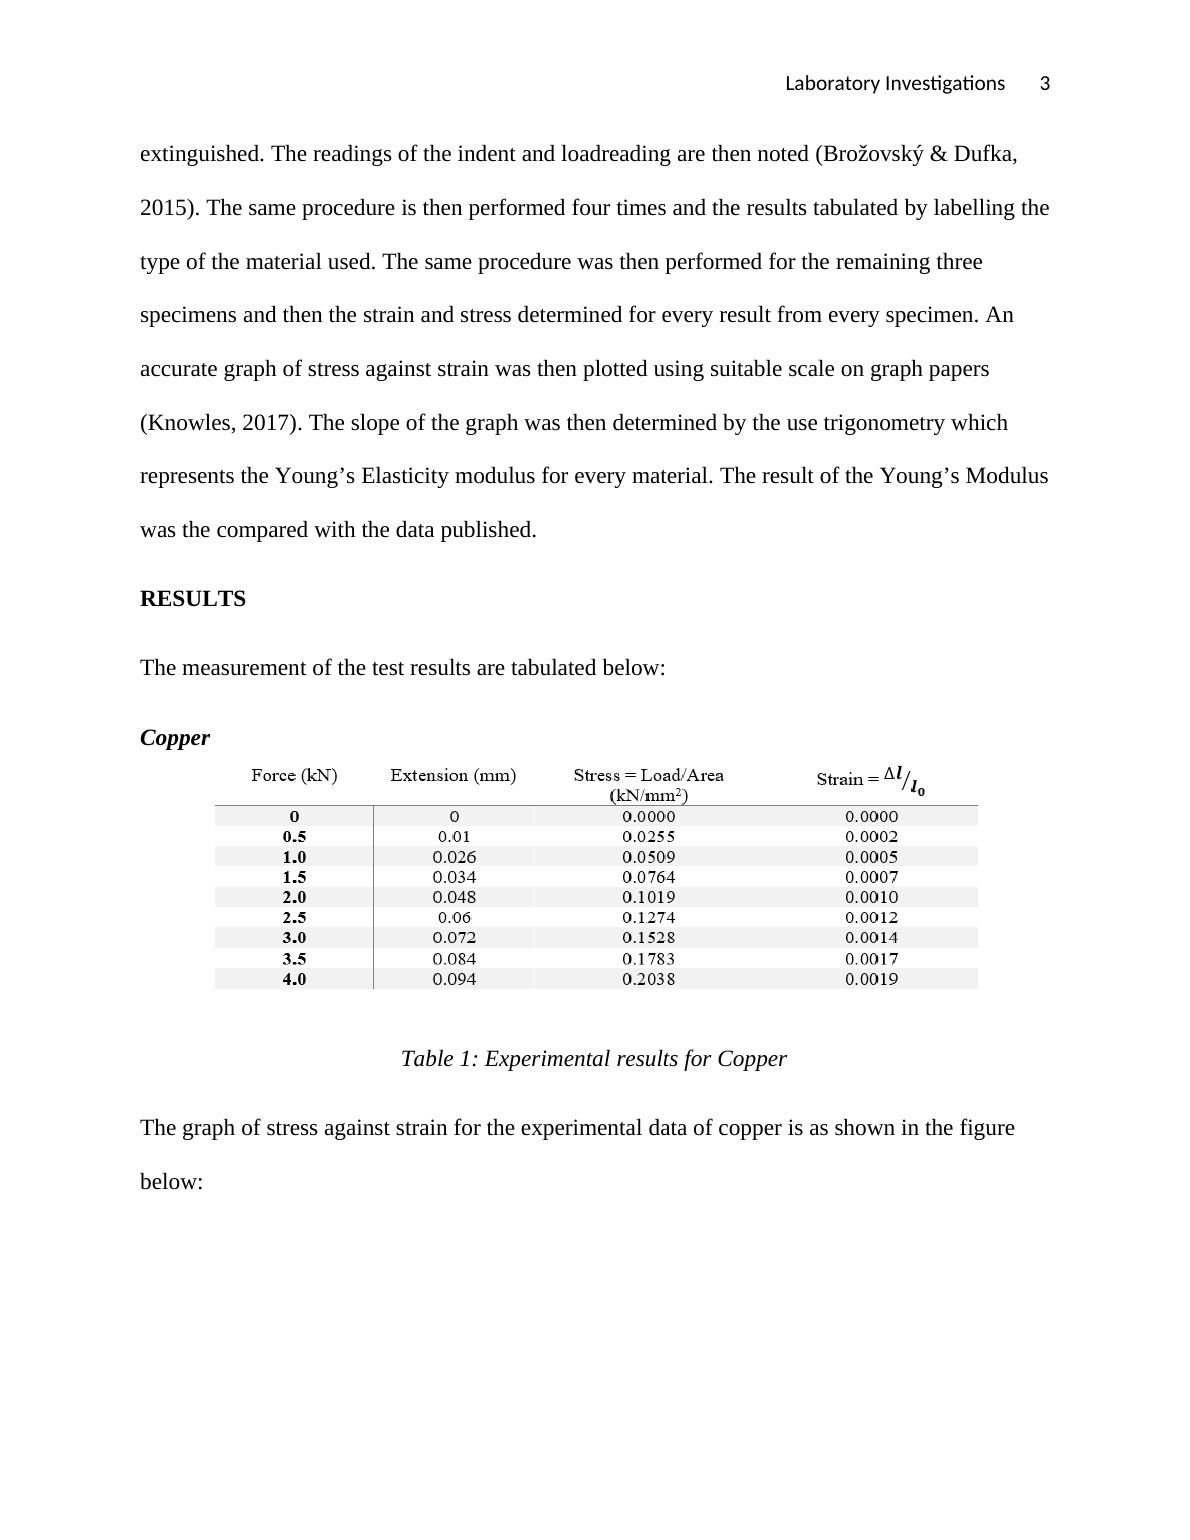
Copper
Table 1: Experimental results for Copper
The graph of stress against strain for the experimental data of copper is as shown in the figure
below:
extinguished. The readings of the indent and loadreading are then noted (Brožovský & Dufka,
2015). The same procedure is then performed four times and the results tabulated by labelling
the type of the material used. The same procedure was then performed for the remaining three
specimens and then the strain and stress determined for every result from every specimen. An
accurate graph of stress against strain was then plotted using suitable scale on graph papers
(Knowles, 2017). The slope of the graph was then determined by the use trigonometry which
represents the Young’s Elasticity modulus for every material. The result of the Young’s Modulus
was the compared with the data published.
RESULTS
The measurement of the test results are tabulated below:
Copper
Table 1: Experimental results for Copper
The graph of stress against strain for the experimental data of copper is as shown in the figure
below:
Laboratory Investigations 4
0 0 0
0
0.05
0.1
0.15
0.2
0.25
f(x) = 105.95 x + 0
Stress-Strain graph of Copper
Strain
Stress (N/mm^2)
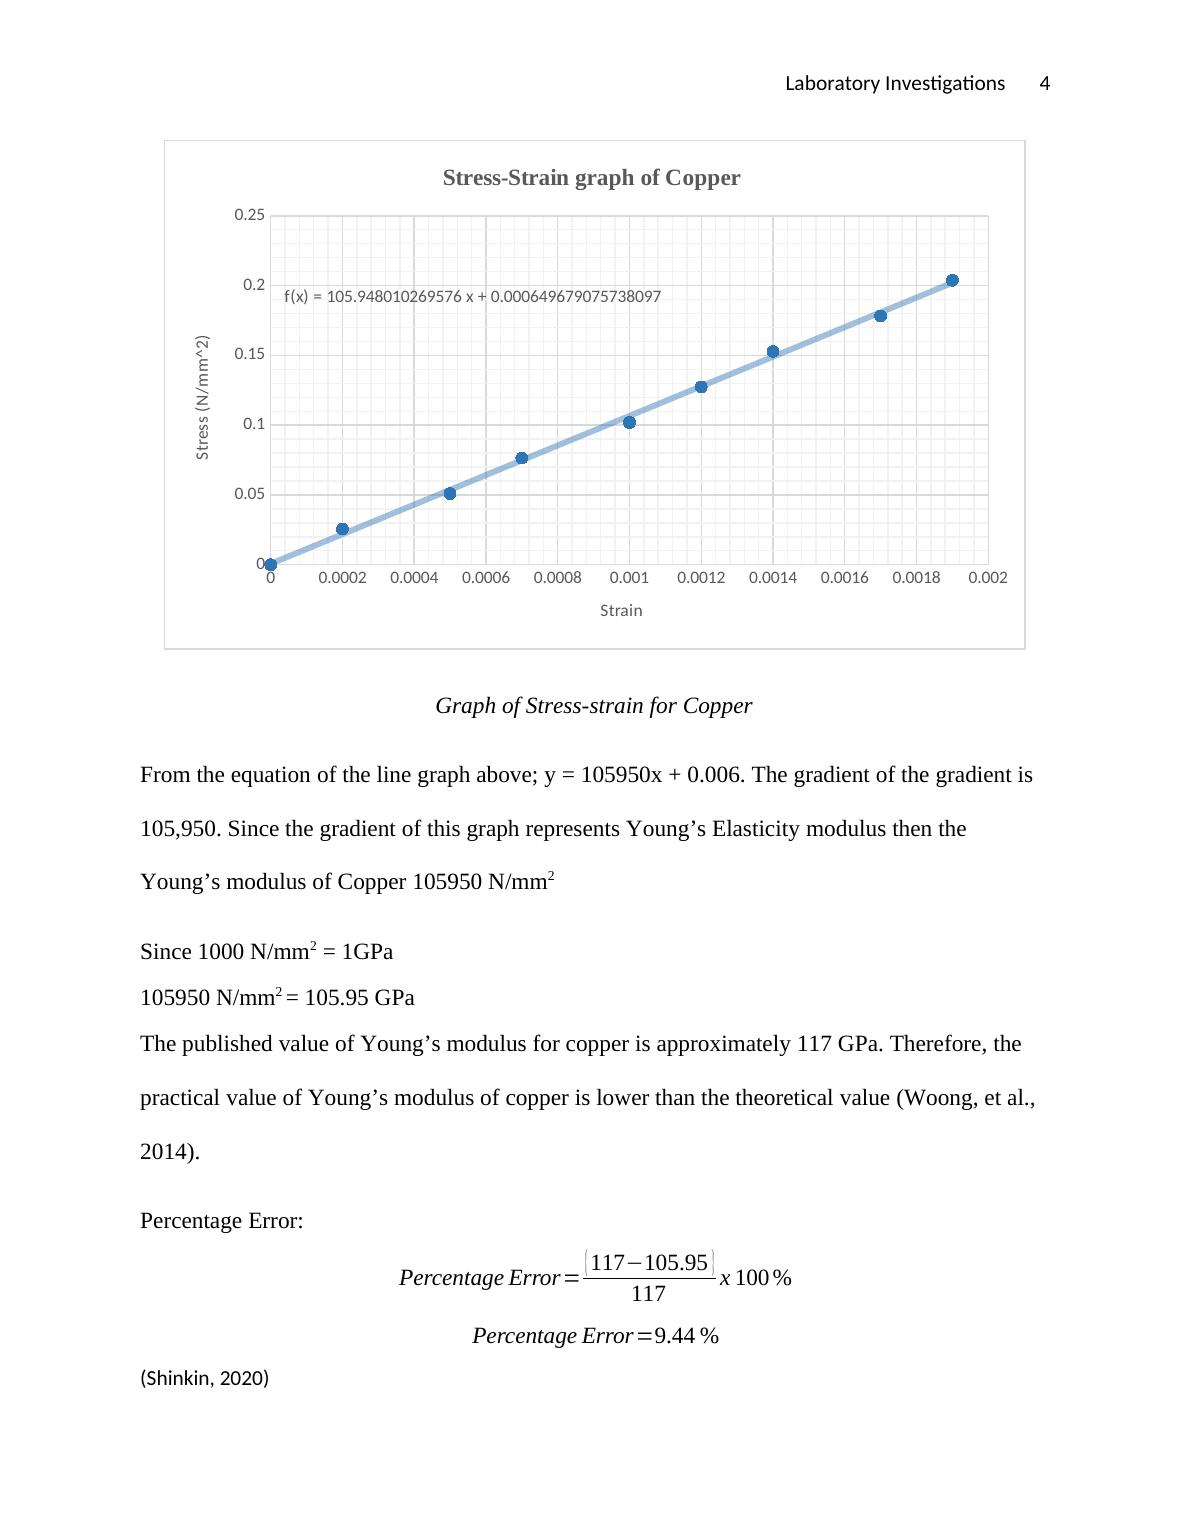
Graph of Stress-strain for Copper
From the equation of the line graph above; y = 105950x + 0.006. The gradient of the gradient is
105,950. Since the gradient of this graph represents Young’s Elasticity modulus then the
Young’s modulus of Copper 105950 N/mm2
Since 1000 N/mm2 = 1GPa
105950 N/mm2 = 105.95 GPa
The published value of Young’s modulus for copper is approximately 117 GPa. Therefore, the
practical value of Young’s modulus of copper is lower than the theoretical value (Woong, et
al., 2014).
Percentage Error:
Percentage Error= { 117−105.95 }
117 x 100 %
Percentage Error=9.44 %
(Shinkin, 2020)
0 0 0
0
0.05
0.1
0.15
0.2
0.25
f(x) = 105.95 x + 0
Stress-Strain graph of Copper
Strain
Stress (N/mm^2)
Graph of Stress-strain for Copper
From the equation of the line graph above; y = 105950x + 0.006. The gradient of the gradient is
105,950. Since the gradient of this graph represents Young’s Elasticity modulus then the
Young’s modulus of Copper 105950 N/mm2
Since 1000 N/mm2 = 1GPa
105950 N/mm2 = 105.95 GPa
The published value of Young’s modulus for copper is approximately 117 GPa. Therefore, the
practical value of Young’s modulus of copper is lower than the theoretical value (Woong, et
al., 2014).
Percentage Error:
Percentage Error= { 117−105.95 }
117 x 100 %
Percentage Error=9.44 %
(Shinkin, 2020)
Laboratory Investigations 5
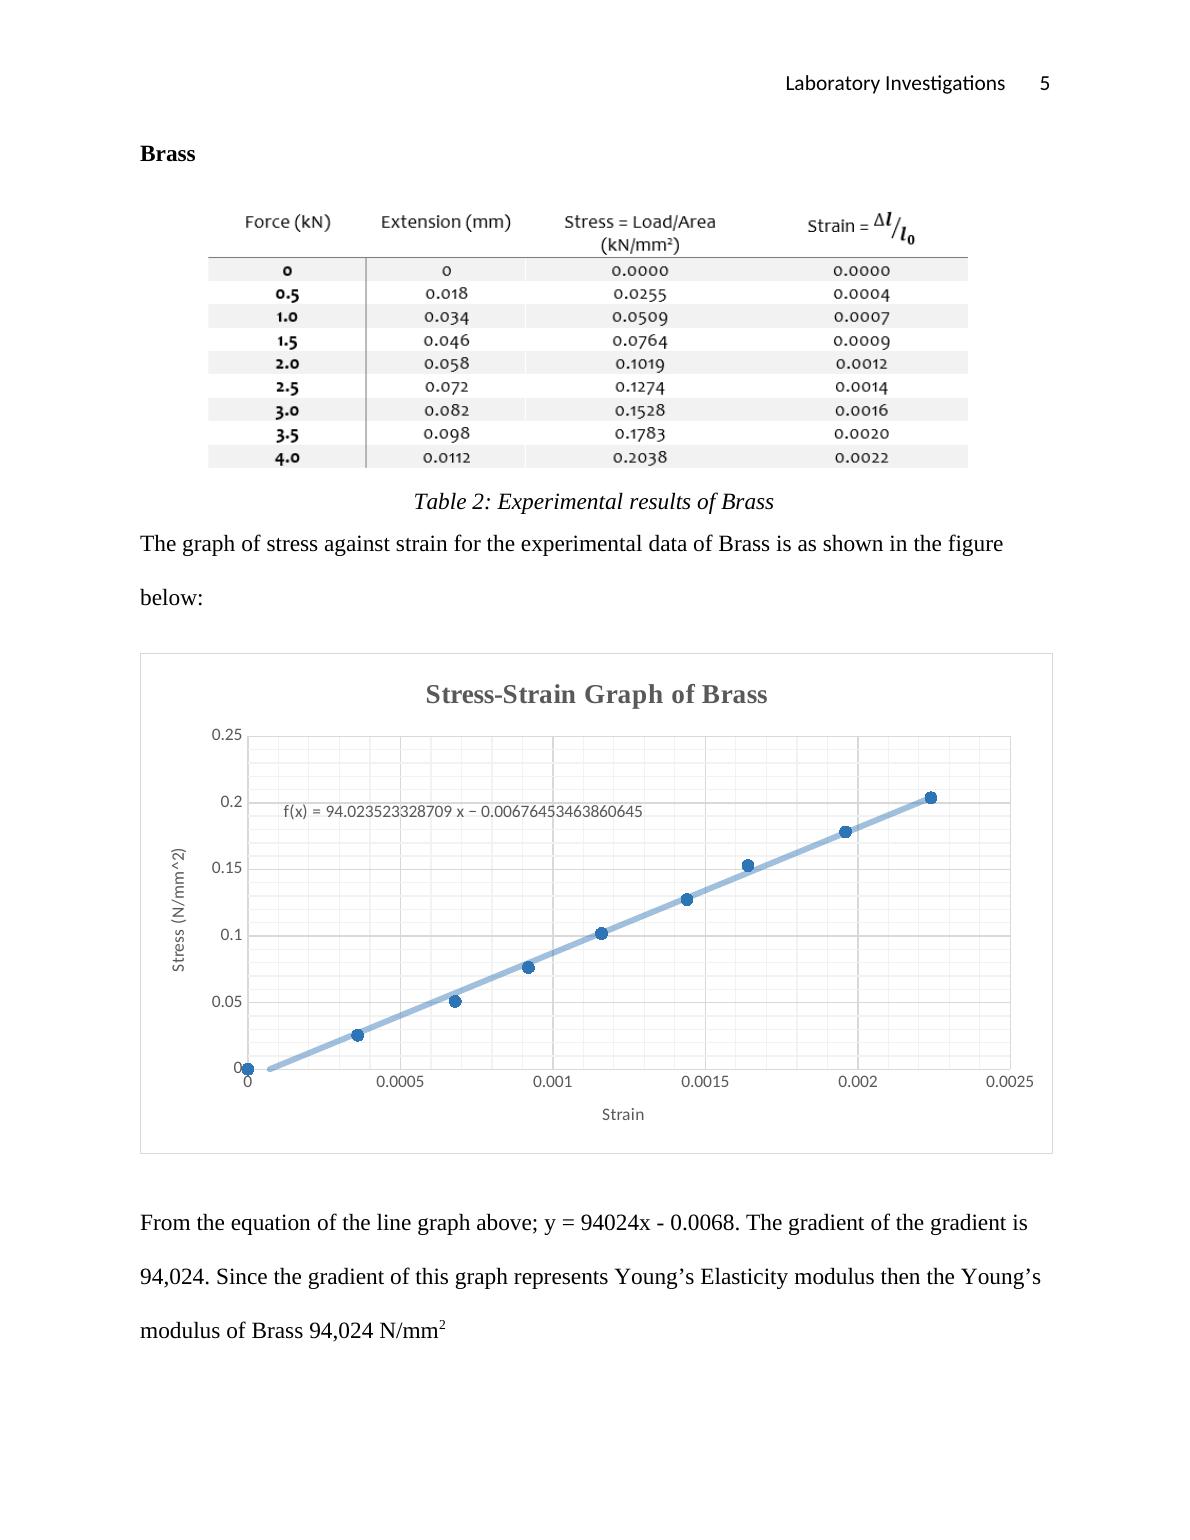
Brass
Table 2: Experimental results of Brass
The graph of stress against strain for the experimental data of Brass is as shown in the figure
below:
0 0 0
0
0.05
0.1
0.15
0.2
0.25
f(x) = 94.02 x − 0.01
Stress-Strain Graph of Brass
Strain
Stress (N/mm^2)
From the equation of the line graph above; y = 94024x - 0.0068. The gradient of the gradient is
94,024. Since the gradient of this graph represents Young’s Elasticity modulus then the Young’s
modulus of Brass 94,024 N/mm2
Laboratory Investigations 6
Since 1000 N/mm2 = 1GPa
94,024 N/mm2 = 94.024 GPa
The published value of Young’s modulus for Brass is approximately 125 GPa. Therefore, the
practical value of Young’s modulus of Brass is lower than the theoretical value (Werner, et al.,
2013).
Percentage Error:
Percentage Error= { 125−94.024 }
125 x 100 %= 30.976
125 x 100 %
Percentage Error=24.78 %
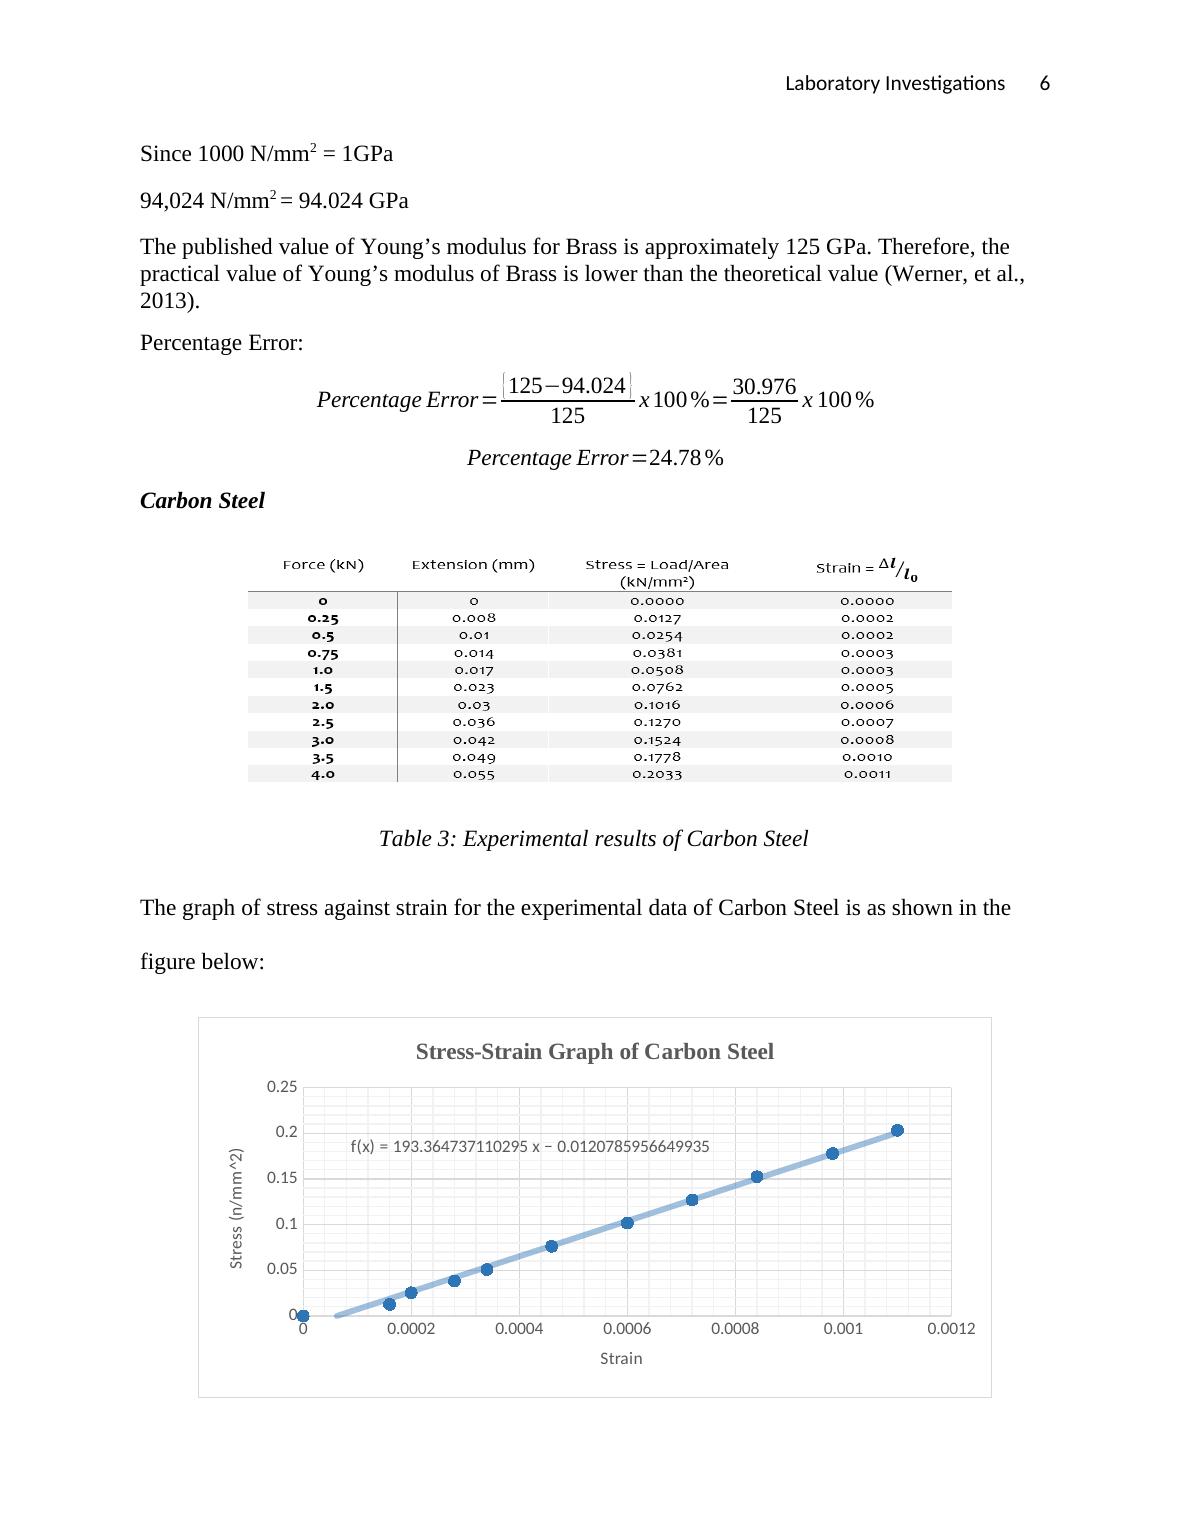
Carbon Steel
Table 3: Experimental results of Carbon Steel
The graph of stress against strain for the experimental data of Carbon Steel is as shown in the
figure below:
0 0 0
0
0.05
0.1
0.15
0.2
0.25
f(x) = 193.36 x − 0.01
Stress-Strain Graph of Carbon Steel
Strain
Stress (n/mm^2)
Since 1000 N/mm2 = 1GPa
94,024 N/mm2 = 94.024 GPa
The published value of Young’s modulus for Brass is approximately 125 GPa. Therefore, the
practical value of Young’s modulus of Brass is lower than the theoretical value (Werner, et al.,
2013).
Percentage Error:
Percentage Error= { 125−94.024 }
125 x 100 %= 30.976
125 x 100 %
Percentage Error=24.78 %
Carbon Steel
Table 3: Experimental results of Carbon Steel
The graph of stress against strain for the experimental data of Carbon Steel is as shown in the
figure below:
0 0 0
0
0.05
0.1
0.15
0.2
0.25
f(x) = 193.36 x − 0.01
Stress-Strain Graph of Carbon Steel
Strain
Stress (n/mm^2)
Laboratory Investigations 7
From the equation of the line graph above; y = 193360x - 0.0068. The gradient of the gradient is
193,360. Since the gradient of this graph represents Young’s Elasticity modulus then the
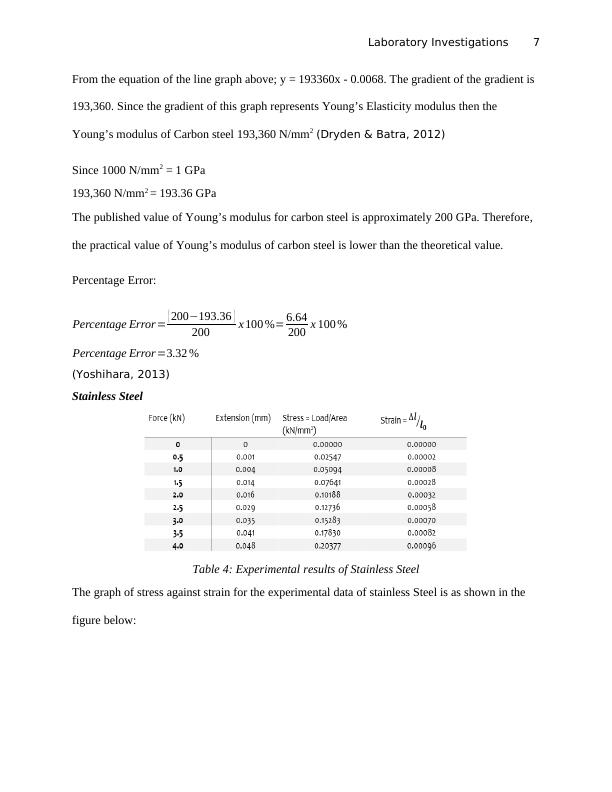
Young’s modulus of Carbon steel 193,360 N/mm2 (Dryden & Batra, 2012)
Since 1000 N/mm2 = 1 GPa
193,360 N/mm2 = 193.36 GPa
The published value of Young’s modulus for carbon steel is approximately 200 GPa. Therefore,
the practical value of Young’s modulus of carbon steel is lower than the theoretical value.
Percentage Error:
Percentage Error= { 200−193.36 }
200 x 100 %= 6.64
200 x 100 %
Percentage Error=3.32 %
(Yoshihara, 2013)
Stainless Steel
Table 4: Experimental results of Stainless Steel
The graph of stress against strain for the experimental data of stainless Steel is as shown in the
figure below:
From the equation of the line graph above; y = 193360x - 0.0068. The gradient of the gradient is
193,360. Since the gradient of this graph represents Young’s Elasticity modulus then the
Young’s modulus of Carbon steel 193,360 N/mm2 (Dryden & Batra, 2012)
Since 1000 N/mm2 = 1 GPa
193,360 N/mm2 = 193.36 GPa
The published value of Young’s modulus for carbon steel is approximately 200 GPa. Therefore,
the practical value of Young’s modulus of carbon steel is lower than the theoretical value.
Percentage Error:
Percentage Error= { 200−193.36 }
200 x 100 %= 6.64
200 x 100 %
Percentage Error=3.32 %
(Yoshihara, 2013)
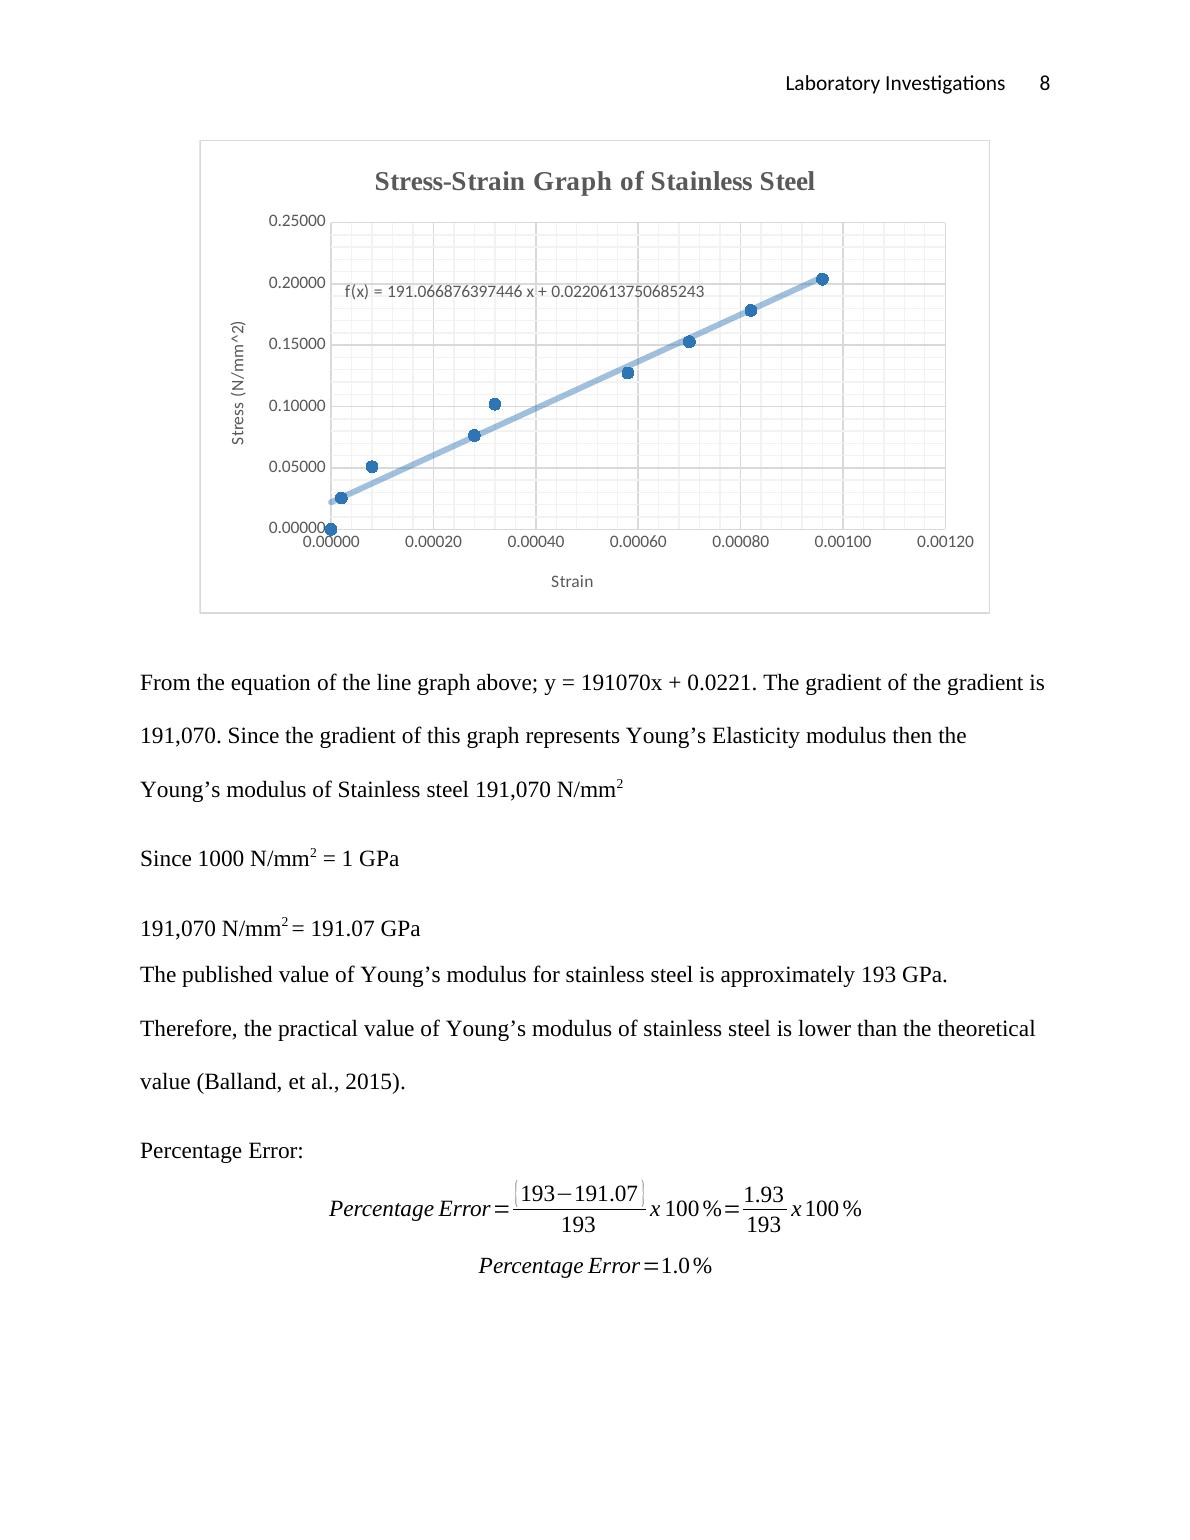
Stainless Steel
Table 4: Experimental results of Stainless Steel
The graph of stress against strain for the experimental data of stainless Steel is as shown in the
figure below:
Laboratory Investigations 8
0.00000 0.00020 0.00040 0.00060 0.00080 0.00100 0.00120
0.00000
0.05000
0.10000
0.15000
0.20000
0.25000
f(x) = 191.07 x + 0.02
Stress-Strain Graph of Stainless Steel
Strain
Stress (N/mm^2)
From the equation of the line graph above; y = 191070x + 0.0221. The gradient of the gradient is
191,070. Since the gradient of this graph represents Young’s Elasticity modulus then the
Young’s modulus of Stainless steel 191,070 N/mm2
Since 1000 N/mm2 = 1 GPa
191,070 N/mm2 = 191.07 GPa
The published value of Young’s modulus for stainless steel is approximately 193 GPa.
Therefore, the practical value of Young’s modulus of stainless steel is lower than the theoretical
value (Balland, et al., 2015).
Percentage Error:
Percentage Error= { 193−191.07 }
193 x 100 %=1.93
193 x 100 %
Percentage Error=1.0 %
End of preview
Want to access all the pages? Upload your documents or become a member.
Related Documents
Assessment | Testing of Materials. table of contentslg...
|16
|2686
|15
Stiffness of Materials Lab Report: Theory, Experiment, Results and Analysislg...
|10
|1615
|362
Materials Selection Assessment 2022lg...
|7
|1886
|20
Experimental Analysis for Determining Stiffness and Moment of Inertialg...
|16
|1792
|214
Flexural Beams Lab Report: Determining Strength and Moduluslg...
|13
|1701
|338
Tensile Testing of Materials: Mechanical Properties of Metalslg...
|6
|1240
|41