Management Accounting: Variance Analysis and Decision Making
VerifiedAdded on 2023/01/09
|12
|3395
|78
AI Summary
This document provides an overview of variance analysis in management accounting and its impact on decision making. It covers topics such as sales price and sales volume contribution variance, material price planning and operational variance, and the advantages and disadvantages of using variances. The case study of XLG is included to illustrate the concepts discussed.
Contribute Materials
Your contribution can guide someone’s learning journey. Share your
documents today.

MANAGEMENT
ACCOUNTING
ACCOUNTING
Secure Best Marks with AI Grader
Need help grading? Try our AI Grader for instant feedback on your assignments.
TABLE OF CONTENTS
INTRODUCTION...........................................................................................................................3
MAIN BODY..................................................................................................................................3
PART A...........................................................................................................................................3
Sales price and sales volume contribution variance....................................................................3
Material price planning and material price operational variance................................................5
Advantages and disadvantages of using variances......................................................................7
PART B...........................................................................................................................................9
Assessment of the make or buy decision for XLG......................................................................9
CONCLUSION................................................................................................................................9
REFERENCES..............................................................................................................................10
INTRODUCTION
Management accounting is a very broad field that involves the overall management and
preparation of the different aspects associated with the costing etc. In this field, variance
analysis is of key importance that adds in the overall value of the business. The difference
between the standards that were set and the actual that is achieved is basically computed in
variance analysis (Rosyidi, 2019). In this report, the case study of XLG will be evaluated in
context of the different variances whose implementation will help in decision making. Further
the positive and negative aspects of using variance analysis will also be illustrated in the report.
MAIN BODY
PART A
Sales price and sales volume contribution variance
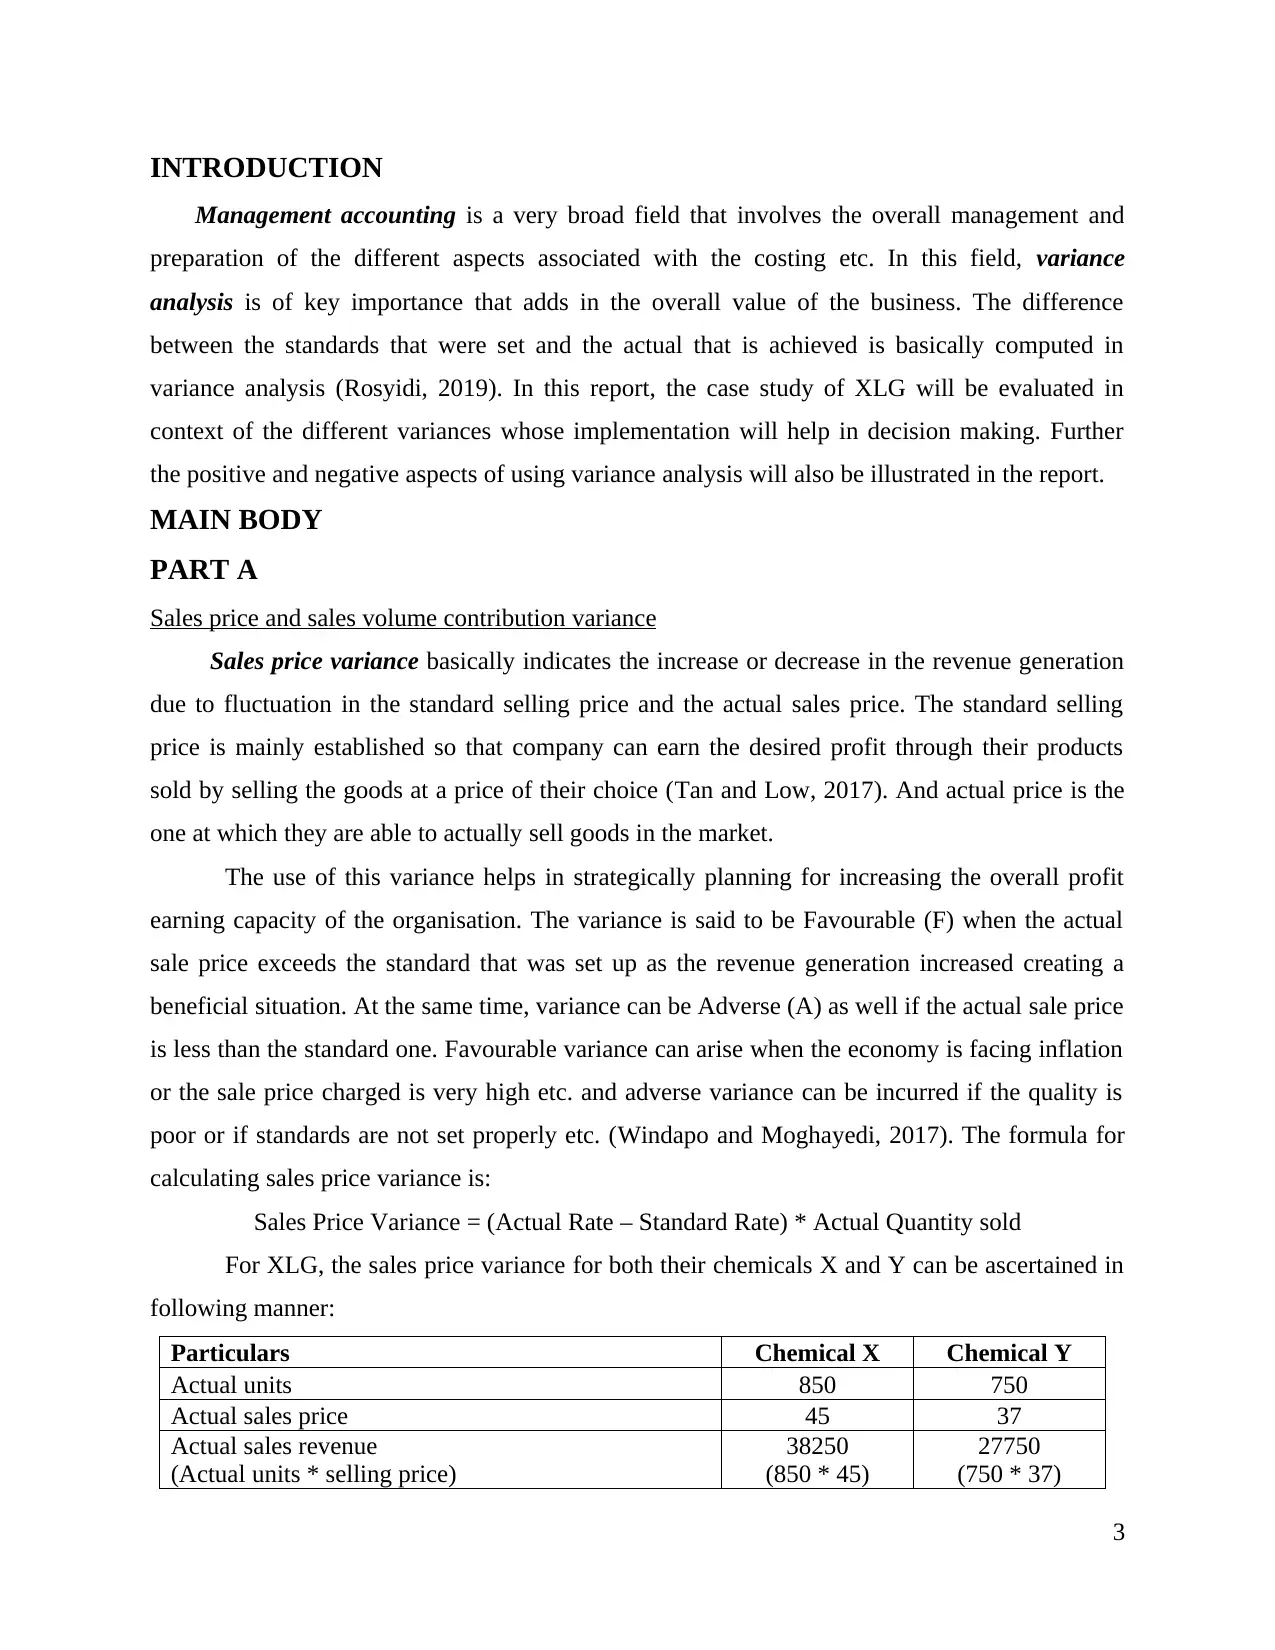
Sales price variance basically indicates the increase or decrease in the revenue generation
due to fluctuation in the standard selling price and the actual sales price. The standard selling
price is mainly established so that company can earn the desired profit through their products
sold by selling the goods at a price of their choice (Tan and Low, 2017). And actual price is the
one at which they are able to actually sell goods in the market.
The use of this variance helps in strategically planning for increasing the overall profit
earning capacity of the organisation. The variance is said to be Favourable (F) when the actual
sale price exceeds the standard that was set up as the revenue generation increased creating a
beneficial situation. At the same time, variance can be Adverse (A) as well if the actual sale price
is less than the standard one. Favourable variance can arise when the economy is facing inflation
or the sale price charged is very high etc. and adverse variance can be incurred if the quality is
poor or if standards are not set properly etc. (Windapo and Moghayedi, 2017). The formula for
calculating sales price variance is:
Sales Price Variance = (Actual Rate – Standard Rate) * Actual Quantity sold
For XLG, the sales price variance for both their chemicals X and Y can be ascertained in
following manner:
Particulars Chemical X Chemical Y
Actual units 850 750
Actual sales price 45 37
Actual sales revenue
(Actual units * selling price)
38250
(850 * 45)
27750
(750 * 37)
3
Management accounting is a very broad field that involves the overall management and
preparation of the different aspects associated with the costing etc. In this field, variance
analysis is of key importance that adds in the overall value of the business. The difference
between the standards that were set and the actual that is achieved is basically computed in
variance analysis (Rosyidi, 2019). In this report, the case study of XLG will be evaluated in
context of the different variances whose implementation will help in decision making. Further
the positive and negative aspects of using variance analysis will also be illustrated in the report.
MAIN BODY
PART A
Sales price and sales volume contribution variance
Sales price variance basically indicates the increase or decrease in the revenue generation
due to fluctuation in the standard selling price and the actual sales price. The standard selling
price is mainly established so that company can earn the desired profit through their products
sold by selling the goods at a price of their choice (Tan and Low, 2017). And actual price is the
one at which they are able to actually sell goods in the market.
The use of this variance helps in strategically planning for increasing the overall profit
earning capacity of the organisation. The variance is said to be Favourable (F) when the actual
sale price exceeds the standard that was set up as the revenue generation increased creating a
beneficial situation. At the same time, variance can be Adverse (A) as well if the actual sale price
is less than the standard one. Favourable variance can arise when the economy is facing inflation
or the sale price charged is very high etc. and adverse variance can be incurred if the quality is
poor or if standards are not set properly etc. (Windapo and Moghayedi, 2017). The formula for
calculating sales price variance is:
Sales Price Variance = (Actual Rate – Standard Rate) * Actual Quantity sold
For XLG, the sales price variance for both their chemicals X and Y can be ascertained in
following manner:
Particulars Chemical X Chemical Y
Actual units 850 750
Actual sales price 45 37
Actual sales revenue
(Actual units * selling price)
38250
(850 * 45)
27750
(750 * 37)
3
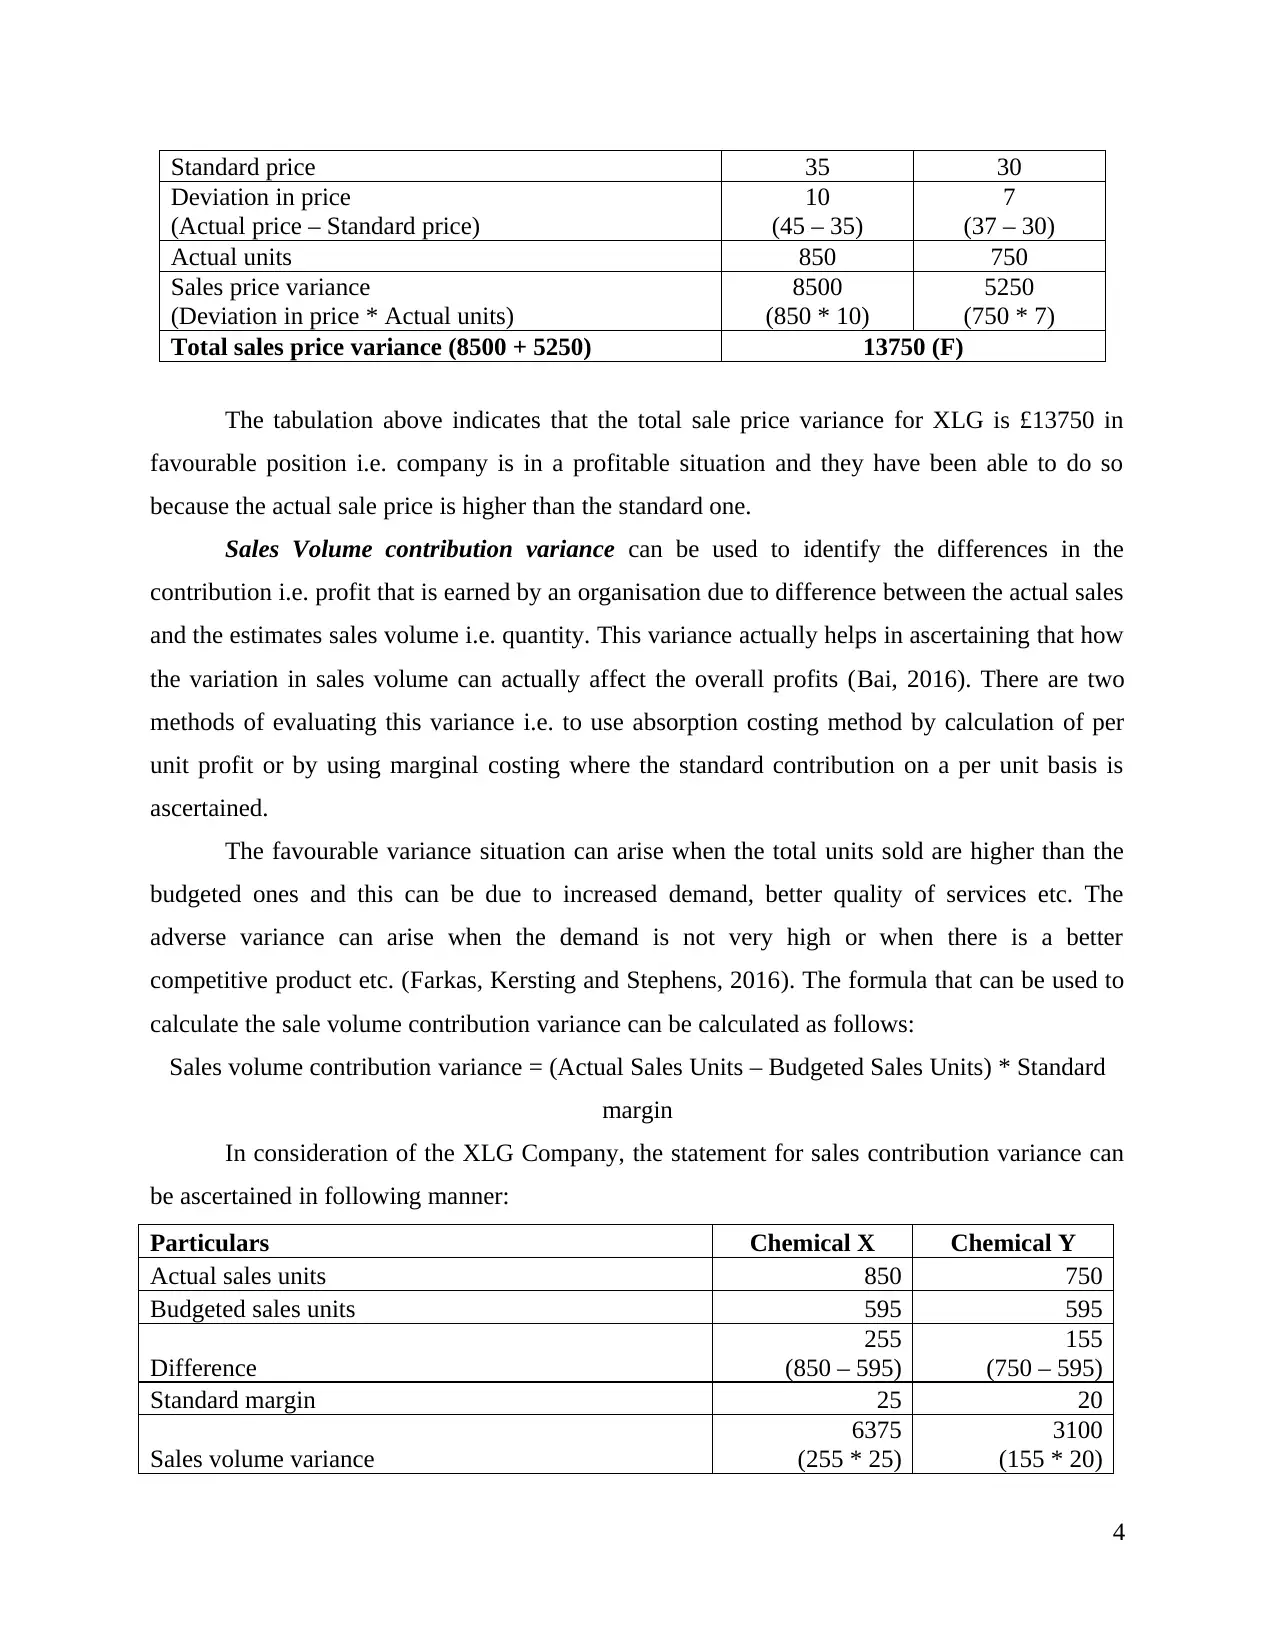
Standard price 35 30
Deviation in price
(Actual price – Standard price)
10
(45 – 35)
7
(37 – 30)
Actual units 850 750
Sales price variance
(Deviation in price * Actual units)
8500
(850 * 10)
5250
(750 * 7)
Total sales price variance (8500 + 5250) 13750 (F)
The tabulation above indicates that the total sale price variance for XLG is £13750 in
favourable position i.e. company is in a profitable situation and they have been able to do so
because the actual sale price is higher than the standard one.
Sales Volume contribution variance can be used to identify the differences in the
contribution i.e. profit that is earned by an organisation due to difference between the actual sales
and the estimates sales volume i.e. quantity. This variance actually helps in ascertaining that how
the variation in sales volume can actually affect the overall profits (Bai, 2016). There are two
methods of evaluating this variance i.e. to use absorption costing method by calculation of per
unit profit or by using marginal costing where the standard contribution on a per unit basis is
ascertained.
The favourable variance situation can arise when the total units sold are higher than the
budgeted ones and this can be due to increased demand, better quality of services etc. The
adverse variance can arise when the demand is not very high or when there is a better
competitive product etc. (Farkas, Kersting and Stephens, 2016). The formula that can be used to
calculate the sale volume contribution variance can be calculated as follows:
Sales volume contribution variance = (Actual Sales Units – Budgeted Sales Units) * Standard
margin
In consideration of the XLG Company, the statement for sales contribution variance can
be ascertained in following manner:
Particulars Chemical X Chemical Y
Actual sales units 850 750
Budgeted sales units 595 595
Difference
255
(850 – 595)
155
(750 – 595)
Standard margin 25 20
Sales volume variance
6375
(255 * 25)
3100
(155 * 20)
4
Secure Best Marks with AI Grader
Need help grading? Try our AI Grader for instant feedback on your assignments.
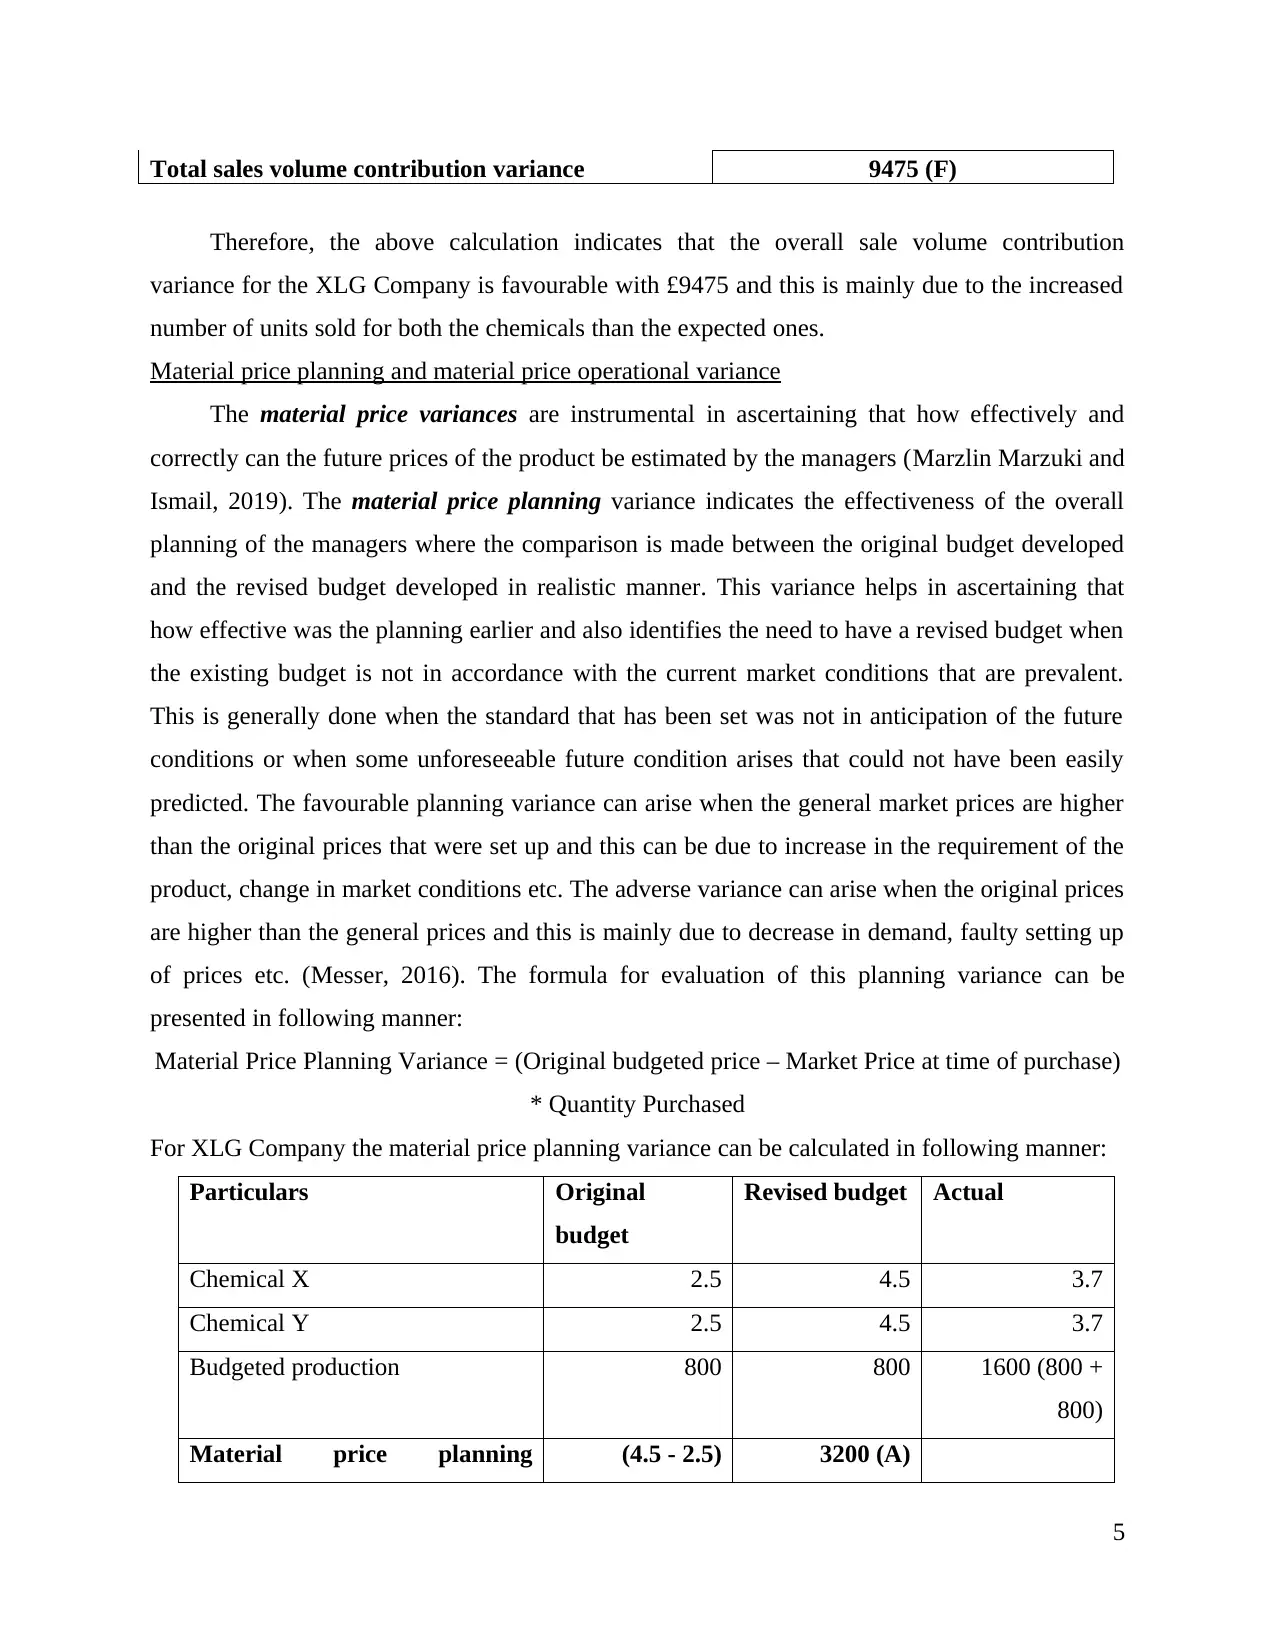
Total sales volume contribution variance 9475 (F)
Therefore, the above calculation indicates that the overall sale volume contribution
variance for the XLG Company is favourable with £9475 and this is mainly due to the increased
number of units sold for both the chemicals than the expected ones.
Material price planning and material price operational variance
The material price variances are instrumental in ascertaining that how effectively and
correctly can the future prices of the product be estimated by the managers (Marzlin Marzuki and
Ismail, 2019). The material price planning variance indicates the effectiveness of the overall
planning of the managers where the comparison is made between the original budget developed
and the revised budget developed in realistic manner. This variance helps in ascertaining that
how effective was the planning earlier and also identifies the need to have a revised budget when
the existing budget is not in accordance with the current market conditions that are prevalent.
This is generally done when the standard that has been set was not in anticipation of the future
conditions or when some unforeseeable future condition arises that could not have been easily
predicted. The favourable planning variance can arise when the general market prices are higher
than the original prices that were set up and this can be due to increase in the requirement of the
product, change in market conditions etc. The adverse variance can arise when the original prices
are higher than the general prices and this is mainly due to decrease in demand, faulty setting up
of prices etc. (Messer, 2016). The formula for evaluation of this planning variance can be
presented in following manner:
Material Price Planning Variance = (Original budgeted price – Market Price at time of purchase)
* Quantity Purchased
For XLG Company the material price planning variance can be calculated in following manner:
Particulars Original
budget
Revised budget Actual
Chemical X 2.5 4.5 3.7
Chemical Y 2.5 4.5 3.7
Budgeted production 800 800 1600 (800 +
800)
Material price planning (4.5 - 2.5) 3200 (A)
5
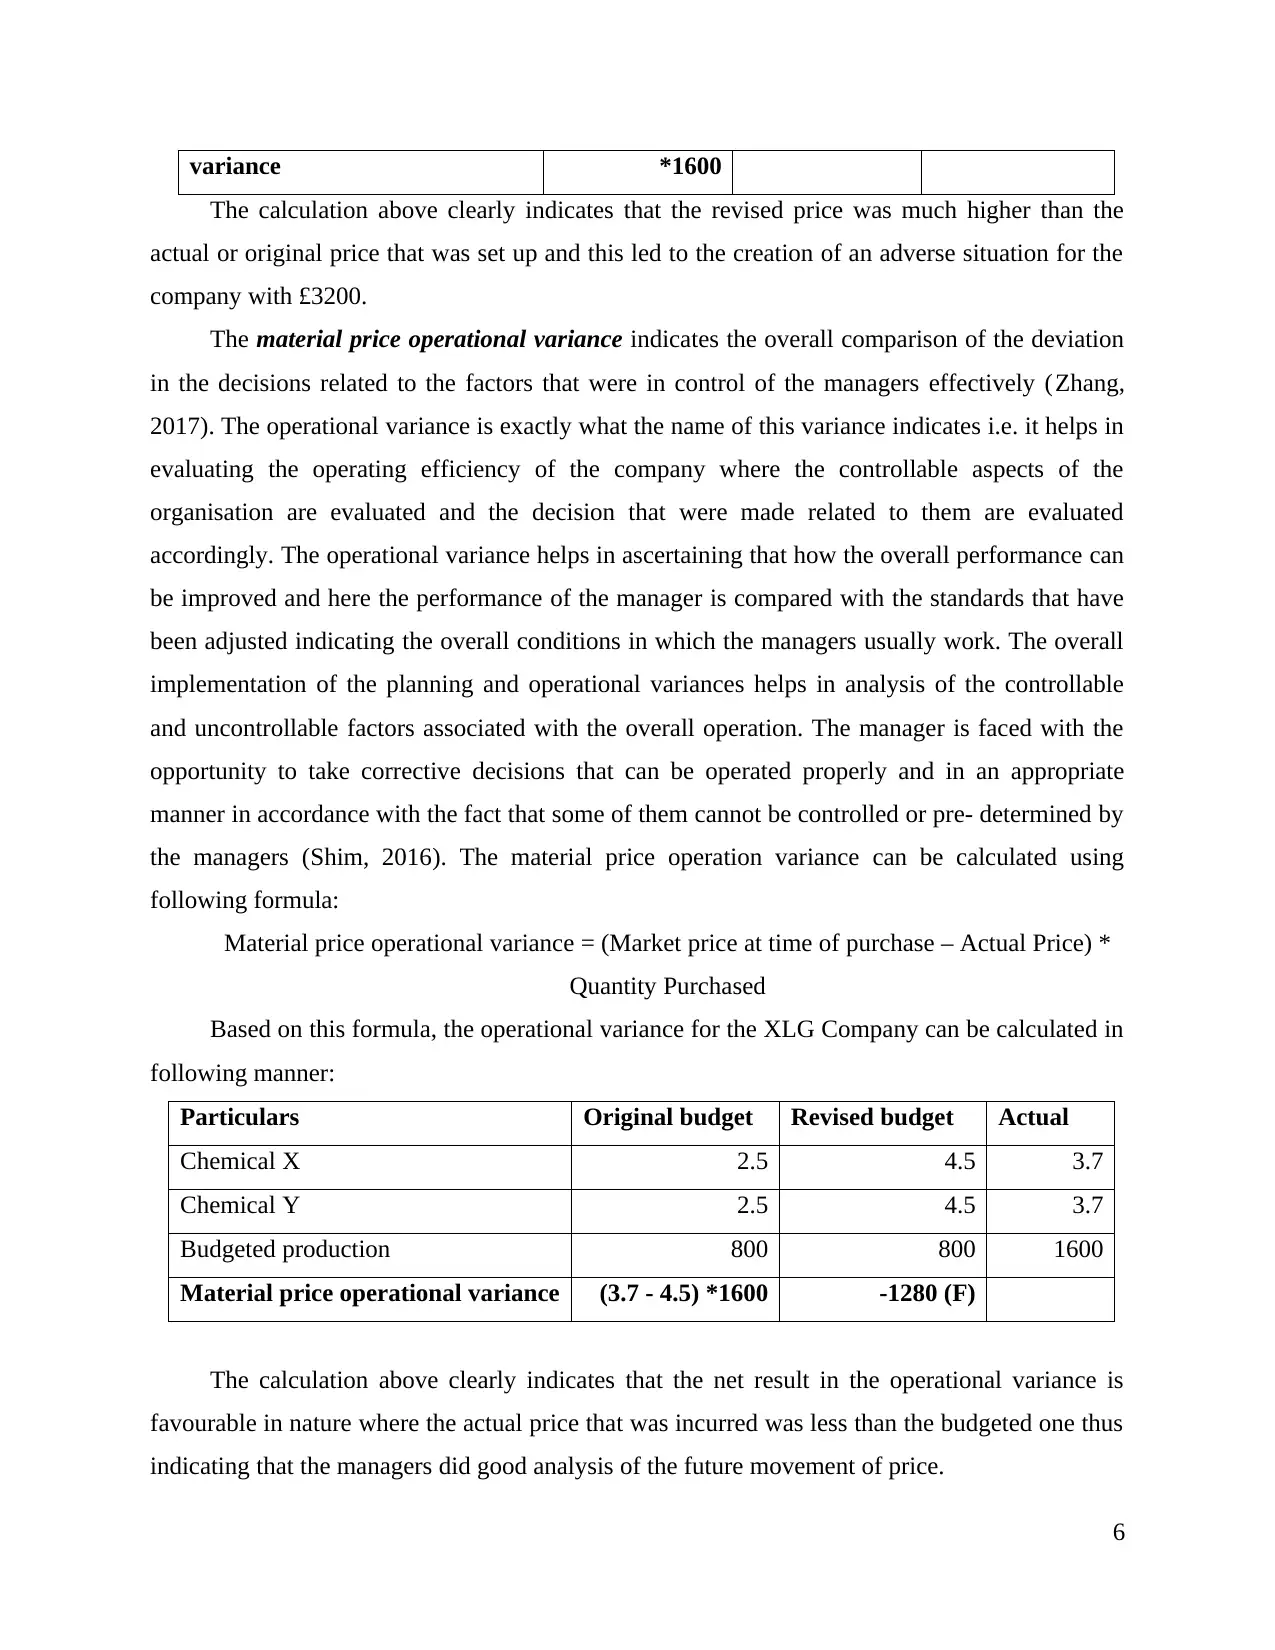
variance *1600
The calculation above clearly indicates that the revised price was much higher than the
actual or original price that was set up and this led to the creation of an adverse situation for the
company with £3200.
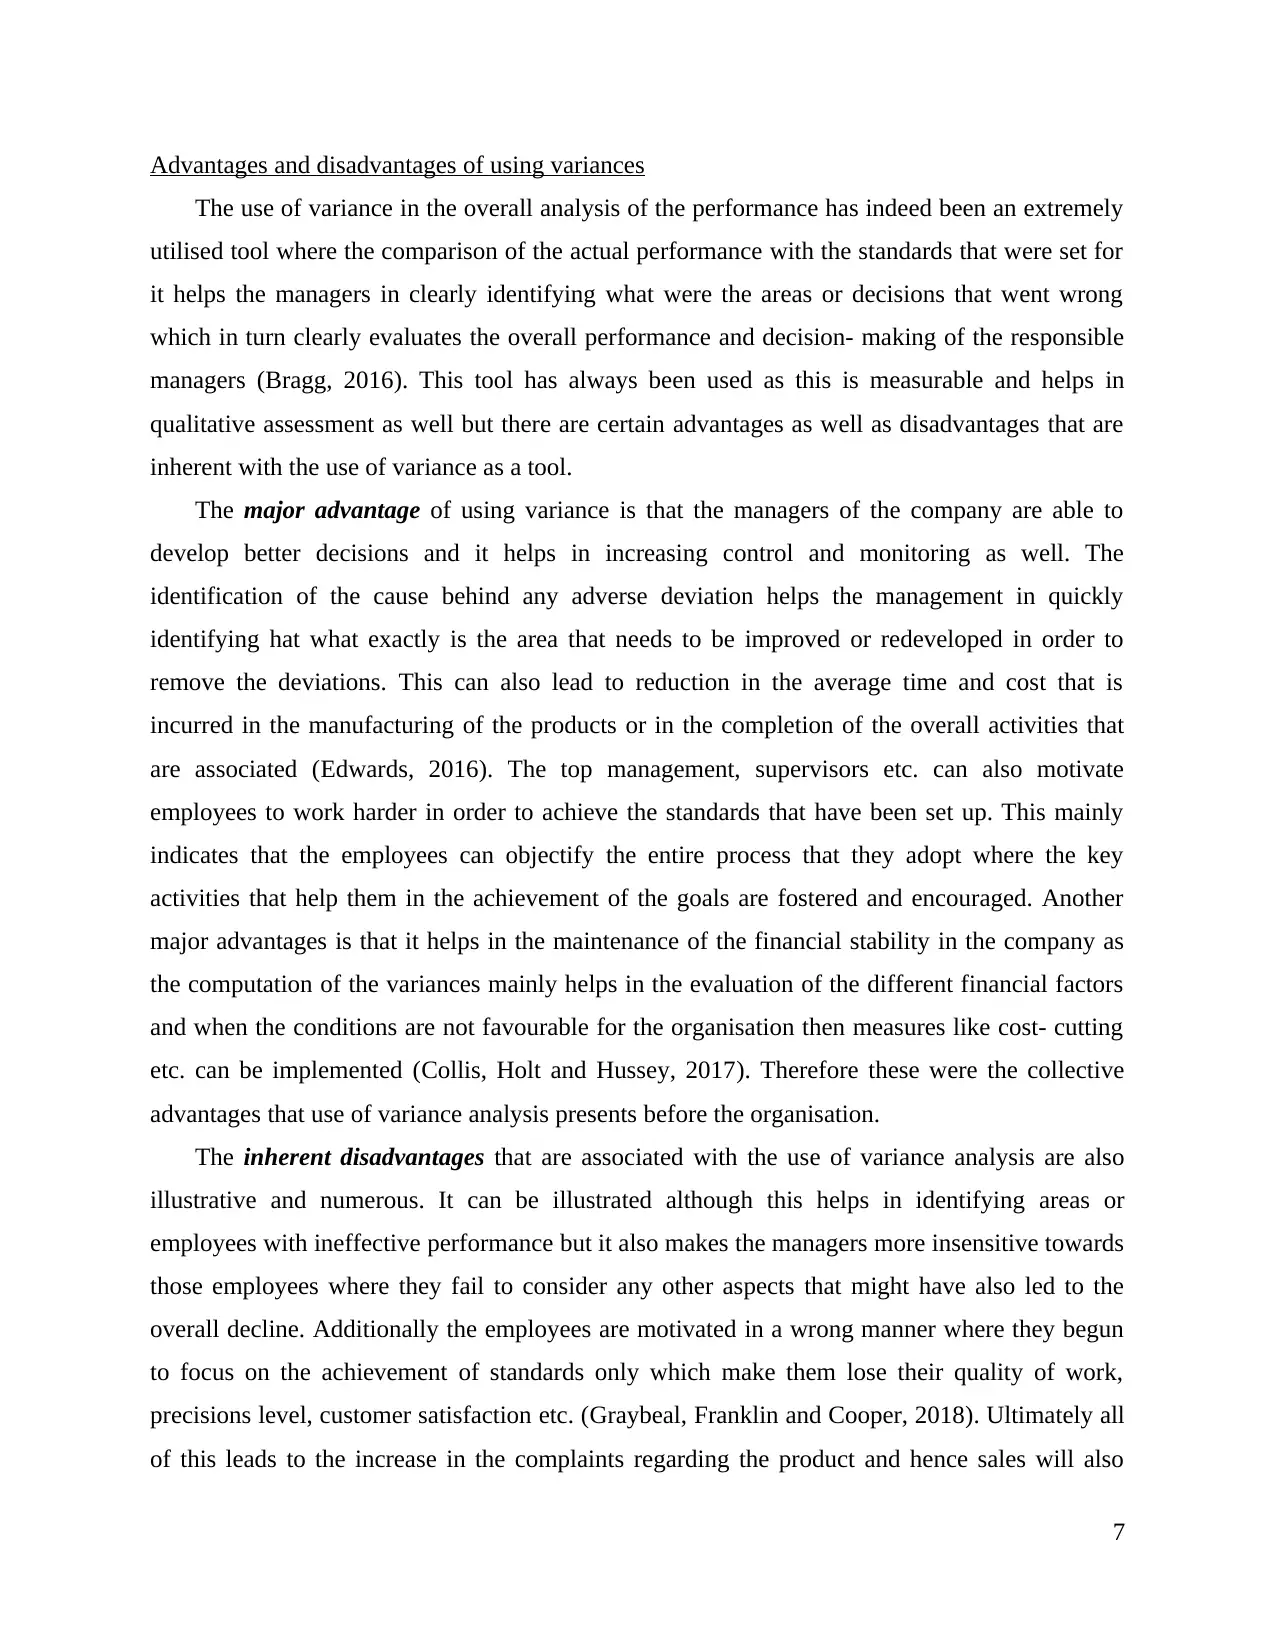
The material price operational variance indicates the overall comparison of the deviation
in the decisions related to the factors that were in control of the managers effectively (Zhang,
2017). The operational variance is exactly what the name of this variance indicates i.e. it helps in
evaluating the operating efficiency of the company where the controllable aspects of the
organisation are evaluated and the decision that were made related to them are evaluated
accordingly. The operational variance helps in ascertaining that how the overall performance can
be improved and here the performance of the manager is compared with the standards that have
been adjusted indicating the overall conditions in which the managers usually work. The overall
implementation of the planning and operational variances helps in analysis of the controllable
and uncontrollable factors associated with the overall operation. The manager is faced with the
opportunity to take corrective decisions that can be operated properly and in an appropriate
manner in accordance with the fact that some of them cannot be controlled or pre- determined by
the managers (Shim, 2016). The material price operation variance can be calculated using
following formula:
Material price operational variance = (Market price at time of purchase – Actual Price) *
Quantity Purchased
Based on this formula, the operational variance for the XLG Company can be calculated in
following manner:
Particulars Original budget Revised budget Actual
Chemical X 2.5 4.5 3.7
Chemical Y 2.5 4.5 3.7
Budgeted production 800 800 1600
Material price operational variance (3.7 - 4.5) *1600 -1280 (F)
The calculation above clearly indicates that the net result in the operational variance is
favourable in nature where the actual price that was incurred was less than the budgeted one thus
indicating that the managers did good analysis of the future movement of price.
6
The calculation above clearly indicates that the revised price was much higher than the
actual or original price that was set up and this led to the creation of an adverse situation for the
company with £3200.
The material price operational variance indicates the overall comparison of the deviation
in the decisions related to the factors that were in control of the managers effectively (Zhang,
2017). The operational variance is exactly what the name of this variance indicates i.e. it helps in
evaluating the operating efficiency of the company where the controllable aspects of the
organisation are evaluated and the decision that were made related to them are evaluated
accordingly. The operational variance helps in ascertaining that how the overall performance can
be improved and here the performance of the manager is compared with the standards that have
been adjusted indicating the overall conditions in which the managers usually work. The overall
implementation of the planning and operational variances helps in analysis of the controllable
and uncontrollable factors associated with the overall operation. The manager is faced with the
opportunity to take corrective decisions that can be operated properly and in an appropriate
manner in accordance with the fact that some of them cannot be controlled or pre- determined by
the managers (Shim, 2016). The material price operation variance can be calculated using
following formula:
Material price operational variance = (Market price at time of purchase – Actual Price) *
Quantity Purchased
Based on this formula, the operational variance for the XLG Company can be calculated in
following manner:
Particulars Original budget Revised budget Actual
Chemical X 2.5 4.5 3.7
Chemical Y 2.5 4.5 3.7
Budgeted production 800 800 1600
Material price operational variance (3.7 - 4.5) *1600 -1280 (F)
The calculation above clearly indicates that the net result in the operational variance is
favourable in nature where the actual price that was incurred was less than the budgeted one thus
indicating that the managers did good analysis of the future movement of price.
6
Advantages and disadvantages of using variances
The use of variance in the overall analysis of the performance has indeed been an extremely
utilised tool where the comparison of the actual performance with the standards that were set for
it helps the managers in clearly identifying what were the areas or decisions that went wrong
which in turn clearly evaluates the overall performance and decision- making of the responsible
managers (Bragg, 2016). This tool has always been used as this is measurable and helps in
qualitative assessment as well but there are certain advantages as well as disadvantages that are
inherent with the use of variance as a tool.
The major advantage of using variance is that the managers of the company are able to
develop better decisions and it helps in increasing control and monitoring as well. The
identification of the cause behind any adverse deviation helps the management in quickly
identifying hat what exactly is the area that needs to be improved or redeveloped in order to
remove the deviations. This can also lead to reduction in the average time and cost that is
incurred in the manufacturing of the products or in the completion of the overall activities that
are associated (Edwards, 2016). The top management, supervisors etc. can also motivate
employees to work harder in order to achieve the standards that have been set up. This mainly
indicates that the employees can objectify the entire process that they adopt where the key
activities that help them in the achievement of the goals are fostered and encouraged. Another
major advantages is that it helps in the maintenance of the financial stability in the company as
the computation of the variances mainly helps in the evaluation of the different financial factors
and when the conditions are not favourable for the organisation then measures like cost- cutting
etc. can be implemented (Collis, Holt and Hussey, 2017). Therefore these were the collective
advantages that use of variance analysis presents before the organisation.
The inherent disadvantages that are associated with the use of variance analysis are also
illustrative and numerous. It can be illustrated although this helps in identifying areas or
employees with ineffective performance but it also makes the managers more insensitive towards
those employees where they fail to consider any other aspects that might have also led to the
overall decline. Additionally the employees are motivated in a wrong manner where they begun
to focus on the achievement of standards only which make them lose their quality of work,
precisions level, customer satisfaction etc. (Graybeal, Franklin and Cooper, 2018). Ultimately all
of this leads to the increase in the complaints regarding the product and hence sales will also
7
Paraphrase This Document
Need a fresh take? Get an instant paraphrase of this document with our AI Paraphraser
decline resultantly. Another major disadvantage is the fact that the need to innovate and
creativity amongst the employees is diminished where they tend to follow only the standard
protocols and procedures that have been established in order to complete the work as quickly as
possible so that standards can be met. This technically curbs the long term growth of the
organisation (Jiambalvo, 2019).
In relation to the case undertaken of XLG as well, it can be adequately illustrates that the
calculation of the material price variances, the only relevant information available was that there
was a favourable material price variance of £27000. It can be said that the purchasing department
needs to be further analysed so that the variance can be illustrated as this alone is not adequate
source of information. The changing market conditions add to the uncertainty aspect along with
reliability concern and this is not entirely in control of the purchase department managers.
Additionally, when the material price variance is classified into planning and operational
categories of variance, the usefulness of this tool increases as it helps in the analysis of elements
and factors of multiple nature (Hoch and et.al., 2018). The planning variance indicates those
elements that are uncontrollable and not in purview of the managers while the operational
variance indicates those elements which are completely under control and authority of the
managers. This collectively indicates the efficiency of the department as a whole and improves
the capabilities of the individual employees.
However there are certain aspects that need to be carefully planned in order to avoid any
serious consequences or failure. Organisations and the management in particular needs to
develop standards that is realistic and attainable and achievable as well. They cannot be vague or
overestimated/ underestimated either as this can lead to the reduction in the overall performance
and motivation level of the employees. It is also possible that the incurrence of variance can be
justified due to faulty planning or incorrect estimations and expectations etc. (Nishimura, 2019).
The revision of the entire standard that has been set up and analysing the factors again to set up a
new variance is a very costly and engaging process which needs to be avoided at all costs. It can
further lead to the major impacts on the overall budget of the company as well.
Therefore, in this manner the different aspects that are associated with the positive as well as
negative side of the implementation of the variance analysis tools has been critically analysed
and illustrated. It can be concluded that although variance analysis is not the most conclusive and
reliant tool but nonetheless, it helps in effective monitoring and measuring of the tools and the
8
flexibility to introduce changes also increases (Vera and et.al., 2016). Effective monitoring and
correct implementation of this tool can help the company in utilising the benefits of variance
analysis without being affected by its significant disadvantages.
PART B
Assessment of the make or buy decision for XLG
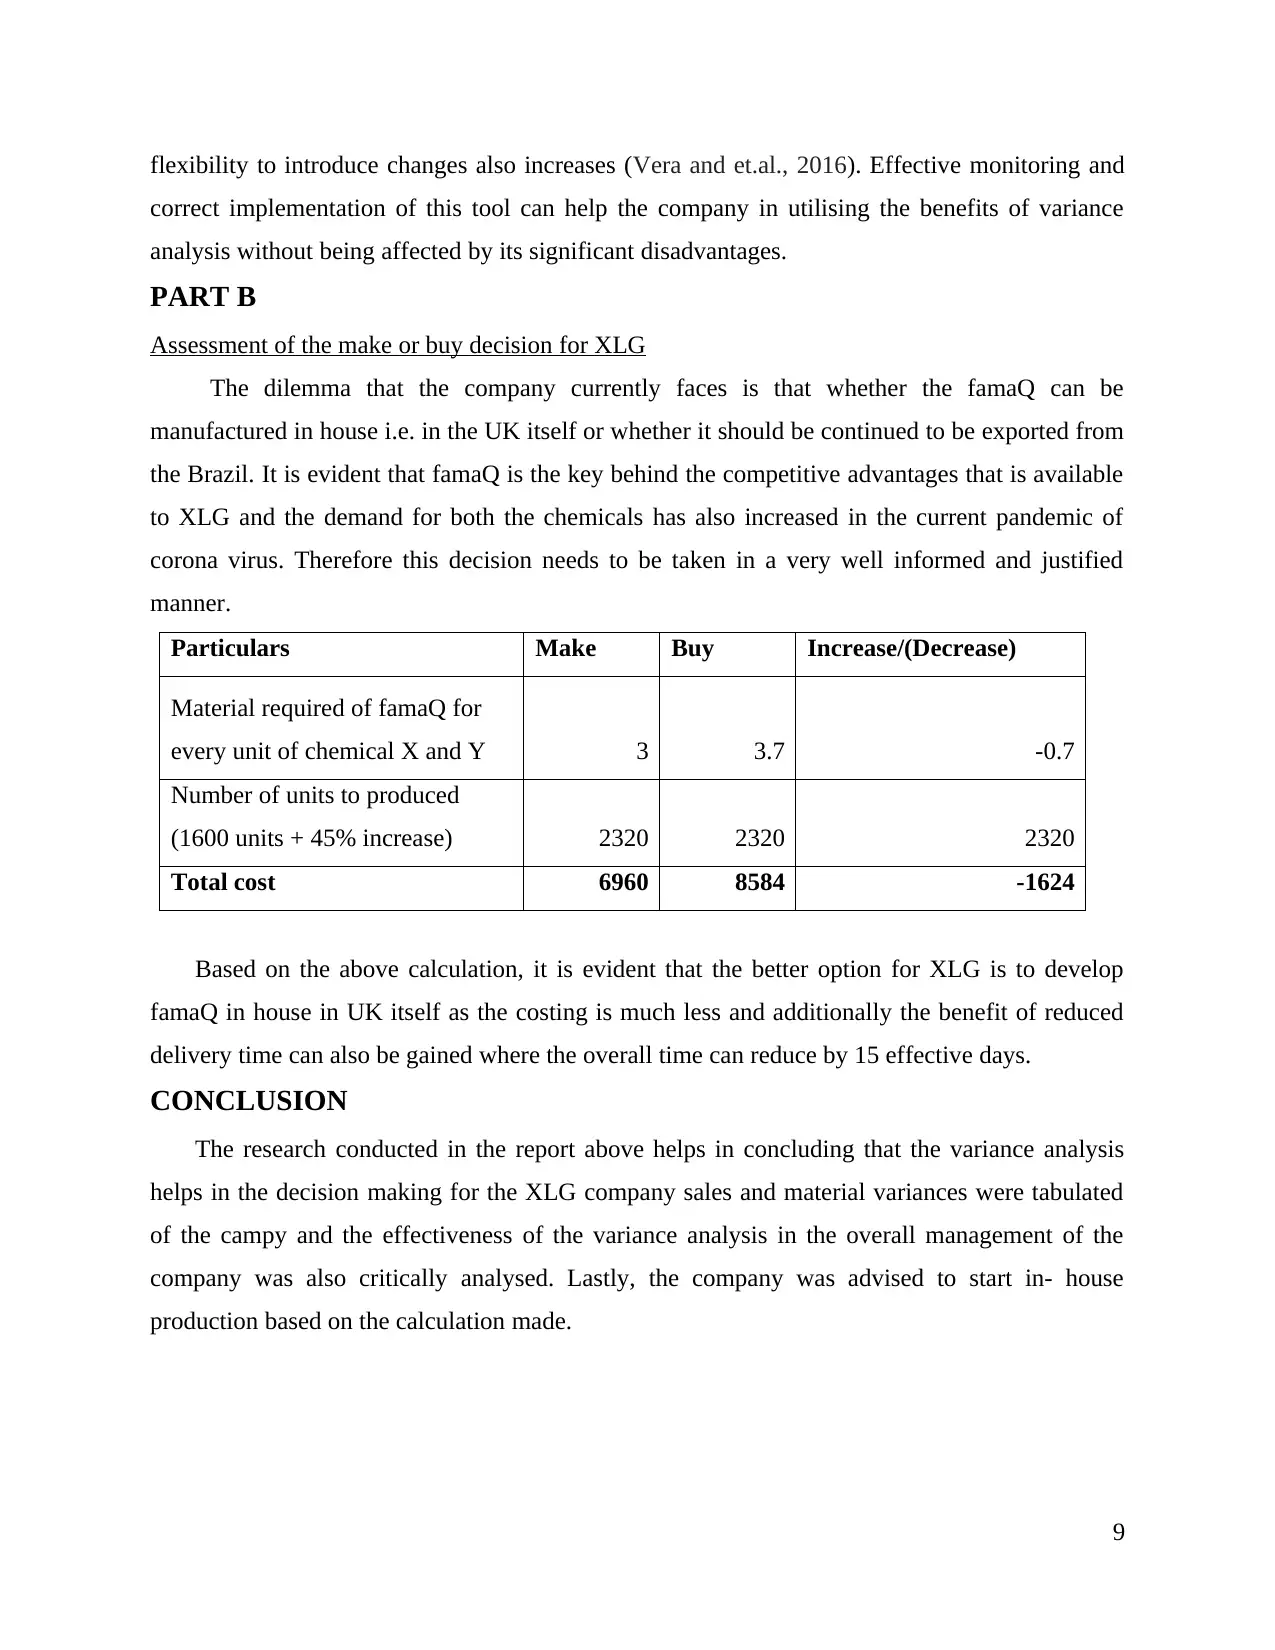
The dilemma that the company currently faces is that whether the famaQ can be
manufactured in house i.e. in the UK itself or whether it should be continued to be exported from
the Brazil. It is evident that famaQ is the key behind the competitive advantages that is available
to XLG and the demand for both the chemicals has also increased in the current pandemic of
corona virus. Therefore this decision needs to be taken in a very well informed and justified
manner.
Particulars Make Buy Increase/(Decrease)
Material required of famaQ for
every unit of chemical X and Y 3 3.7 -0.7
Number of units to produced
(1600 units + 45% increase) 2320 2320 2320
Total cost 6960 8584 -1624
Based on the above calculation, it is evident that the better option for XLG is to develop
famaQ in house in UK itself as the costing is much less and additionally the benefit of reduced
delivery time can also be gained where the overall time can reduce by 15 effective days.
CONCLUSION
The research conducted in the report above helps in concluding that the variance analysis
helps in the decision making for the XLG company sales and material variances were tabulated
of the campy and the effectiveness of the variance analysis in the overall management of the
company was also critically analysed. Lastly, the company was advised to start in- house
production based on the calculation made.
9
correct implementation of this tool can help the company in utilising the benefits of variance
analysis without being affected by its significant disadvantages.
PART B
Assessment of the make or buy decision for XLG
The dilemma that the company currently faces is that whether the famaQ can be
manufactured in house i.e. in the UK itself or whether it should be continued to be exported from
the Brazil. It is evident that famaQ is the key behind the competitive advantages that is available
to XLG and the demand for both the chemicals has also increased in the current pandemic of
corona virus. Therefore this decision needs to be taken in a very well informed and justified
manner.
Particulars Make Buy Increase/(Decrease)
Material required of famaQ for
every unit of chemical X and Y 3 3.7 -0.7
Number of units to produced
(1600 units + 45% increase) 2320 2320 2320
Total cost 6960 8584 -1624
Based on the above calculation, it is evident that the better option for XLG is to develop
famaQ in house in UK itself as the costing is much less and additionally the benefit of reduced
delivery time can also be gained where the overall time can reduce by 15 effective days.
CONCLUSION
The research conducted in the report above helps in concluding that the variance analysis
helps in the decision making for the XLG company sales and material variances were tabulated
of the campy and the effectiveness of the variance analysis in the overall management of the
company was also critically analysed. Lastly, the company was advised to start in- house
production based on the calculation made.
9
REFERENCES
Books and Journals
Bai, G., 2016. Applying variance analysis to understand California hospitals' expense recovery
status by patient groups. Accounting Horizons. 30(2). pp.211-223
Bragg, S. M., 2016. Cost accounting fundamentals. Colorado, CO: Accounting Tools.
Collis, J., Holt, A. and Hussey, R., 2017. Business accounting. Palgrave.
Edwards, J.B., 2016. Modern gross profit analysis. Journal of Corporate Accounting &
Finance. 27(4). pp.45-55.
Farkas, M., Kersting, L. and Stephens, W., 2016. Modern Watch Company: An instructional
resource for presenting and learning actual, normal, and standard costing systems, and
variable and fixed overhead variance analysis. Journal of Accounting Education. 35.
pp.56-68.
Graybeal, P., Franklin, M. and Cooper, D., 2018. Distinguish between Financial and Managerial
Accounting. Principles of Accounting, Volume 2: Managerial Accounting
Hoch, J. E. and et.al., 2018. Do ethical, authentic, and servant leadership explain variance above
and beyond transformational leadership? A meta-analysis. Journal of Management. 44(2).
pp.501-529.
Jiambalvo, J., 2019. Managerial accounting. John Wiley & Sons.
Marzlin Marzuki, N.A.R. and Ismail, J., 2019. Benefits and limitations of variance analysis in
management accounting. ACCOUNTING BULLETIN. p.15.
Messer, R., 2016. Teaching Variance Analysis for Cost Accounting: How to Achieve above Par
Performance. In Advances in Accounting Education: Teaching and Curriculum
Innovations. Emerald Group Publishing Limited.
Nishimura, A., 2019. Profit opportunity, strategic innovation, and management accounting.
In Management, uncertainty, and accounting (pp. 97-127). Palgrave Macmillan,
Singapore
Rosyidi, C.N., 2019, August. Make or Buy Decision with Price and Quality Dependent Demand.
In Proceedings of the International Manufacturing Engineering Conference & The Asia
Pacific Conference on Manufacturing Systems (pp. 272-277). Springer, Singapore.
Shim, J. K., 2016. Accounting and finance for the nonfinancial executive: An Integrated
Resource Management Guide for the 21st Century. CRC Press
10
Secure Best Marks with AI Grader
Need help grading? Try our AI Grader for instant feedback on your assignments.
Tan, B.S. and Low, K.Y., 2017. Budgeting Practice in Singapore–An Exploratory Study Using a
Survey. Asia Pacific Management Accounting Journal. 12(1). pp.77-103.
Vera, O. D. and et.al., 2016. Assessing psychology students’ difficulties in elementary variance
analysis. Revista Diálogo Educacional. 16(48). pp.487-511.
Windapo, A. and Moghayedi, A., 2017. BUILDING MATERIAL PRICE DIFFERENTIATION
IN SOUTH AFRICA: THE ROLE OF RETAILERS AND LOCATION. WELCOME TO
DELEGATES IRC 2017. p.447.
Zhang, C., 2017. The Application of Variance Analysis in FP&A Organizations: Survey
Evidence and Recommendations for Enhancement. Journal of Accounting and
Finance. 17(8). pp.54-70.
11

12
1 out of 12
Related Documents


Your All-in-One AI-Powered Toolkit for Academic Success.
+13062052269
info@desklib.com
Available 24*7 on WhatsApp / Email
![[object Object]](/_next/static/media/star-bottom.7253800d.svg)
Unlock your academic potential
© 2024 | Zucol Services PVT LTD | All rights reserved.