JCU SP22 LB5235: Tourism Data Analysis and Statistical Report

Verified

Added on  2022/10/11

|8
|1571
|22
Report
AI Summary
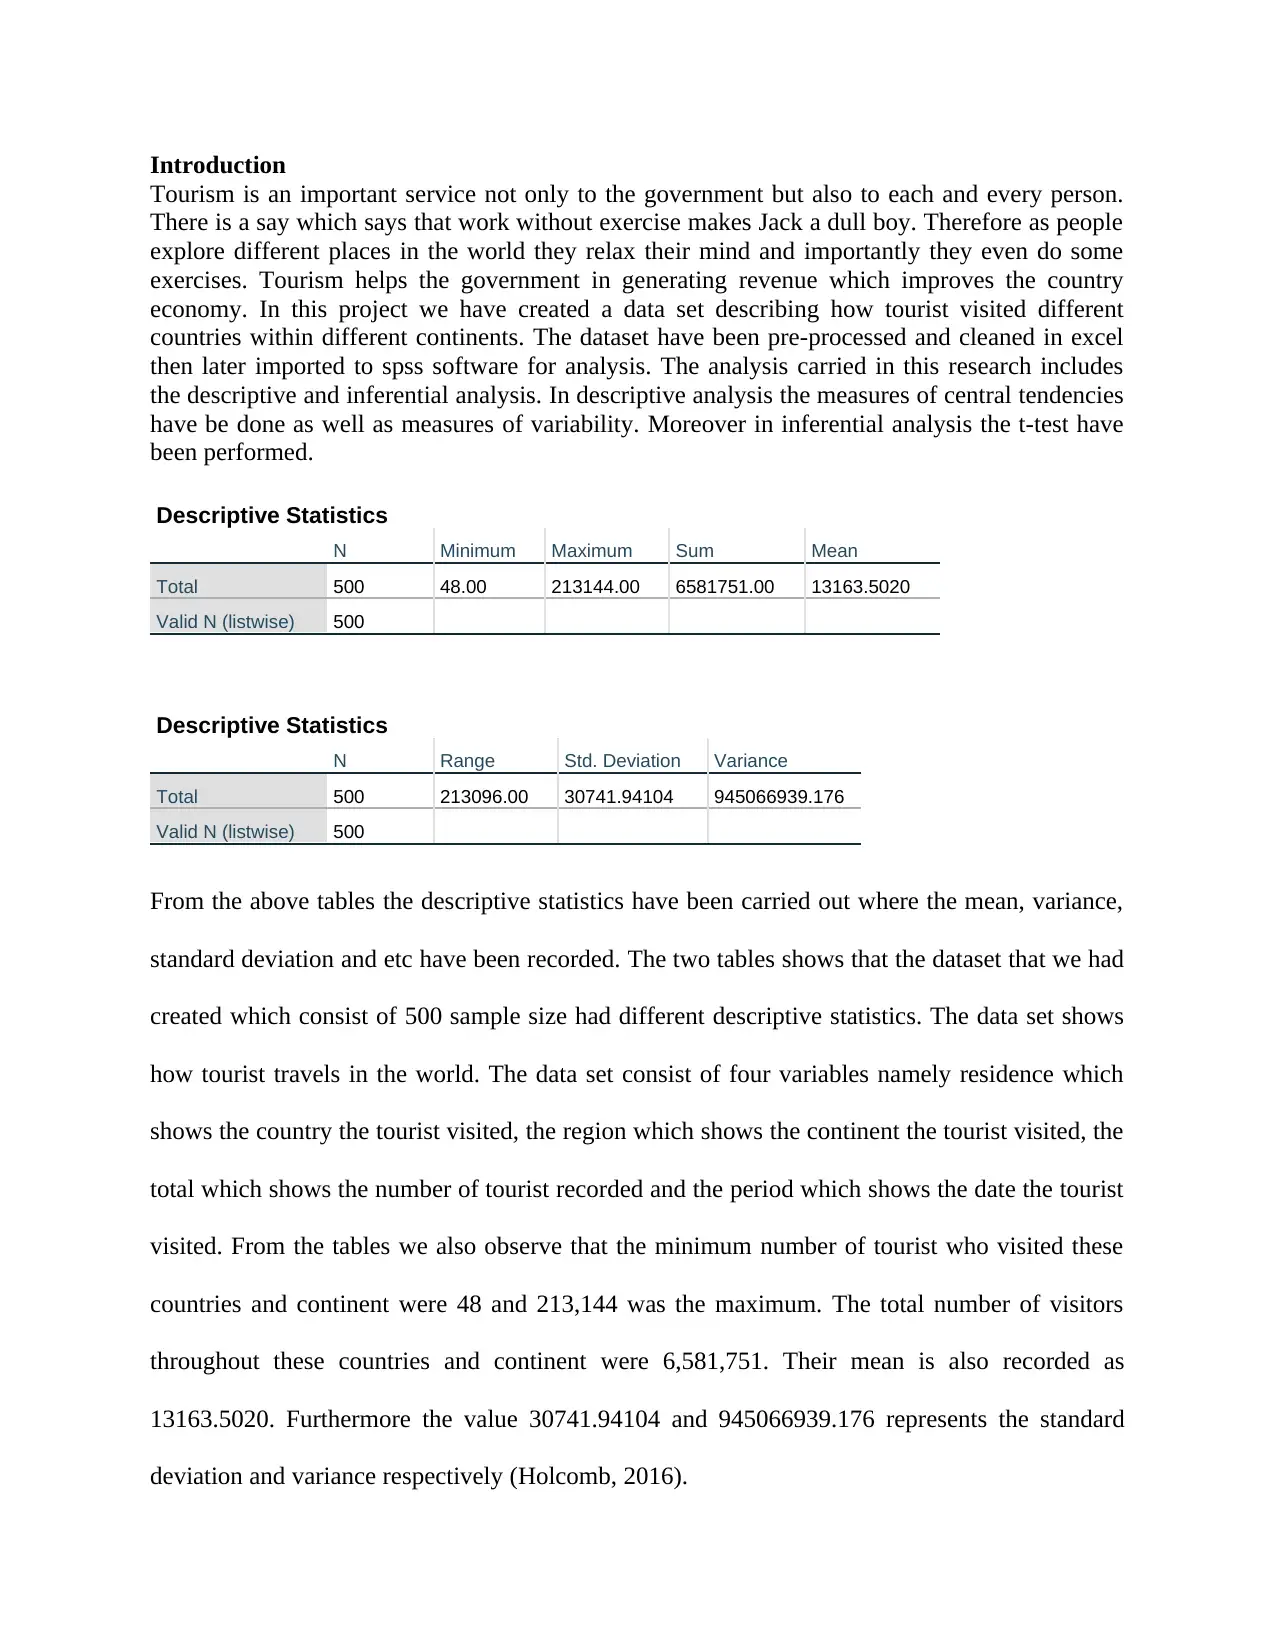
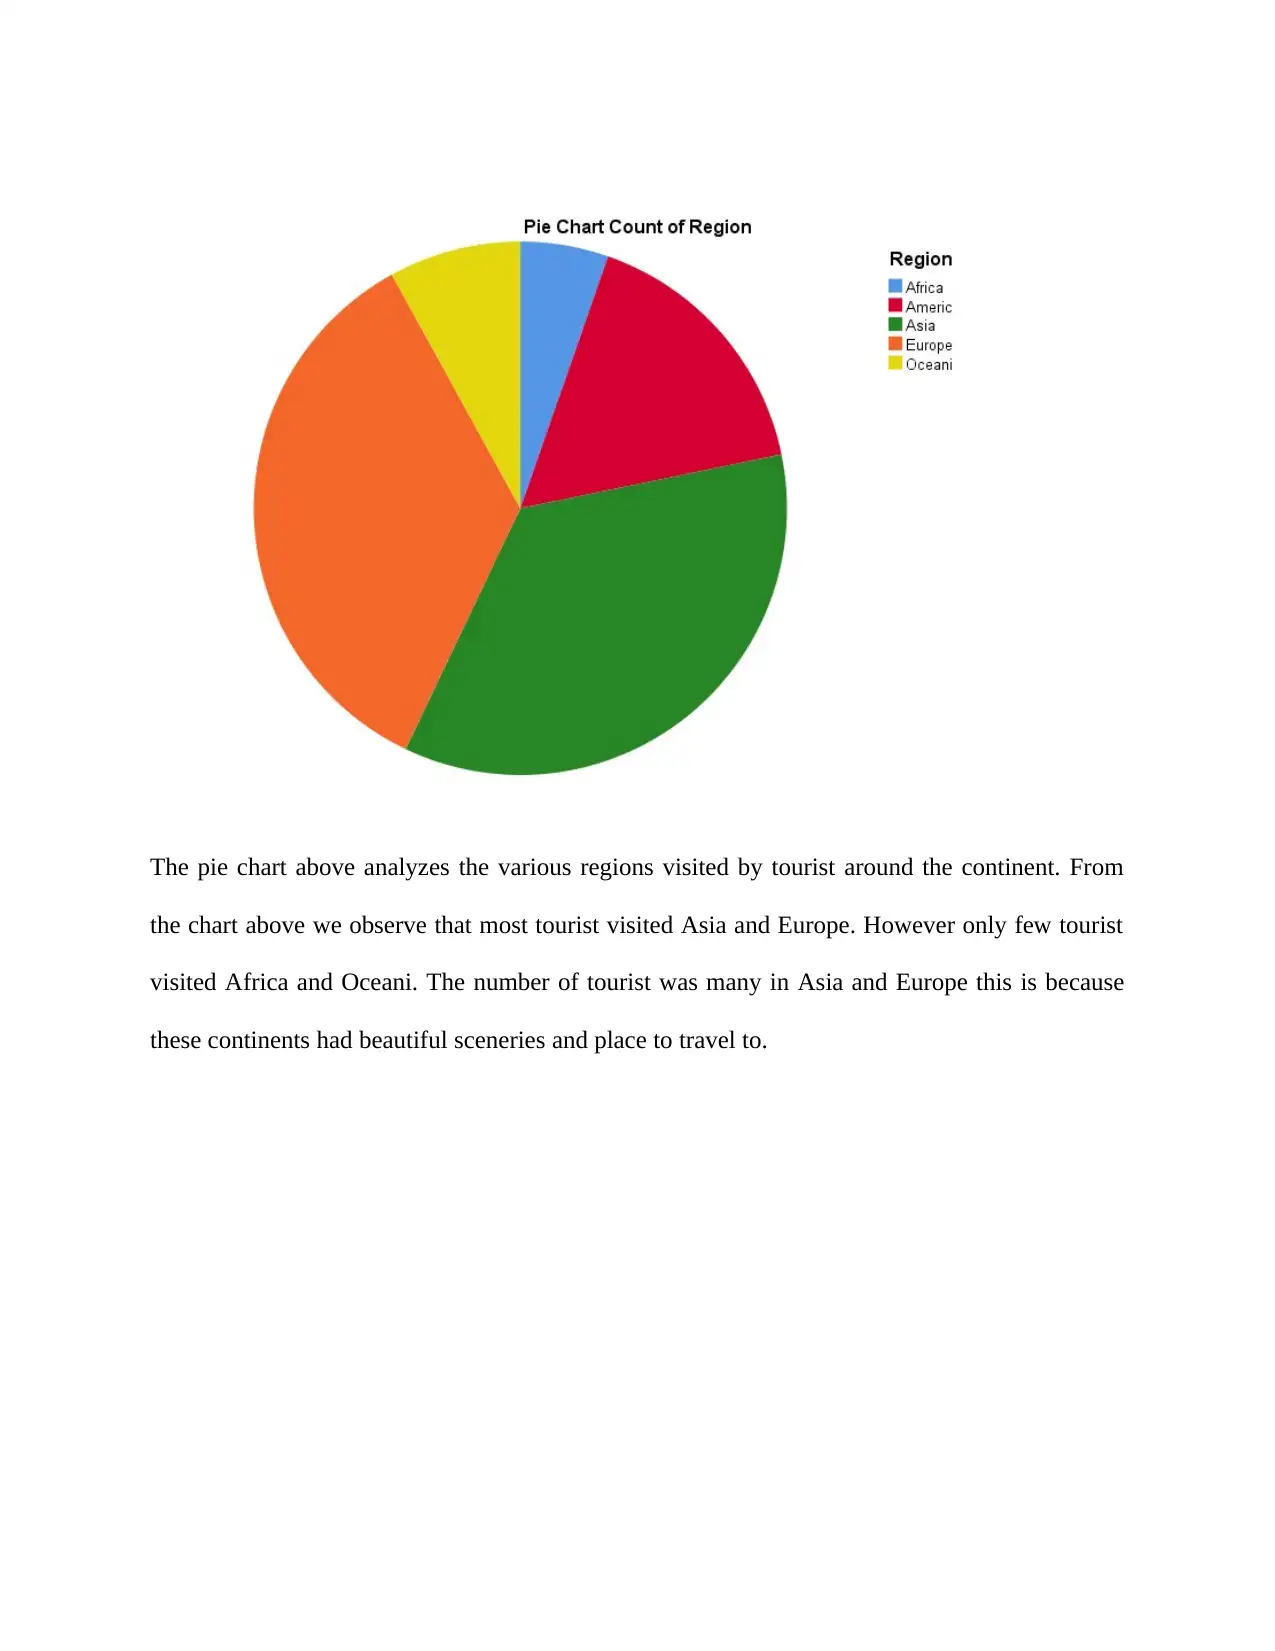
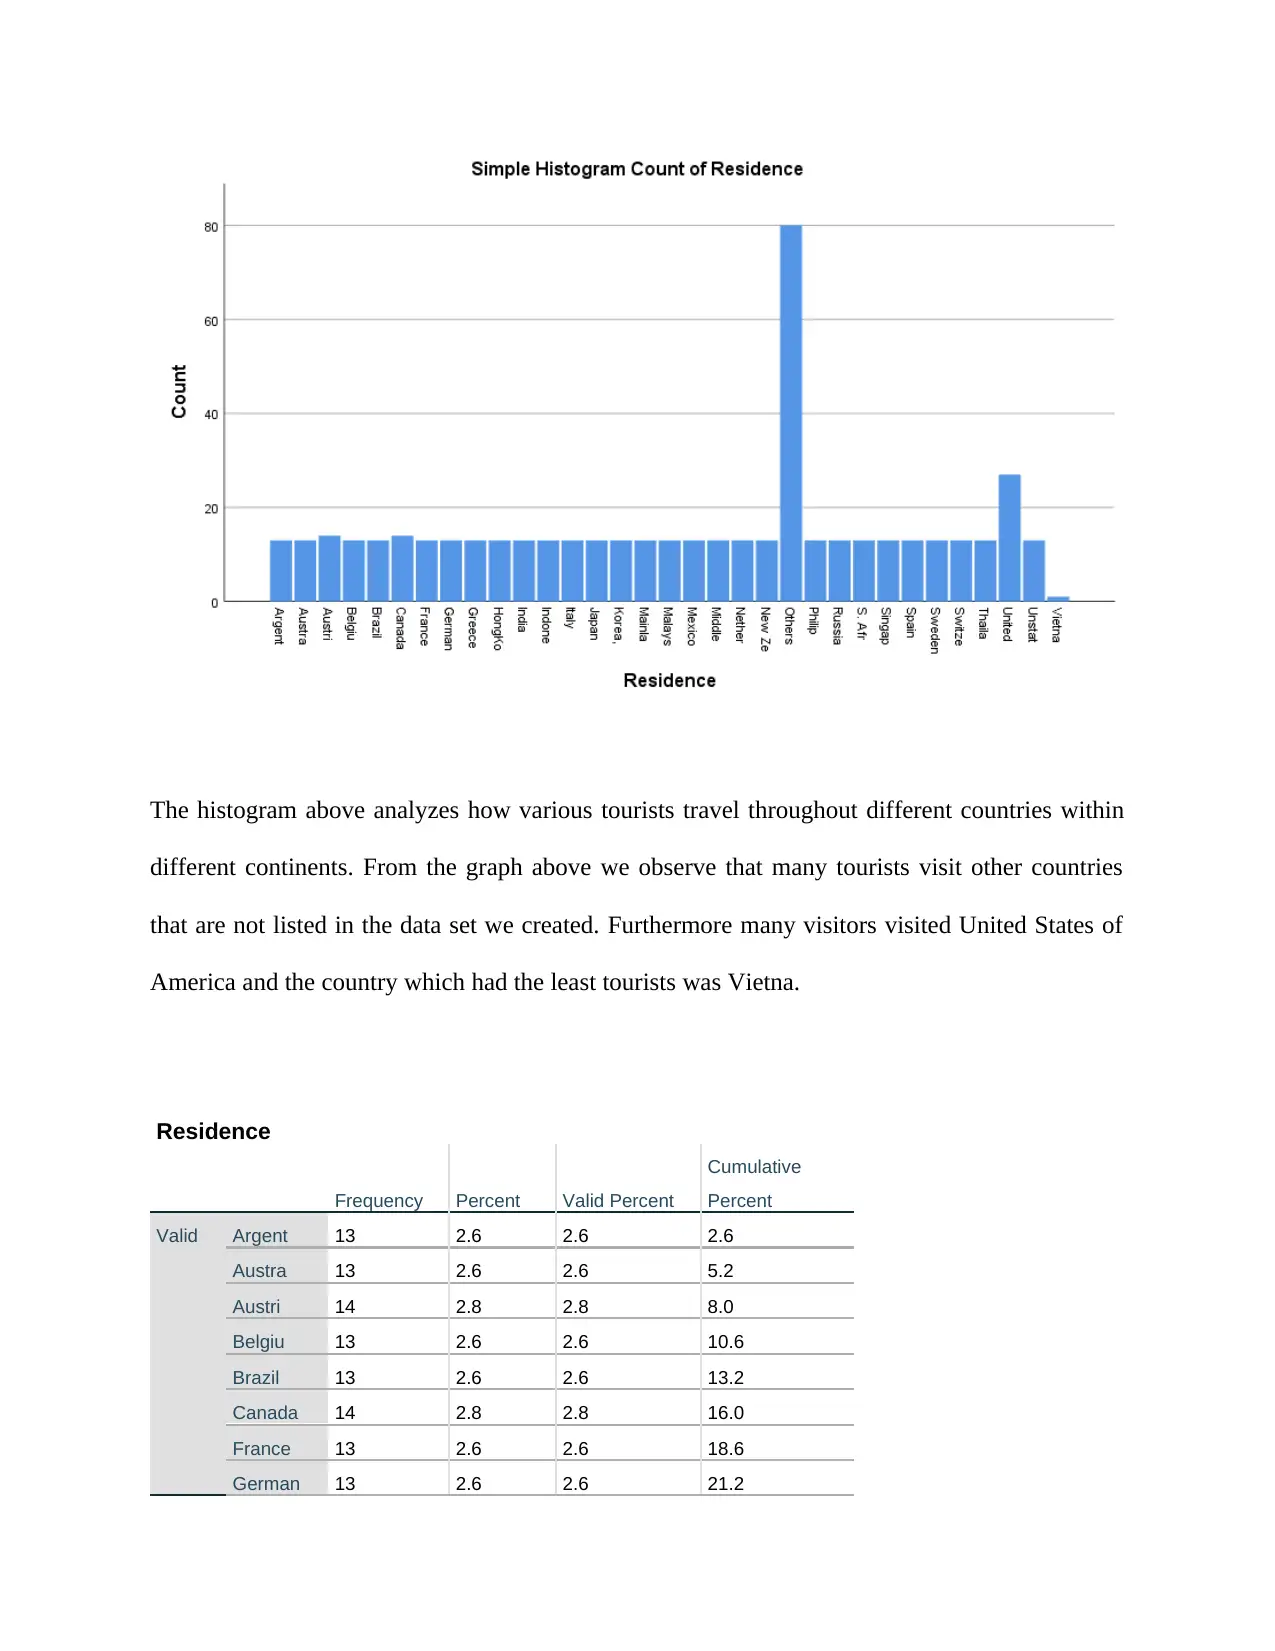
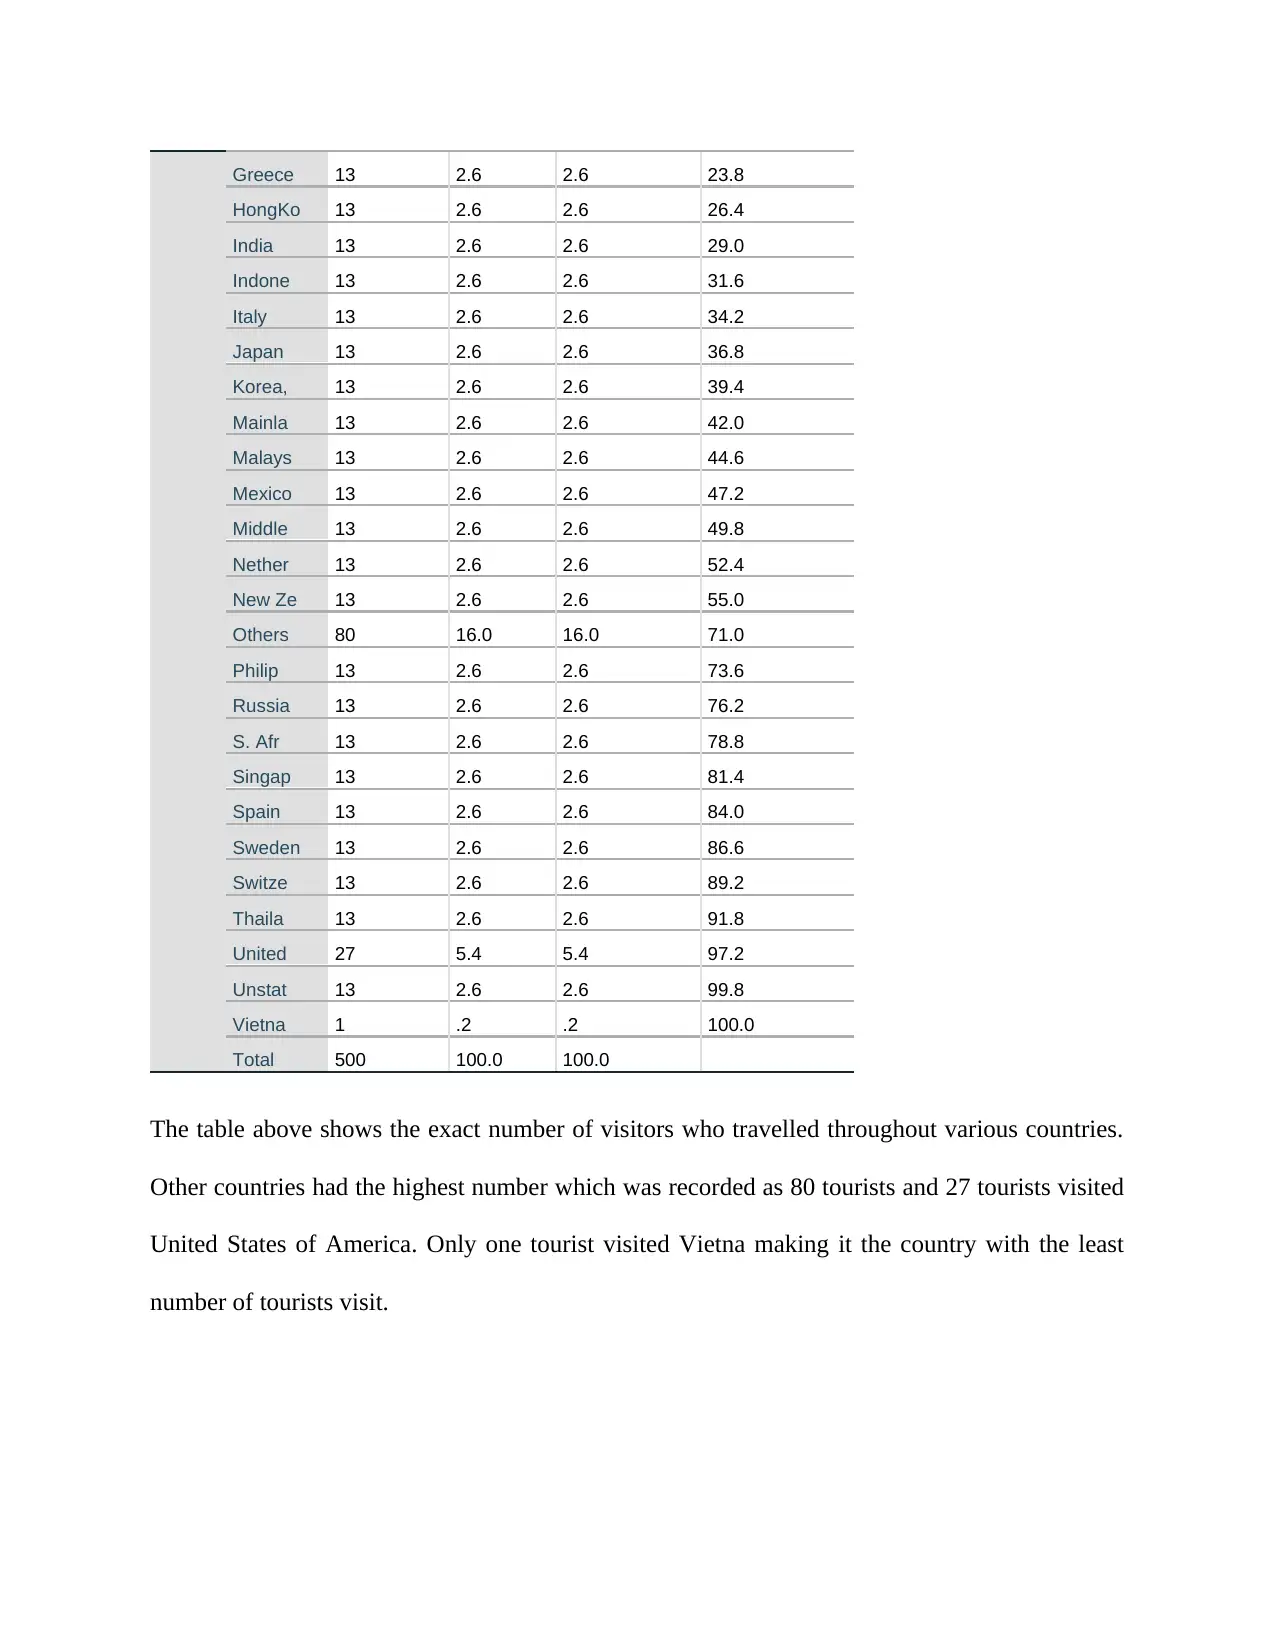
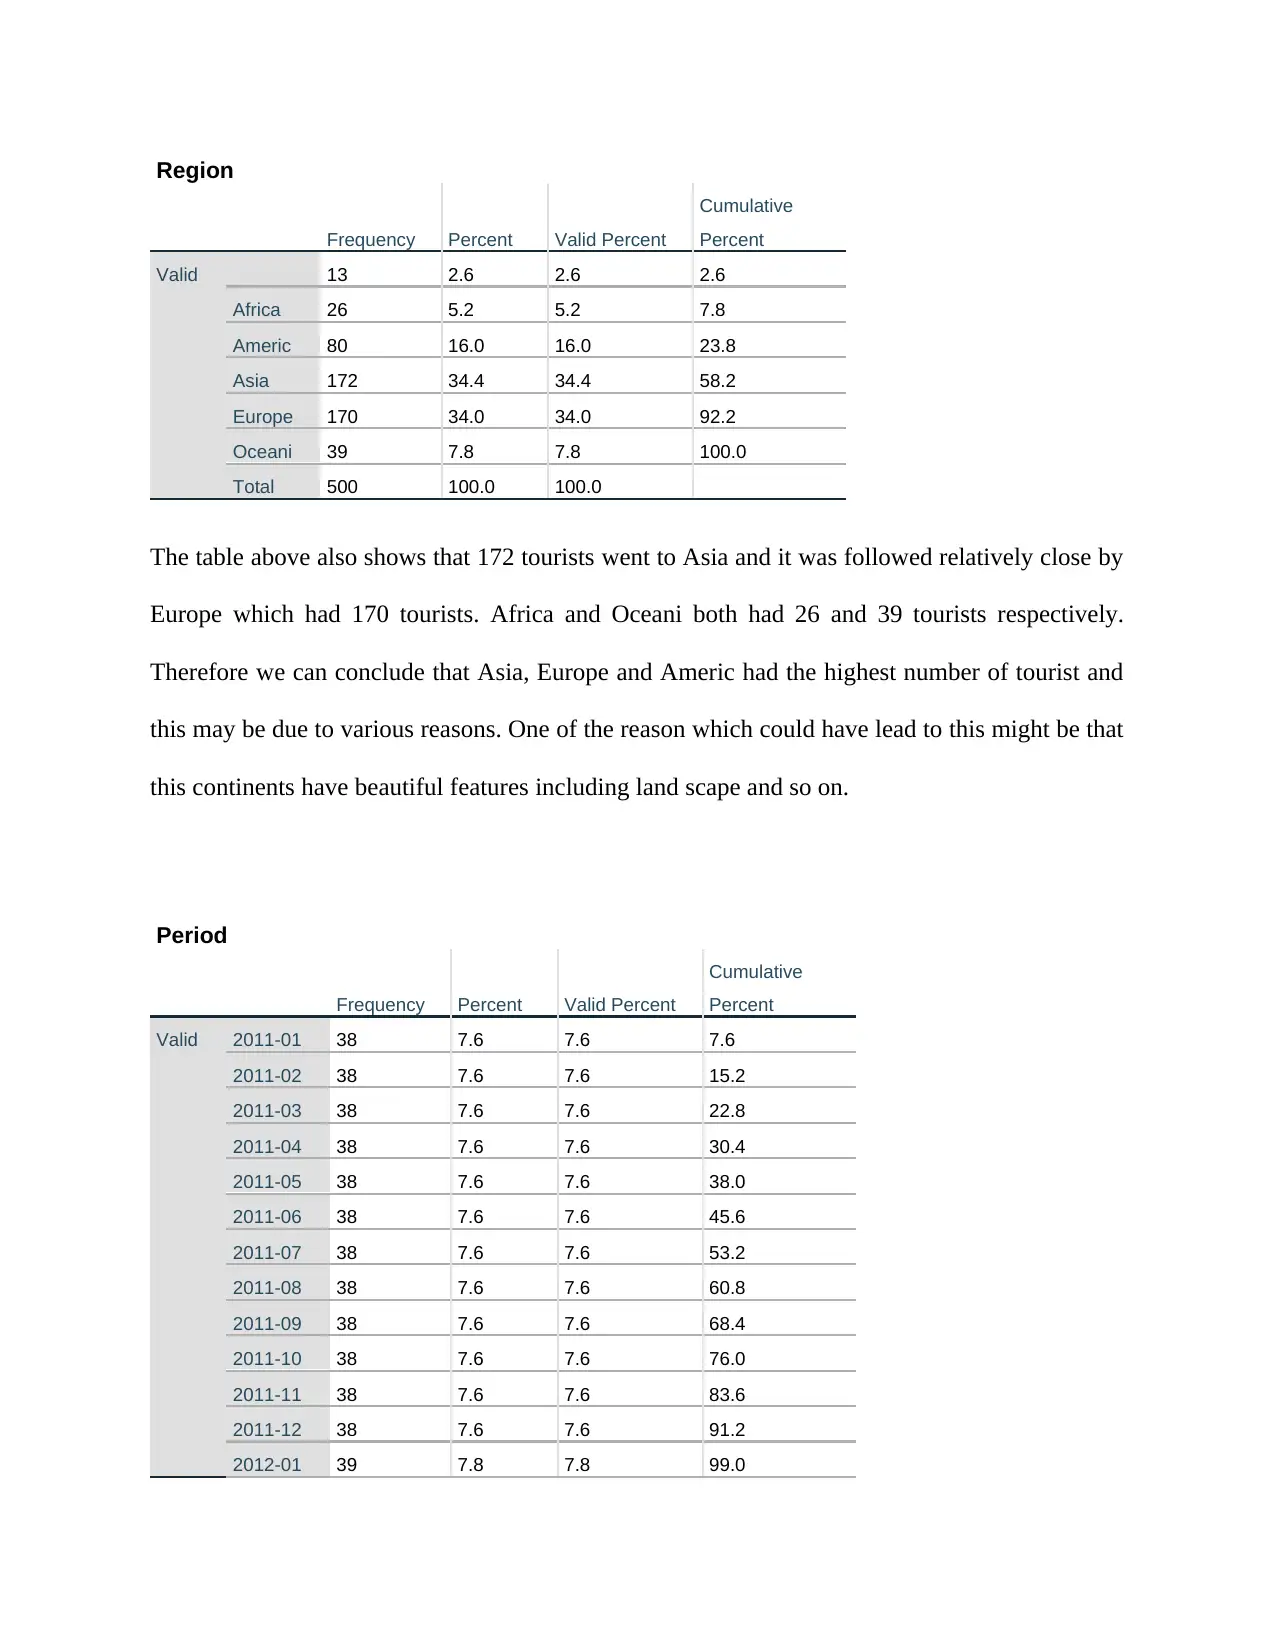
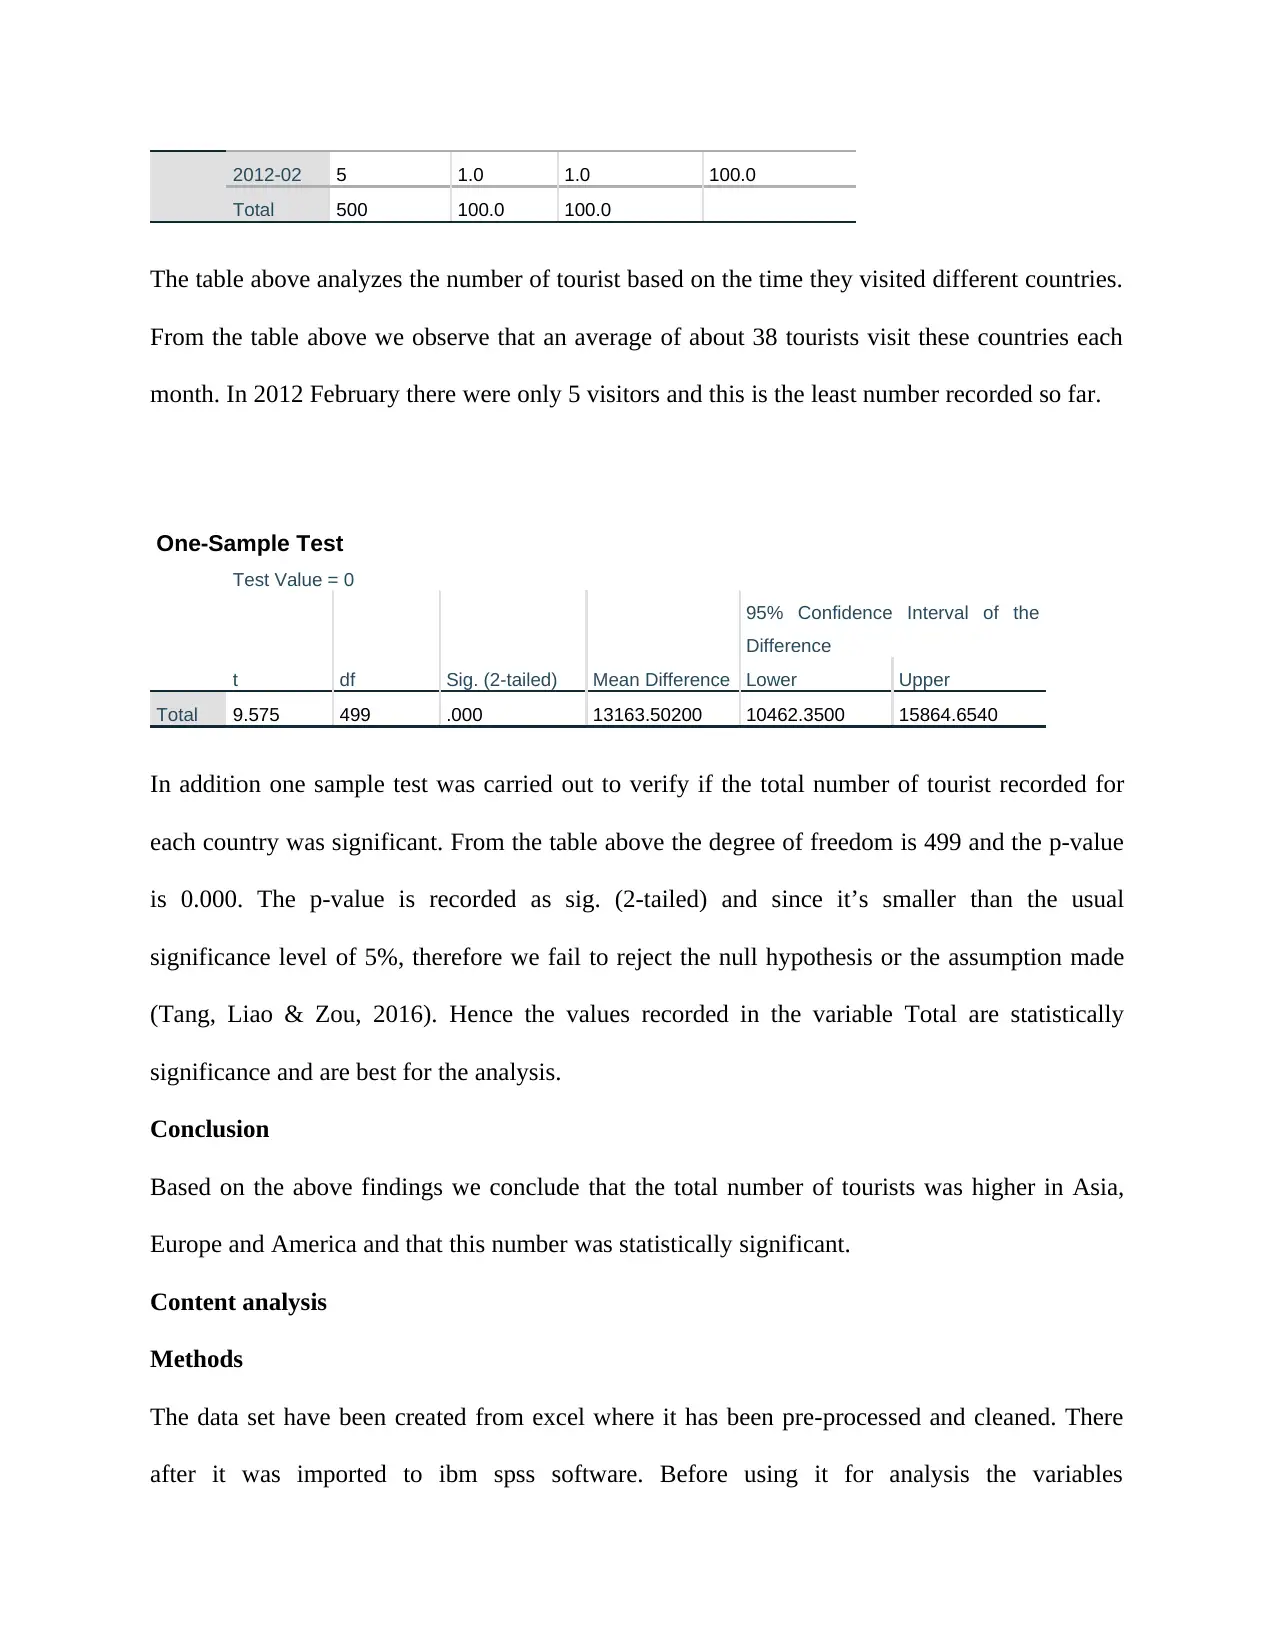
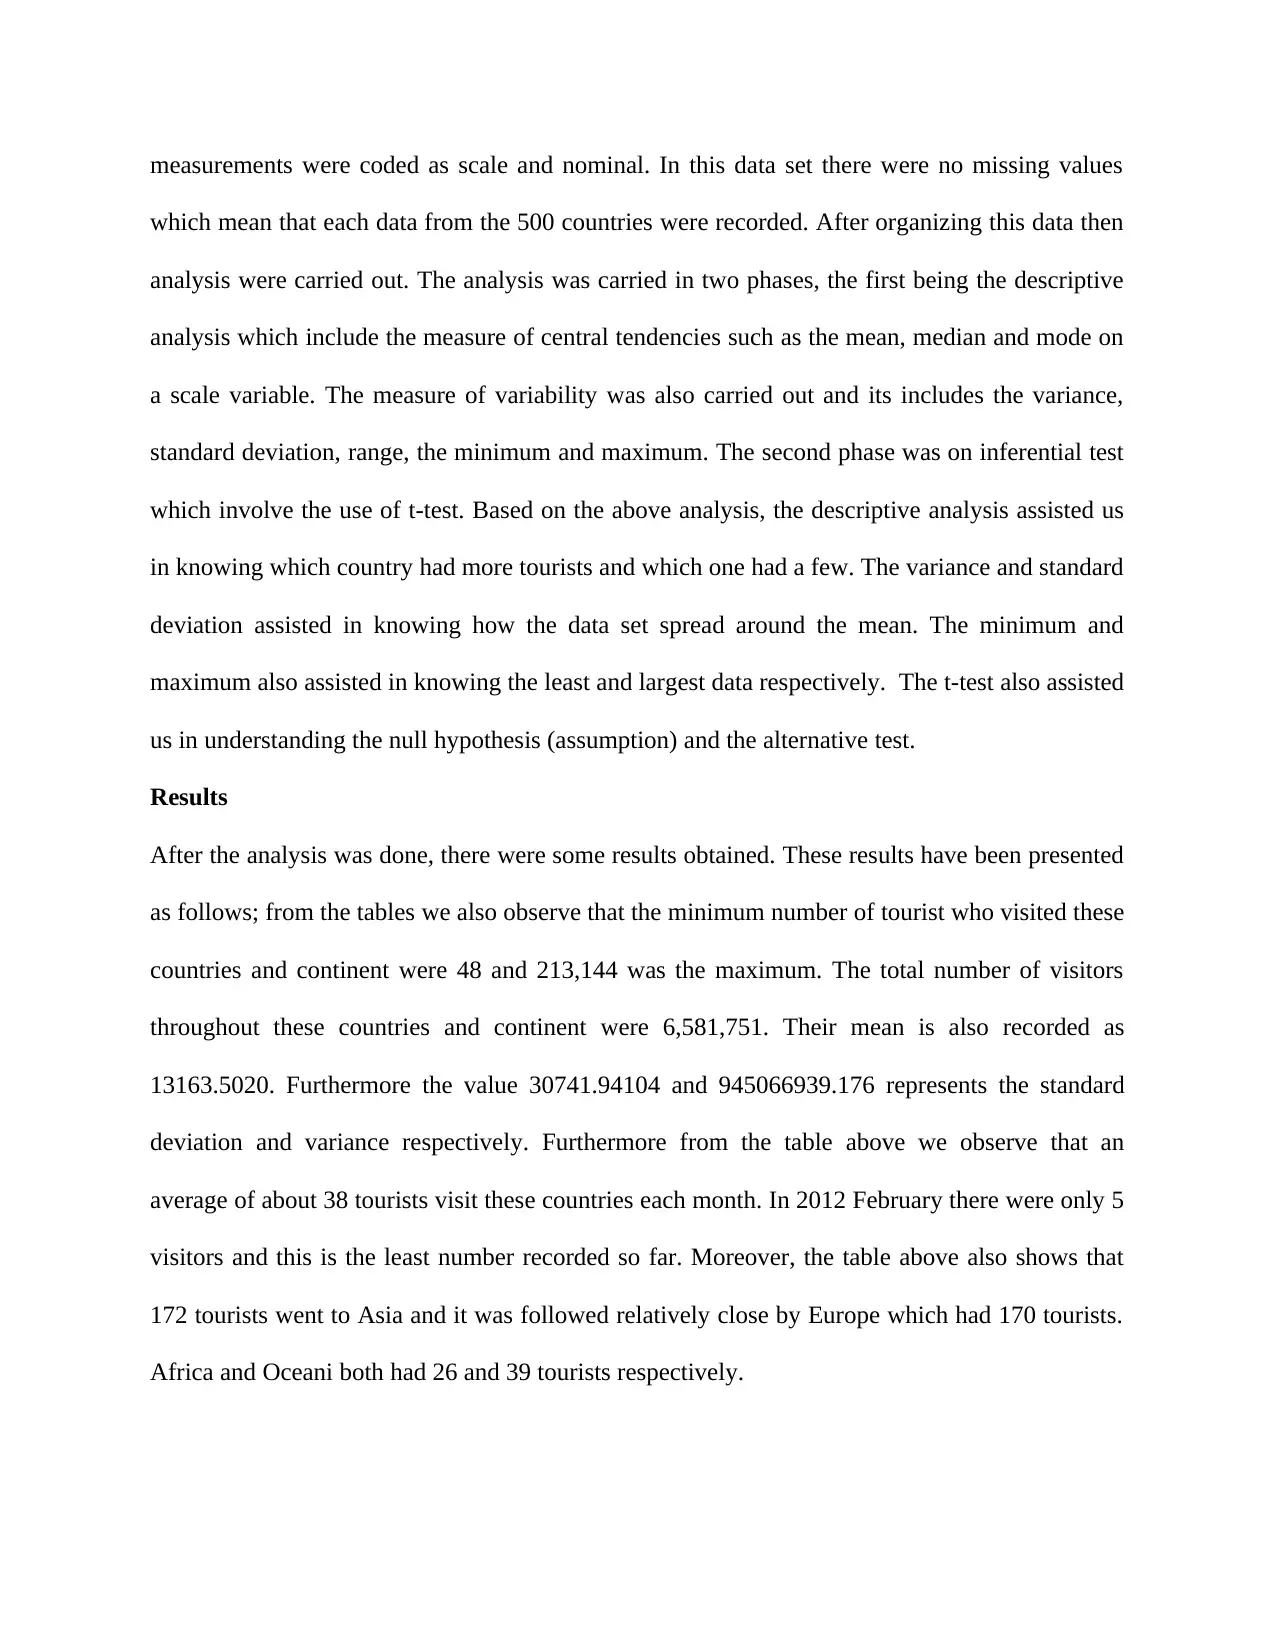
This report presents a comprehensive analysis of tourism data, utilizing descriptive and inferential statistical methods. The study examines a dataset of 500 samples, focusing on tourist visits to various countries and continents. Descriptive statistics, including measures of central tendency and variability, are computed to understand the distribution of tourist numbers. Inferential statistics, specifically t-tests, are employed to assess the significance of the findings. The analysis reveals key trends, such as the popularity of Asia and Europe among tourists, and identifies the countries with the highest and lowest visitor counts. The report also explores the temporal distribution of tourist visits, providing insights into seasonal patterns. The methodology includes data preprocessing in Excel and analysis using SPSS software. The findings highlight the statistical significance of the total tourist numbers and offer valuable insights into the factors influencing tourism patterns and their potential economic impact.
Document Page
Introduction
Tourism is an important service not only to the government but also to each and every person.
There is a say which says that work without exercise makes Jack a dull boy. Therefore as people
explore different places in the world they relax their mind and importantly they even do some
exercises. Tourism helps the government in generating revenue which improves the country
economy. In this project we have created a data set describing how tourist visited different
countries within different continents. The dataset have been pre-processed and cleaned in excel
then later imported to spss software for analysis. The analysis carried in this research includes
the descriptive and inferential analysis. In descriptive analysis the measures of central tendencies
have be done as well as measures of variability. Moreover in inferential analysis the t-test have
been performed.
Descriptive Statistics
N Minimum Maximum Sum Mean
Total 500 48.00 213144.00 6581751.00 13163.5020
Valid N (listwise) 500
Descriptive Statistics
N Range Std. Deviation Variance
Total 500 213096.00 30741.94104 945066939.176
Valid N (listwise) 500
From the above tables the descriptive statistics have been carried out where the mean, variance,
standard deviation and etc have been recorded. The two tables shows that the dataset that we had
created which consist of 500 sample size had different descriptive statistics. The data set shows
how tourist travels in the world. The data set consist of four variables namely residence which
shows the country the tourist visited, the region which shows the continent the tourist visited, the
total which shows the number of tourist recorded and the period which shows the date the tourist
visited. From the tables we also observe that the minimum number of tourist who visited these
countries and continent were 48 and 213,144 was the maximum. The total number of visitors
throughout these countries and continent were 6,581,751. Their mean is also recorded as
13163.5020. Furthermore the value 30741.94104 and 945066939.176 represents the standard
deviation and variance respectively (Holcomb, 2016).
tabler-icon-diamond-filled.svg

Paraphrase This Document

Need a fresh take? Get an instant paraphrase of this document with our AI Paraphraser
Document Page
The pie chart above analyzes the various regions visited by tourist around the continent. From
the chart above we observe that most tourist visited Asia and Europe. However only few tourist
visited Africa and Oceani. The number of tourist was many in Asia and Europe this is because
these continents had beautiful sceneries and place to travel to.
Document Page
The histogram above analyzes how various tourists travel throughout different countries within
different continents. From the graph above we observe that many tourists visit other countries
that are not listed in the data set we created. Furthermore many visitors visited United States of
America and the country which had the least tourists was Vietna.
Residence
Frequency Percent Valid Percent
Cumulative
Percent
Valid Argent 13 2.6 2.6 2.6
Austra 13 2.6 2.6 5.2
Austri 14 2.8 2.8 8.0
Belgiu 13 2.6 2.6 10.6
Brazil 13 2.6 2.6 13.2
Canada 14 2.8 2.8 16.0
France 13 2.6 2.6 18.6
German 13 2.6 2.6 21.2
Document Page
Greece 13 2.6 2.6 23.8
HongKo 13 2.6 2.6 26.4
India 13 2.6 2.6 29.0
Indone 13 2.6 2.6 31.6
Italy 13 2.6 2.6 34.2
Japan 13 2.6 2.6 36.8
Korea, 13 2.6 2.6 39.4
Mainla 13 2.6 2.6 42.0
Malays 13 2.6 2.6 44.6
Mexico 13 2.6 2.6 47.2
Middle 13 2.6 2.6 49.8
Nether 13 2.6 2.6 52.4
New Ze 13 2.6 2.6 55.0
Others 80 16.0 16.0 71.0
Philip 13 2.6 2.6 73.6
Russia 13 2.6 2.6 76.2
S. Afr 13 2.6 2.6 78.8
Singap 13 2.6 2.6 81.4
Spain 13 2.6 2.6 84.0
Sweden 13 2.6 2.6 86.6
Switze 13 2.6 2.6 89.2
Thaila 13 2.6 2.6 91.8
United 27 5.4 5.4 97.2
Unstat 13 2.6 2.6 99.8
Vietna 1 .2 .2 100.0
Total 500 100.0 100.0
The table above shows the exact number of visitors who travelled throughout various countries.
Other countries had the highest number which was recorded as 80 tourists and 27 tourists visited
United States of America. Only one tourist visited Vietna making it the country with the least
number of tourists visit.
tabler-icon-diamond-filled.svg

Paraphrase This Document

Need a fresh take? Get an instant paraphrase of this document with our AI Paraphraser
Document Page
Region
Frequency Percent Valid Percent
Cumulative
Percent
Valid 13 2.6 2.6 2.6
Africa 26 5.2 5.2 7.8
Americ 80 16.0 16.0 23.8
Asia 172 34.4 34.4 58.2
Europe 170 34.0 34.0 92.2
Oceani 39 7.8 7.8 100.0
Total 500 100.0 100.0
The table above also shows that 172 tourists went to Asia and it was followed relatively close by
Europe which had 170 tourists. Africa and Oceani both had 26 and 39 tourists respectively.
Therefore we can conclude that Asia, Europe and Americ had the highest number of tourist and
this may be due to various reasons. One of the reason which could have lead to this might be that
this continents have beautiful features including land scape and so on.
Period
Frequency Percent Valid Percent
Cumulative
Percent
Valid 2011-01 38 7.6 7.6 7.6
2011-02 38 7.6 7.6 15.2
2011-03 38 7.6 7.6 22.8
2011-04 38 7.6 7.6 30.4
2011-05 38 7.6 7.6 38.0
2011-06 38 7.6 7.6 45.6
2011-07 38 7.6 7.6 53.2
2011-08 38 7.6 7.6 60.8
2011-09 38 7.6 7.6 68.4
2011-10 38 7.6 7.6 76.0
2011-11 38 7.6 7.6 83.6
2011-12 38 7.6 7.6 91.2
2012-01 39 7.8 7.8 99.0
Document Page
2012-02 5 1.0 1.0 100.0
Total 500 100.0 100.0
The table above analyzes the number of tourist based on the time they visited different countries.
From the table above we observe that an average of about 38 tourists visit these countries each
month. In 2012 February there were only 5 visitors and this is the least number recorded so far.
One-Sample Test
Test Value = 0
t df Sig. (2-tailed) Mean Difference
95% Confidence Interval of the
Difference
Lower Upper
Total 9.575 499 .000 13163.50200 10462.3500 15864.6540
In addition one sample test was carried out to verify if the total number of tourist recorded for
each country was significant. From the table above the degree of freedom is 499 and the p-value
is 0.000. The p-value is recorded as sig. (2-tailed) and since it’s smaller than the usual
significance level of 5%, therefore we fail to reject the null hypothesis or the assumption made
(Tang, Liao & Zou, 2016). Hence the values recorded in the variable Total are statistically
significance and are best for the analysis.
Conclusion
Based on the above findings we conclude that the total number of tourists was higher in Asia,
Europe and America and that this number was statistically significant.
Content analysis
Methods
The data set have been created from excel where it has been pre-processed and cleaned. There
after it was imported to ibm spss software. Before using it for analysis the variables
Document Page
measurements were coded as scale and nominal. In this data set there were no missing values
which mean that each data from the 500 countries were recorded. After organizing this data then
analysis were carried out. The analysis was carried in two phases, the first being the descriptive
analysis which include the measure of central tendencies such as the mean, median and mode on
a scale variable. The measure of variability was also carried out and its includes the variance,
standard deviation, range, the minimum and maximum. The second phase was on inferential test
which involve the use of t-test. Based on the above analysis, the descriptive analysis assisted us
in knowing which country had more tourists and which one had a few. The variance and standard
deviation assisted in knowing how the data set spread around the mean. The minimum and
maximum also assisted in knowing the least and largest data respectively. The t-test also assisted
us in understanding the null hypothesis (assumption) and the alternative test.
Results
After the analysis was done, there were some results obtained. These results have been presented
as follows; from the tables we also observe that the minimum number of tourist who visited these
countries and continent were 48 and 213,144 was the maximum. The total number of visitors
throughout these countries and continent were 6,581,751. Their mean is also recorded as
13163.5020. Furthermore the value 30741.94104 and 945066939.176 represents the standard
deviation and variance respectively. Furthermore from the table above we observe that an
average of about 38 tourists visit these countries each month. In 2012 February there were only 5
visitors and this is the least number recorded so far. Moreover, the table above also shows that
172 tourists went to Asia and it was followed relatively close by Europe which had 170 tourists.
Africa and Oceani both had 26 and 39 tourists respectively.
tabler-icon-diamond-filled.svg

Paraphrase This Document

Need a fresh take? Get an instant paraphrase of this document with our AI Paraphraser
Document Page
References
Holcomb, Z. C. (2016). Fundamentals of descriptive statistics. Routledge.
Tang, W., Liao, Z., & Zou, Q. (2016). Which statistical significance test best detects
oncomiRNAs in cancer tissues? An exploratory analysis. Oncotarget, 7(51), 85613.
chevron_up_icon
1 out of 8
circle_padding
hide_on_mobile
zoom_out_icon
[object Object]