Tutor-marked Exercise 3: Computer Section
VerifiedAdded on 2022/12/09
|26
|783
|426
AI Summary
This document is a tutor-marked exercise for the computer section. It includes answers to various questions related to scatter plots, correlation tables, regression equations, and more.
Contribute Materials
Your contribution can guide someone’s learning journey. Share your
documents today.
Running head: TUTOR-MARKED EXERCISE 3: COMPUTER SECTION
Tutor-marked Exercise 3: Computer Section
Name of the Student:
Name of the University:
Author Note:
Tutor-marked Exercise 3: Computer Section
Name of the Student:
Name of the University:
Author Note:
Secure Best Marks with AI Grader
Need help grading? Try our AI Grader for instant feedback on your assignments.
1
TUTOR-MARKED EXERCISE 3: COMPUTER SECTION
Table of Contents
Answer 1....................................................................................................................................3
Answer 1. A. Scatter plot.......................................................................................................3
Answer 1. B. Correlation table...............................................................................................3
Answer 1. C. Relation at α=0.01............................................................................................4
Answer 1. D. Simple linear regression...................................................................................4
Answer 1. E. Histogram and Normal probability plot...........................................................4
Answer 1. F. Fitness of linear regression...............................................................................6
Answer 1. G. Regression equation.........................................................................................6
Answer 1. H. Prediction of price where size=1200 sq. ft......................................................6
Answer 1. I. Prediction of price where size=4000 sq. ft........................................................7
Answer 1. J. Prediction of the price of Vancouver house......................................................7
Answer 1. K. Coefficient of Determination...........................................................................7
Answer 1. L. Estimate of σε...................................................................................................8
Answer 1. M. H0: β0=0 at α=0.05...........................................................................................8
Answer 1. N. P-value for the test...........................................................................................8
Answer 1. O. H0: β1=0 at α=0.05............................................................................................8
Answer 1. P. P-value for the test............................................................................................9
Answer 1. Q. AOV of the regression output..........................................................................9
Reference..................................................................................................................................10
Appendices...............................................................................................................................11
Appendix 1...........................................................................................................................11
2
TUTOR-MARKED EXERCISE 3: COMPUTER SECTION
Appendix 2...........................................................................................................................12
Appendix 3...........................................................................................................................13
Appendix 4...........................................................................................................................18
3
TUTOR-MARKED EXERCISE 3: COMPUTER SECTION
Answer 1
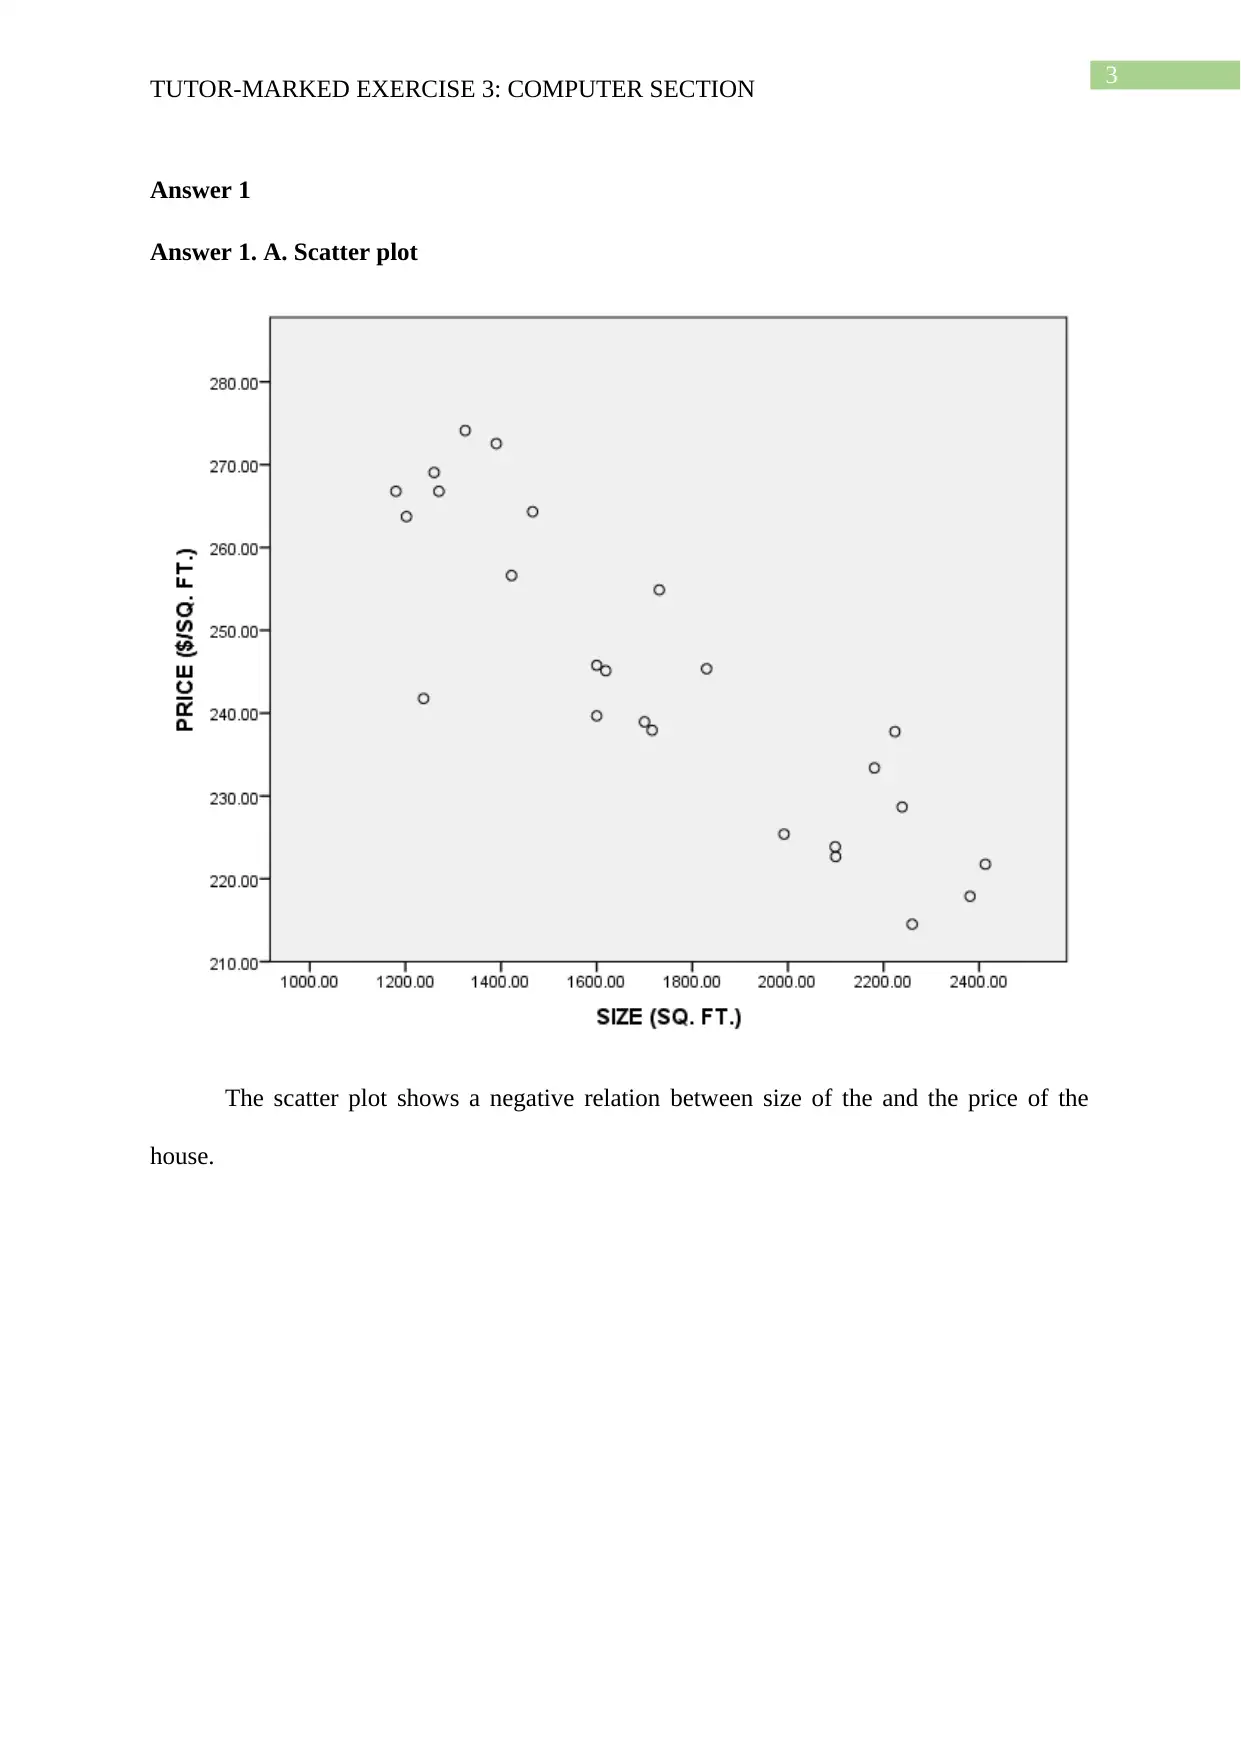
Answer 1. A. Scatter plot
The scatter plot shows a negative relation between size of the and the price of the
house.
TUTOR-MARKED EXERCISE 3: COMPUTER SECTION
Answer 1
Answer 1. A. Scatter plot
The scatter plot shows a negative relation between size of the and the price of the
house.
Secure Best Marks with AI Grader
Need help grading? Try our AI Grader for instant feedback on your assignments.
4
TUTOR-MARKED EXERCISE 3: COMPUTER SECTION
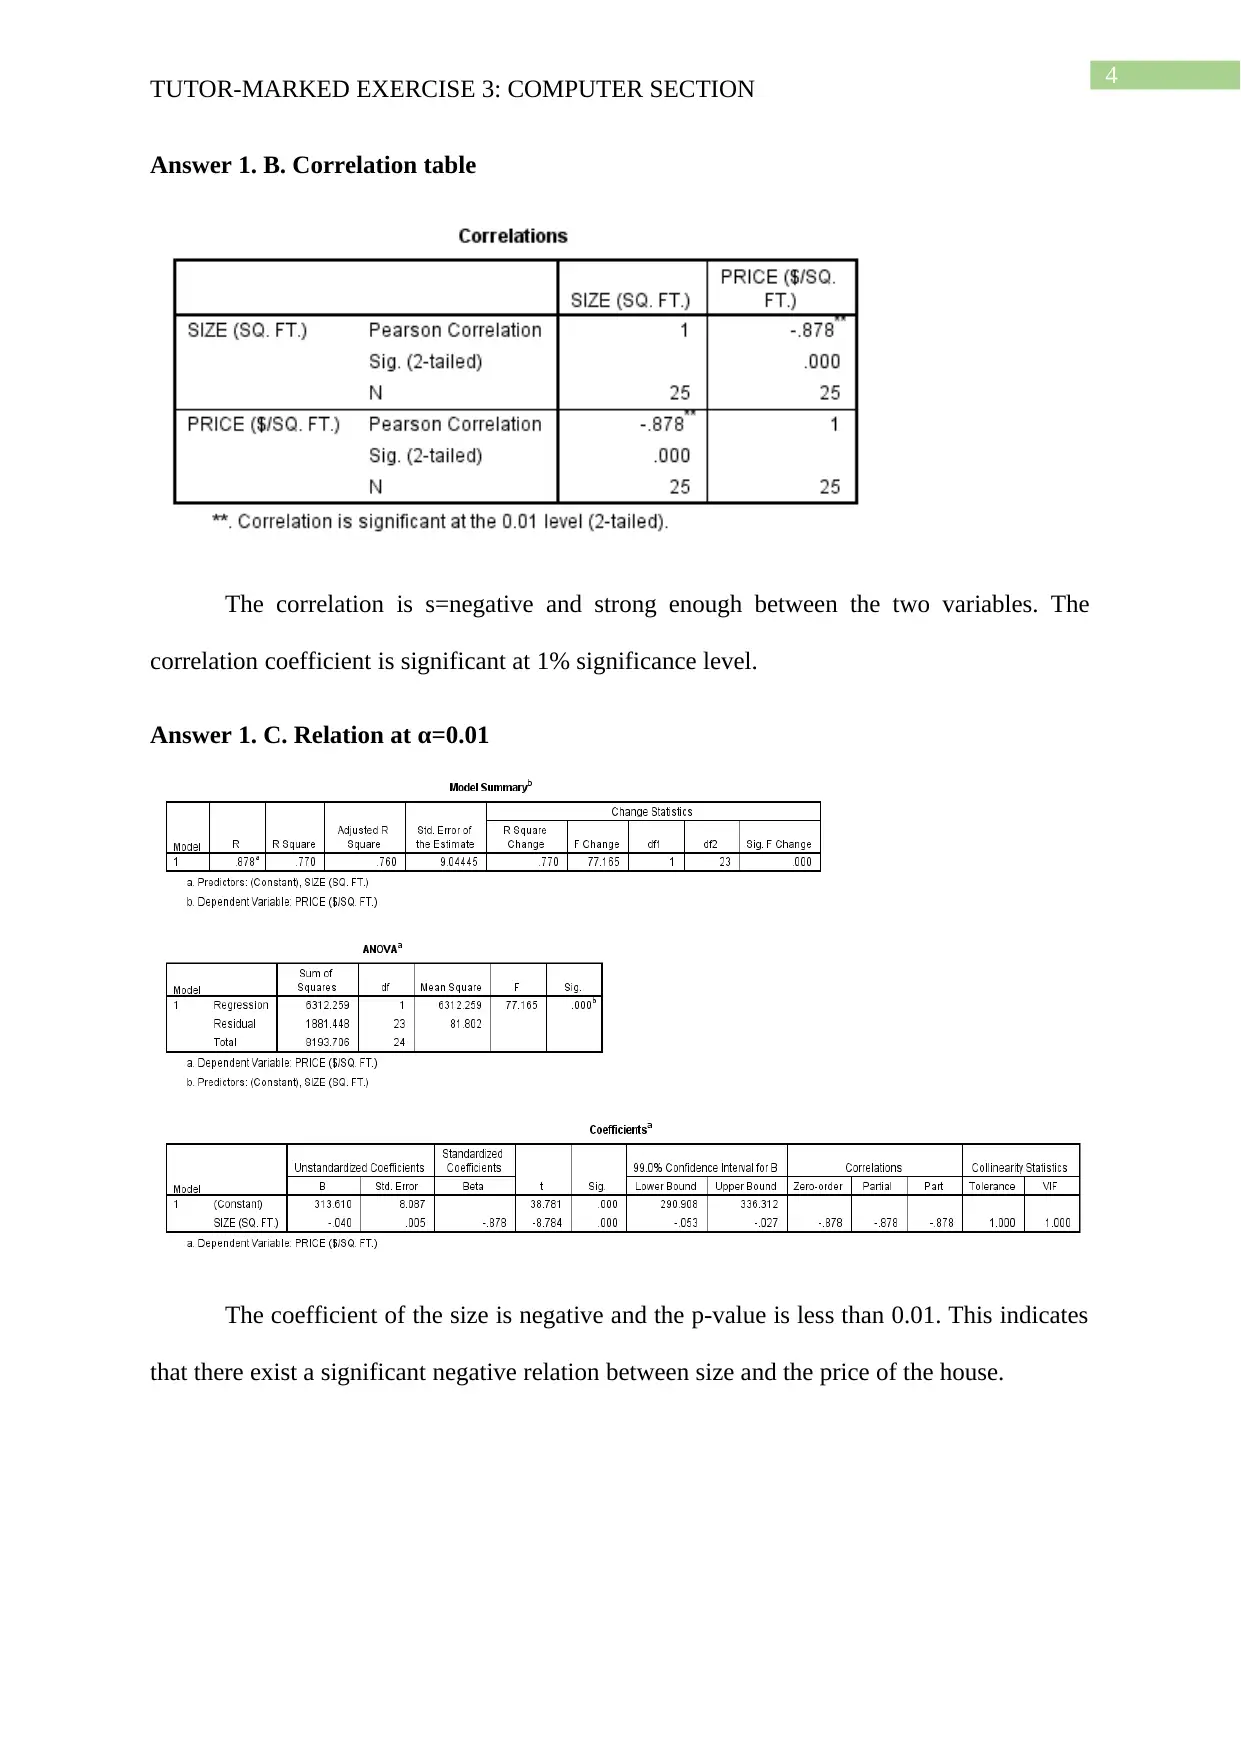
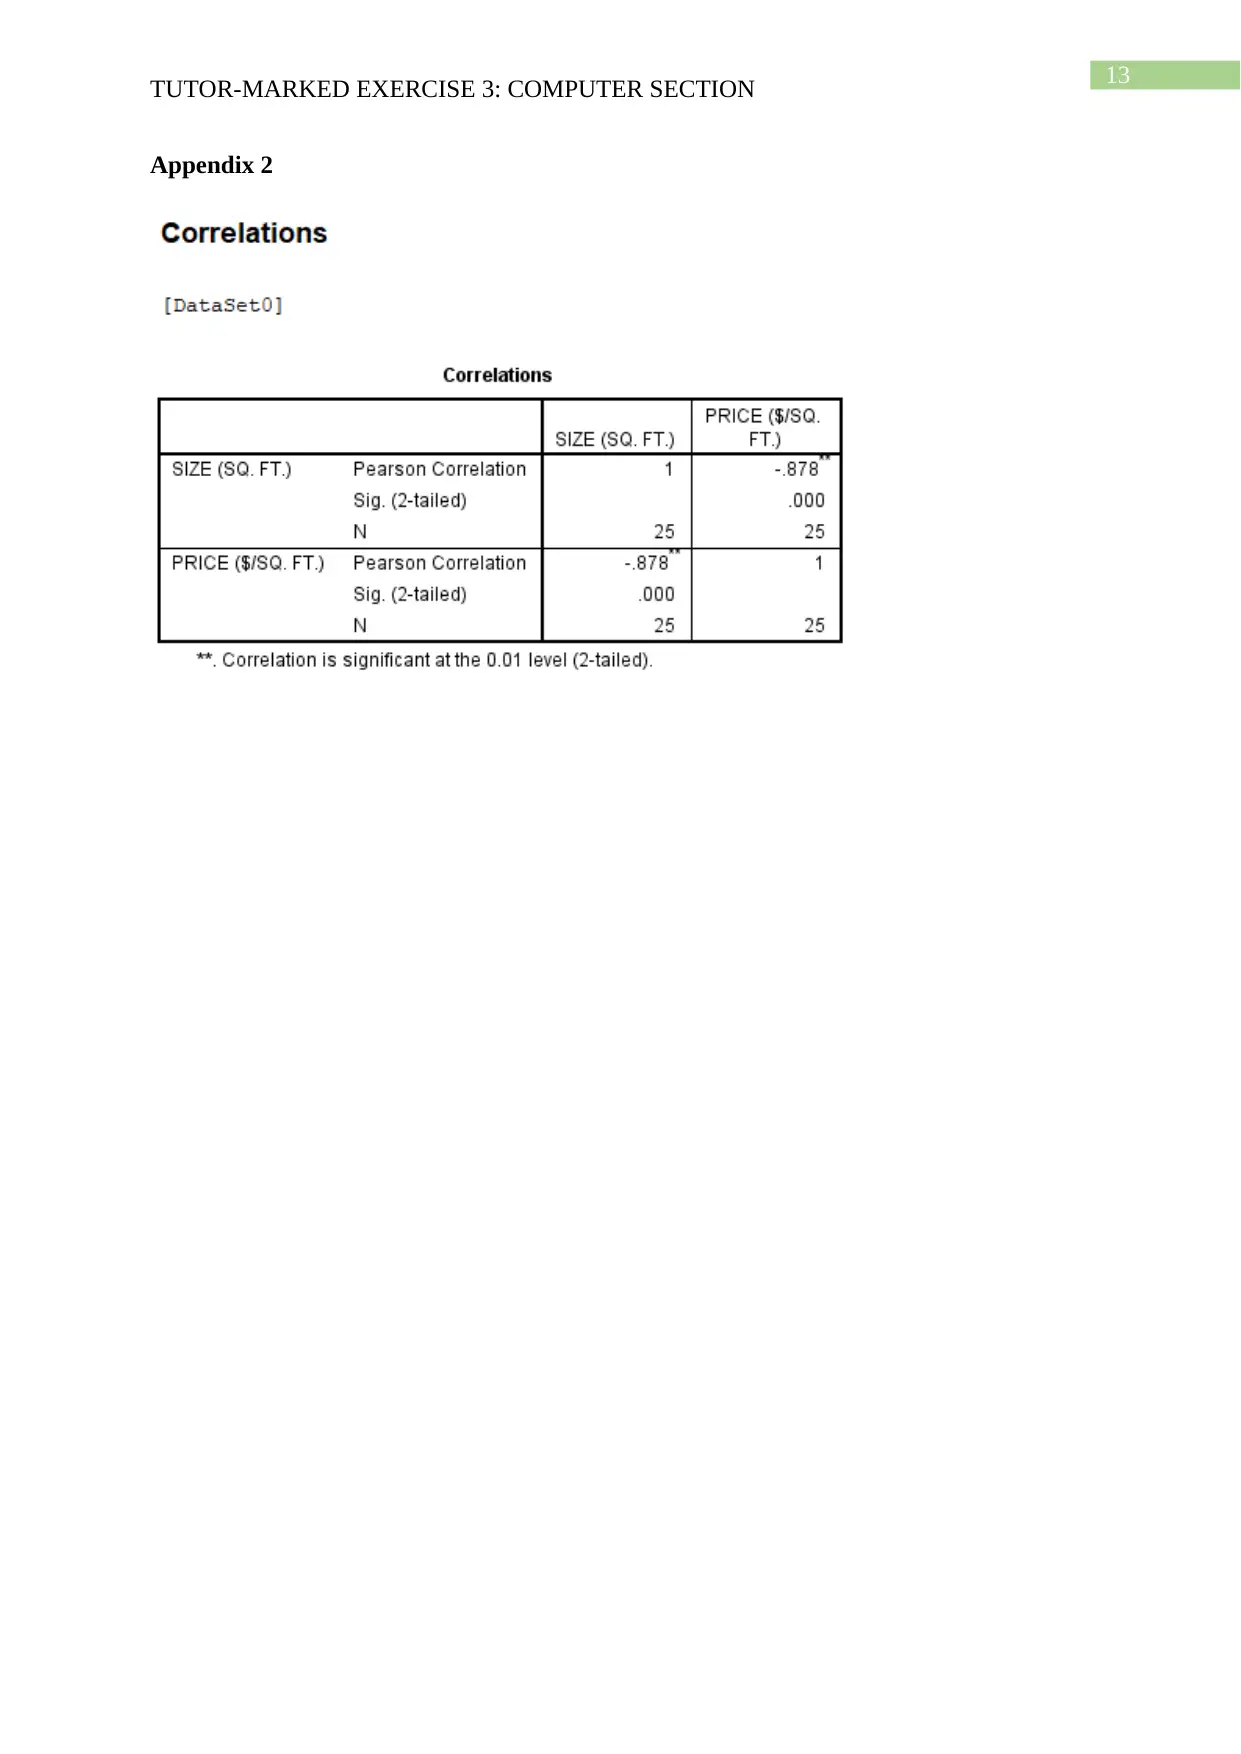
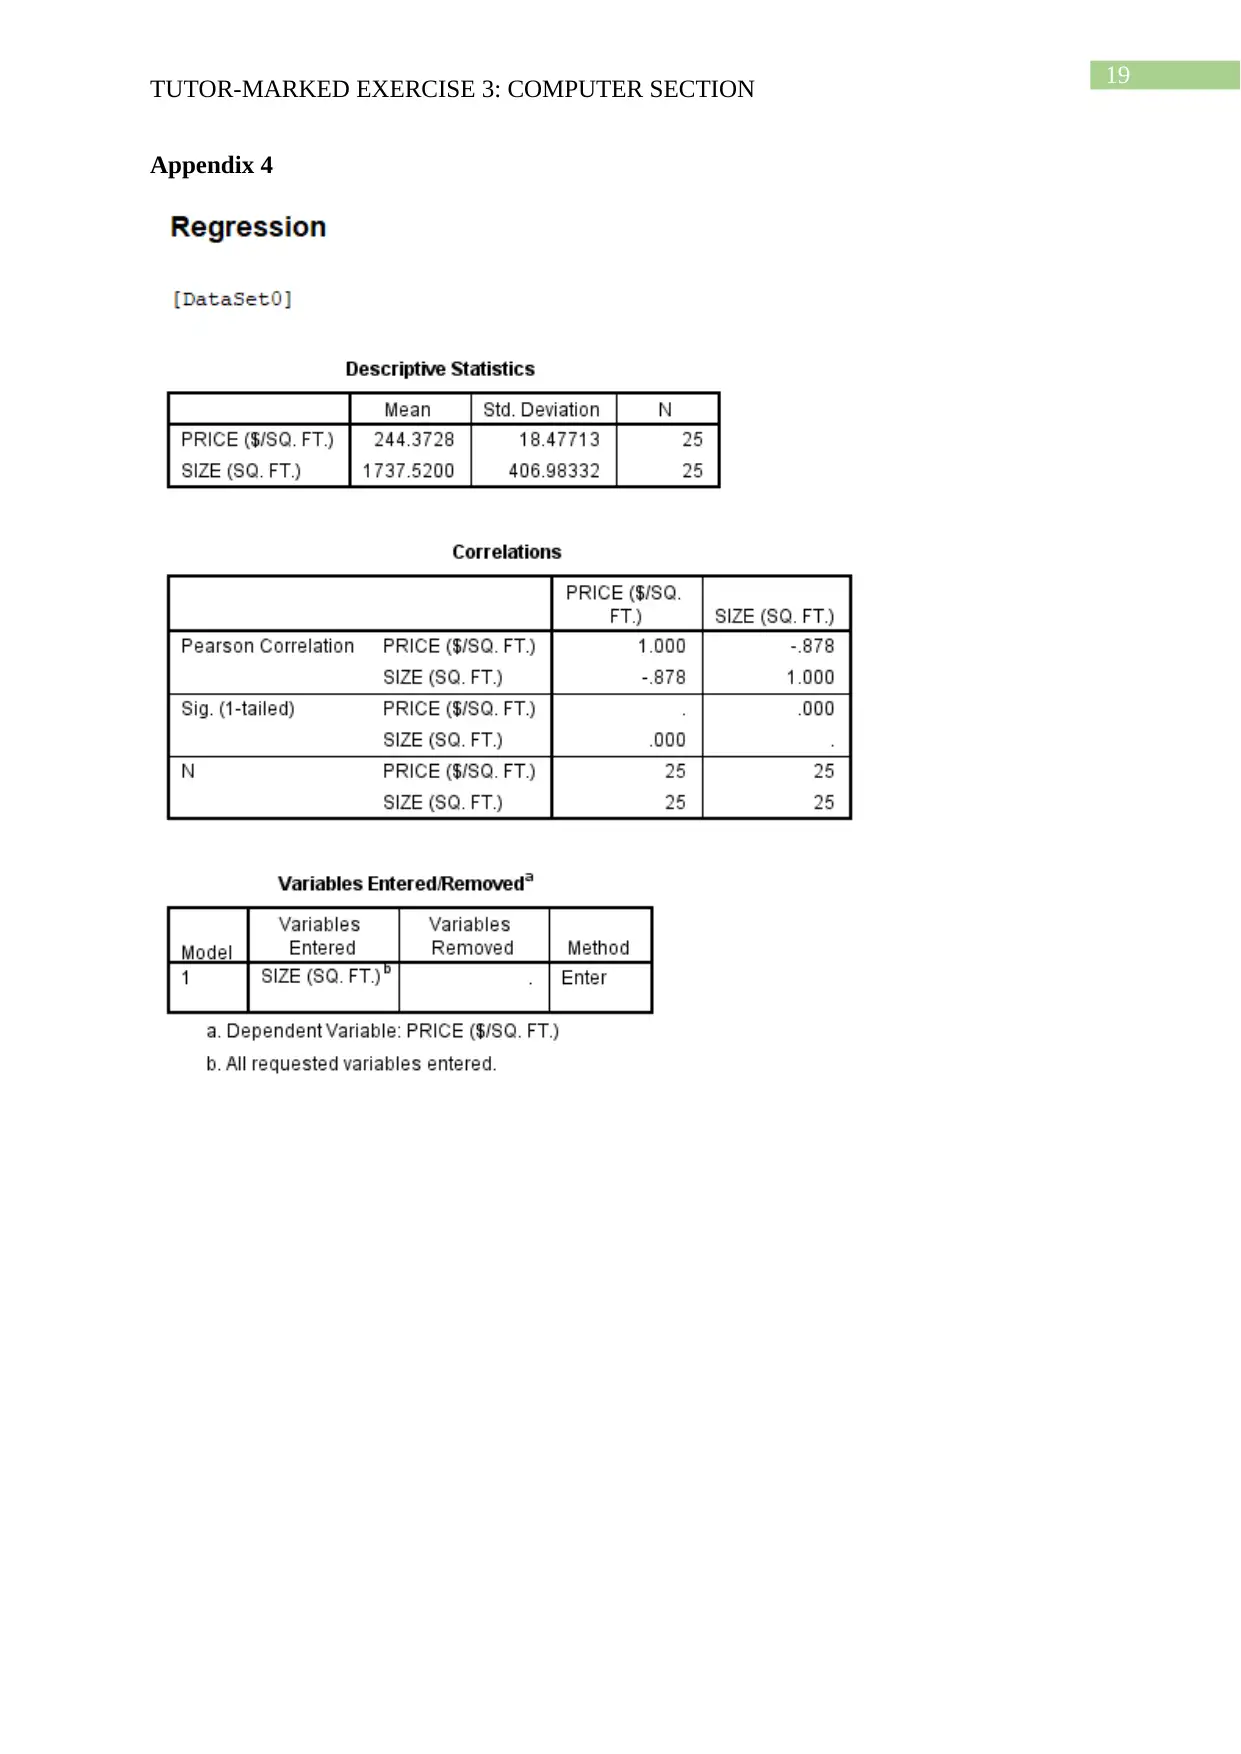
Answer 1. B. Correlation table
The correlation is s=negative and strong enough between the two variables. The
correlation coefficient is significant at 1% significance level.
Answer 1. C. Relation at α=0.01
The coefficient of the size is negative and the p-value is less than 0.01. This indicates
that there exist a significant negative relation between size and the price of the house.
TUTOR-MARKED EXERCISE 3: COMPUTER SECTION
Answer 1. B. Correlation table
The correlation is s=negative and strong enough between the two variables. The
correlation coefficient is significant at 1% significance level.
Answer 1. C. Relation at α=0.01
The coefficient of the size is negative and the p-value is less than 0.01. This indicates
that there exist a significant negative relation between size and the price of the house.
5
TUTOR-MARKED EXERCISE 3: COMPUTER SECTION
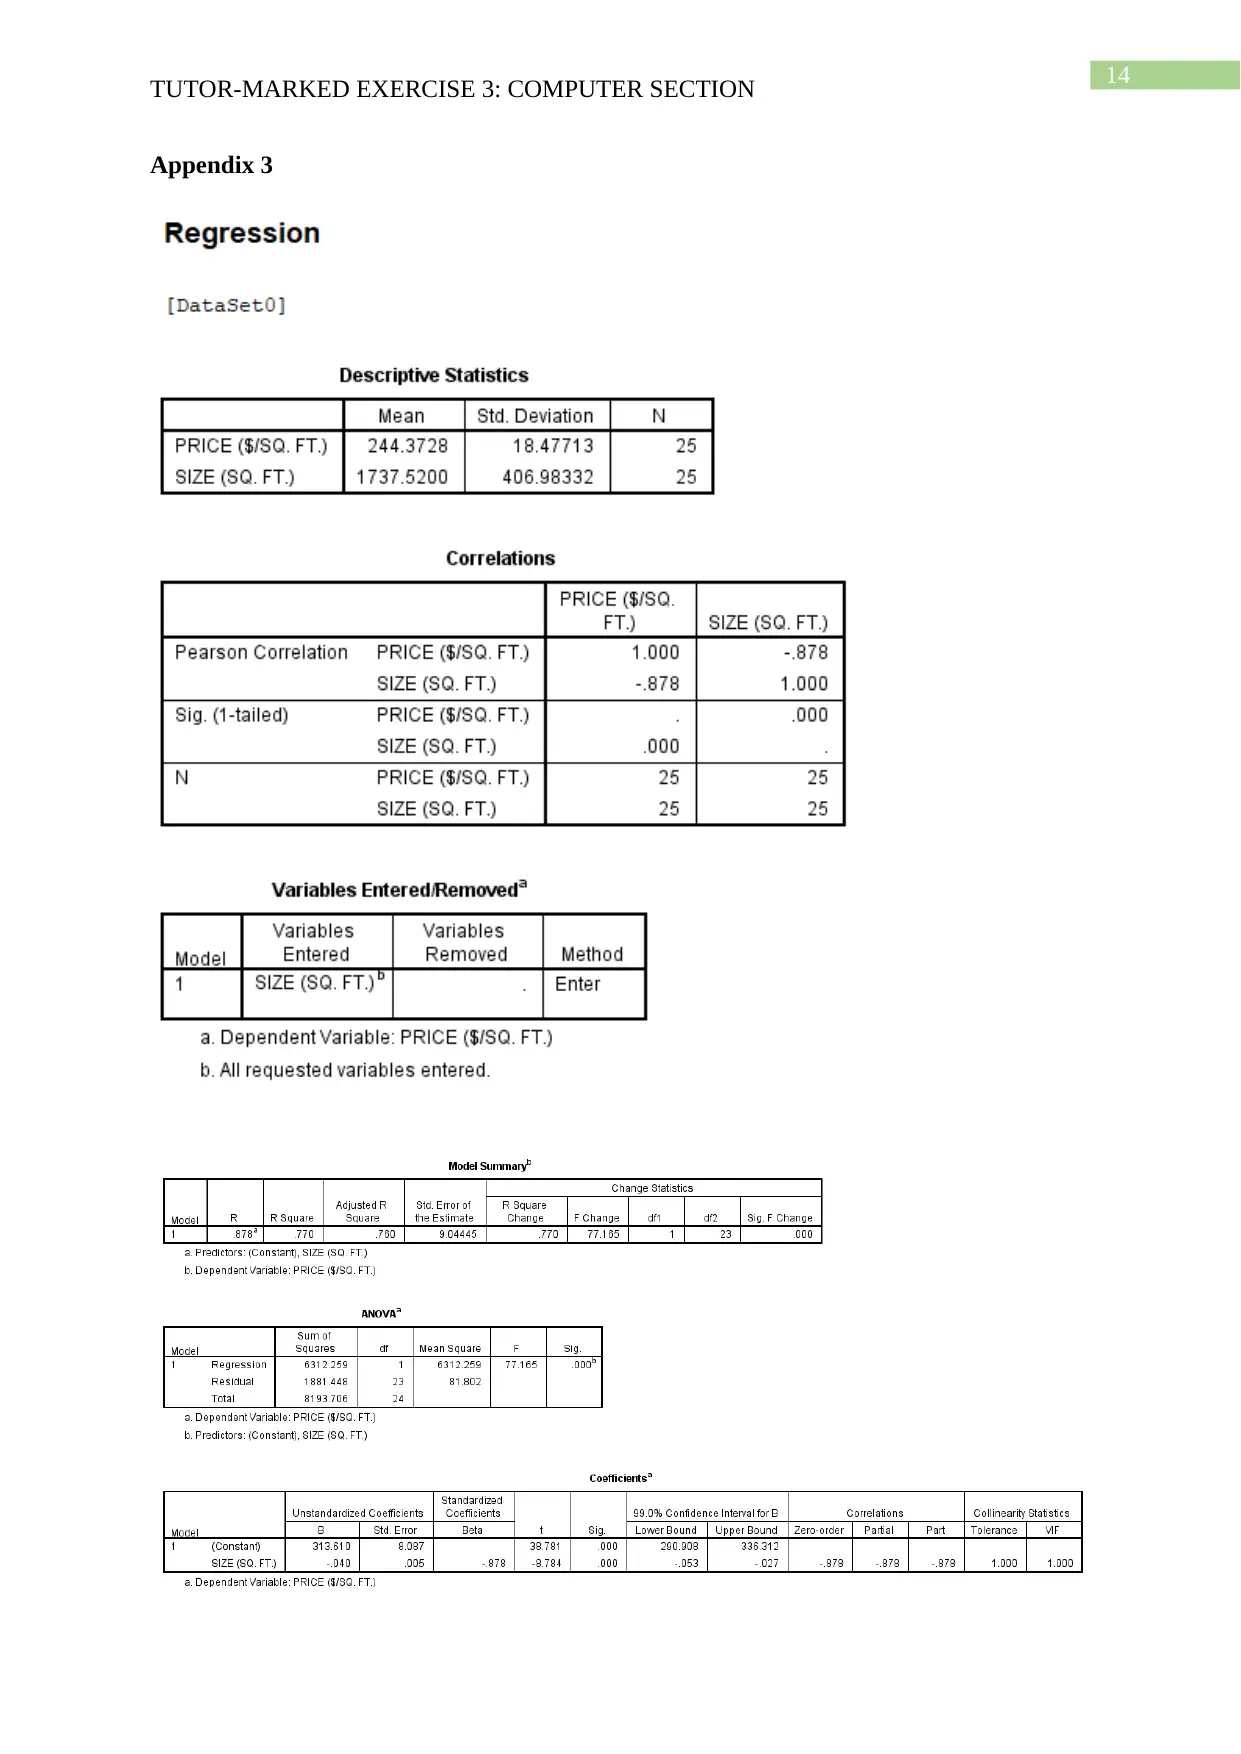
Answer 1. D. Simple linear regression
Answer 1. E. Histogram and Normal probability plot
TUTOR-MARKED EXERCISE 3: COMPUTER SECTION
Answer 1. D. Simple linear regression
Answer 1. E. Histogram and Normal probability plot
6
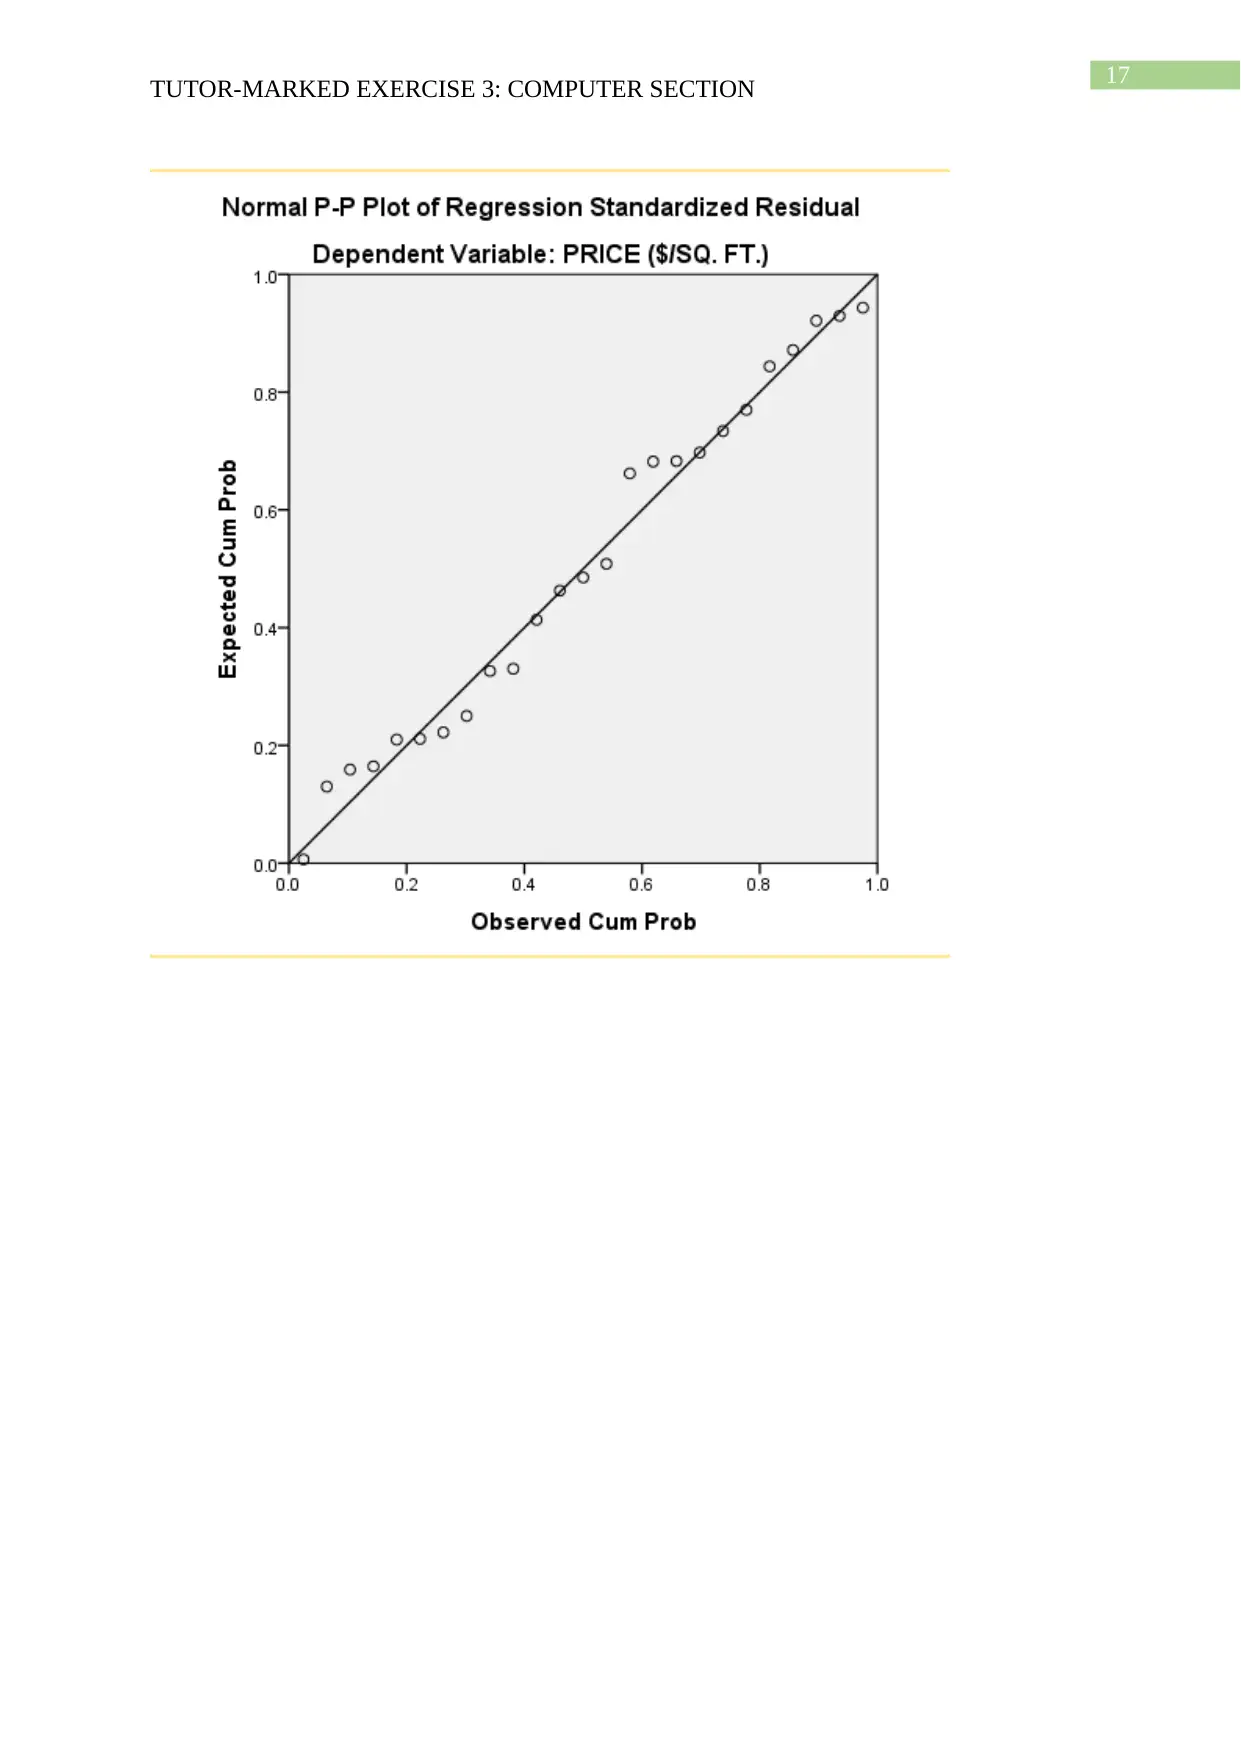
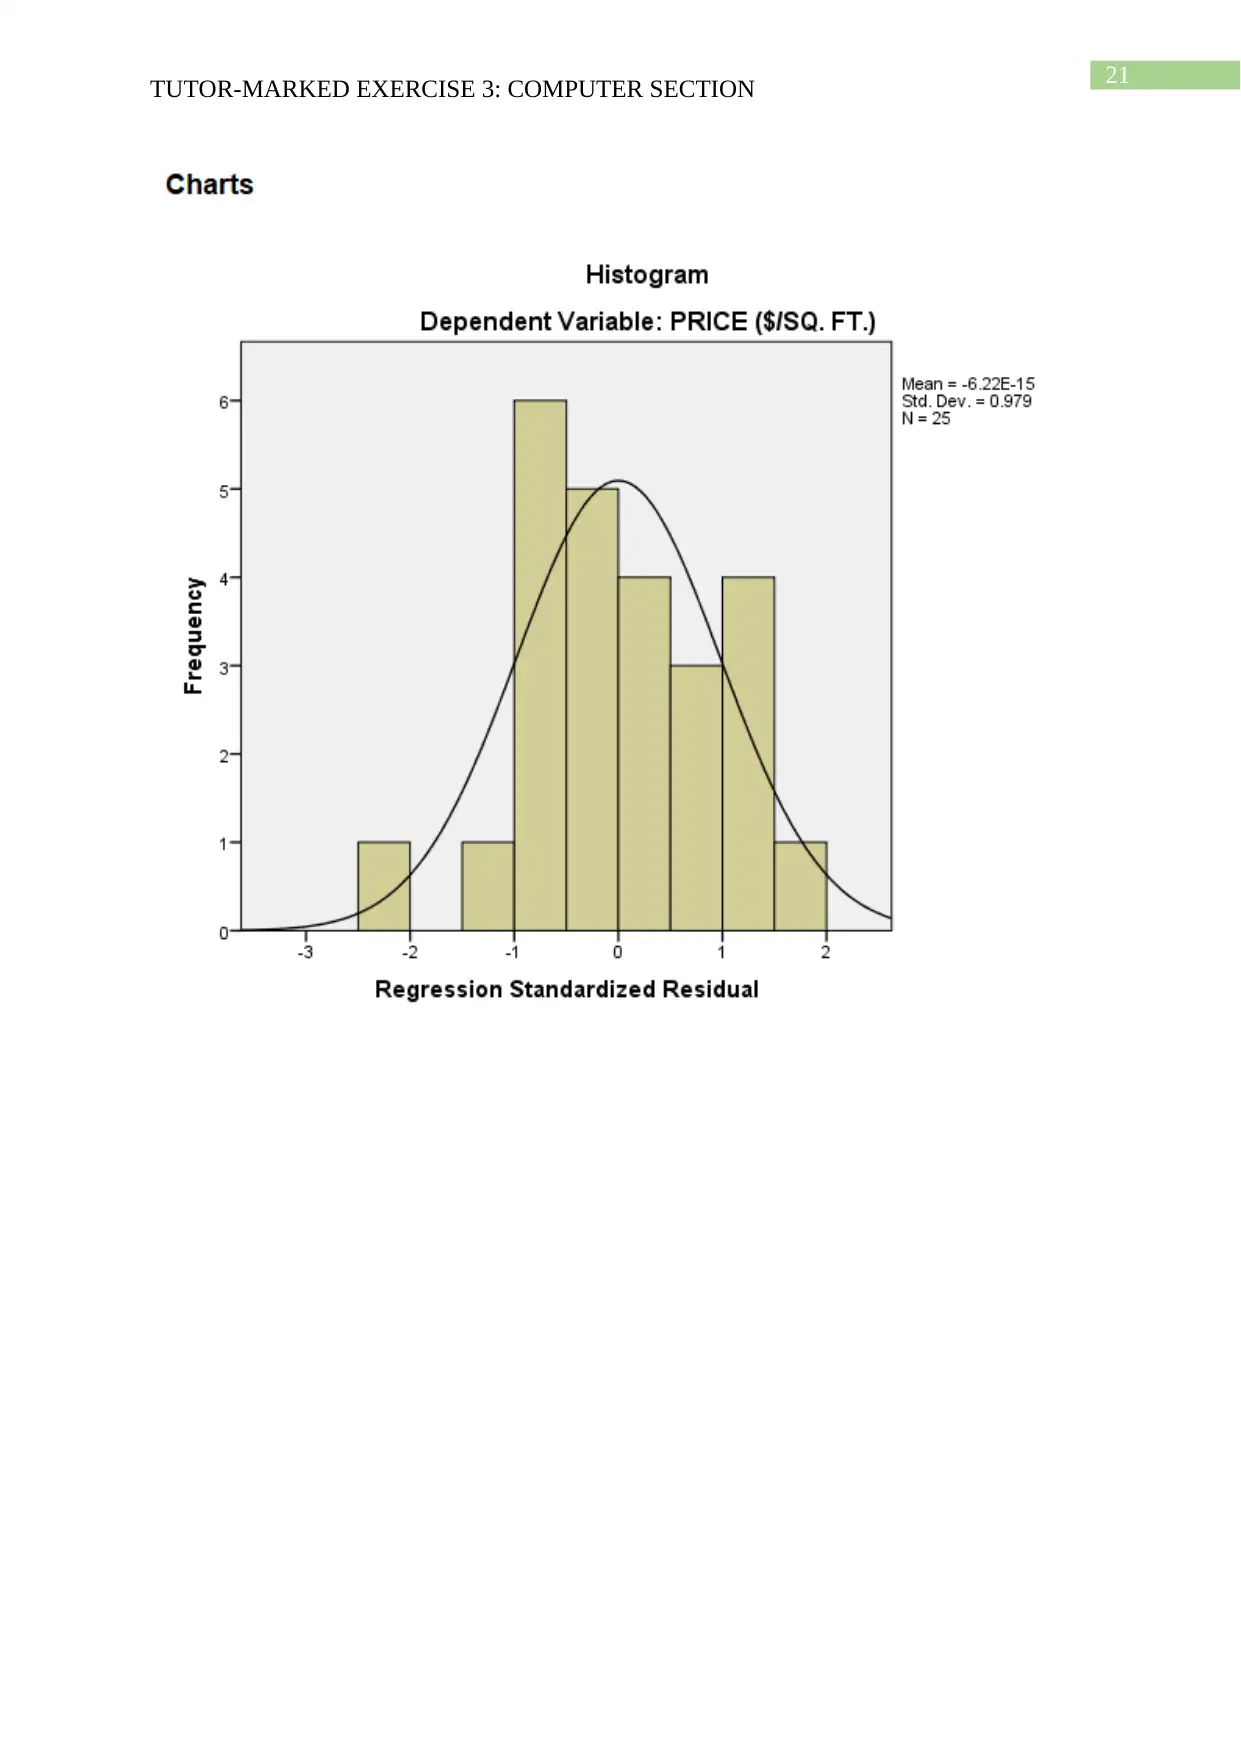
TUTOR-MARKED EXERCISE 3: COMPUTER SECTION
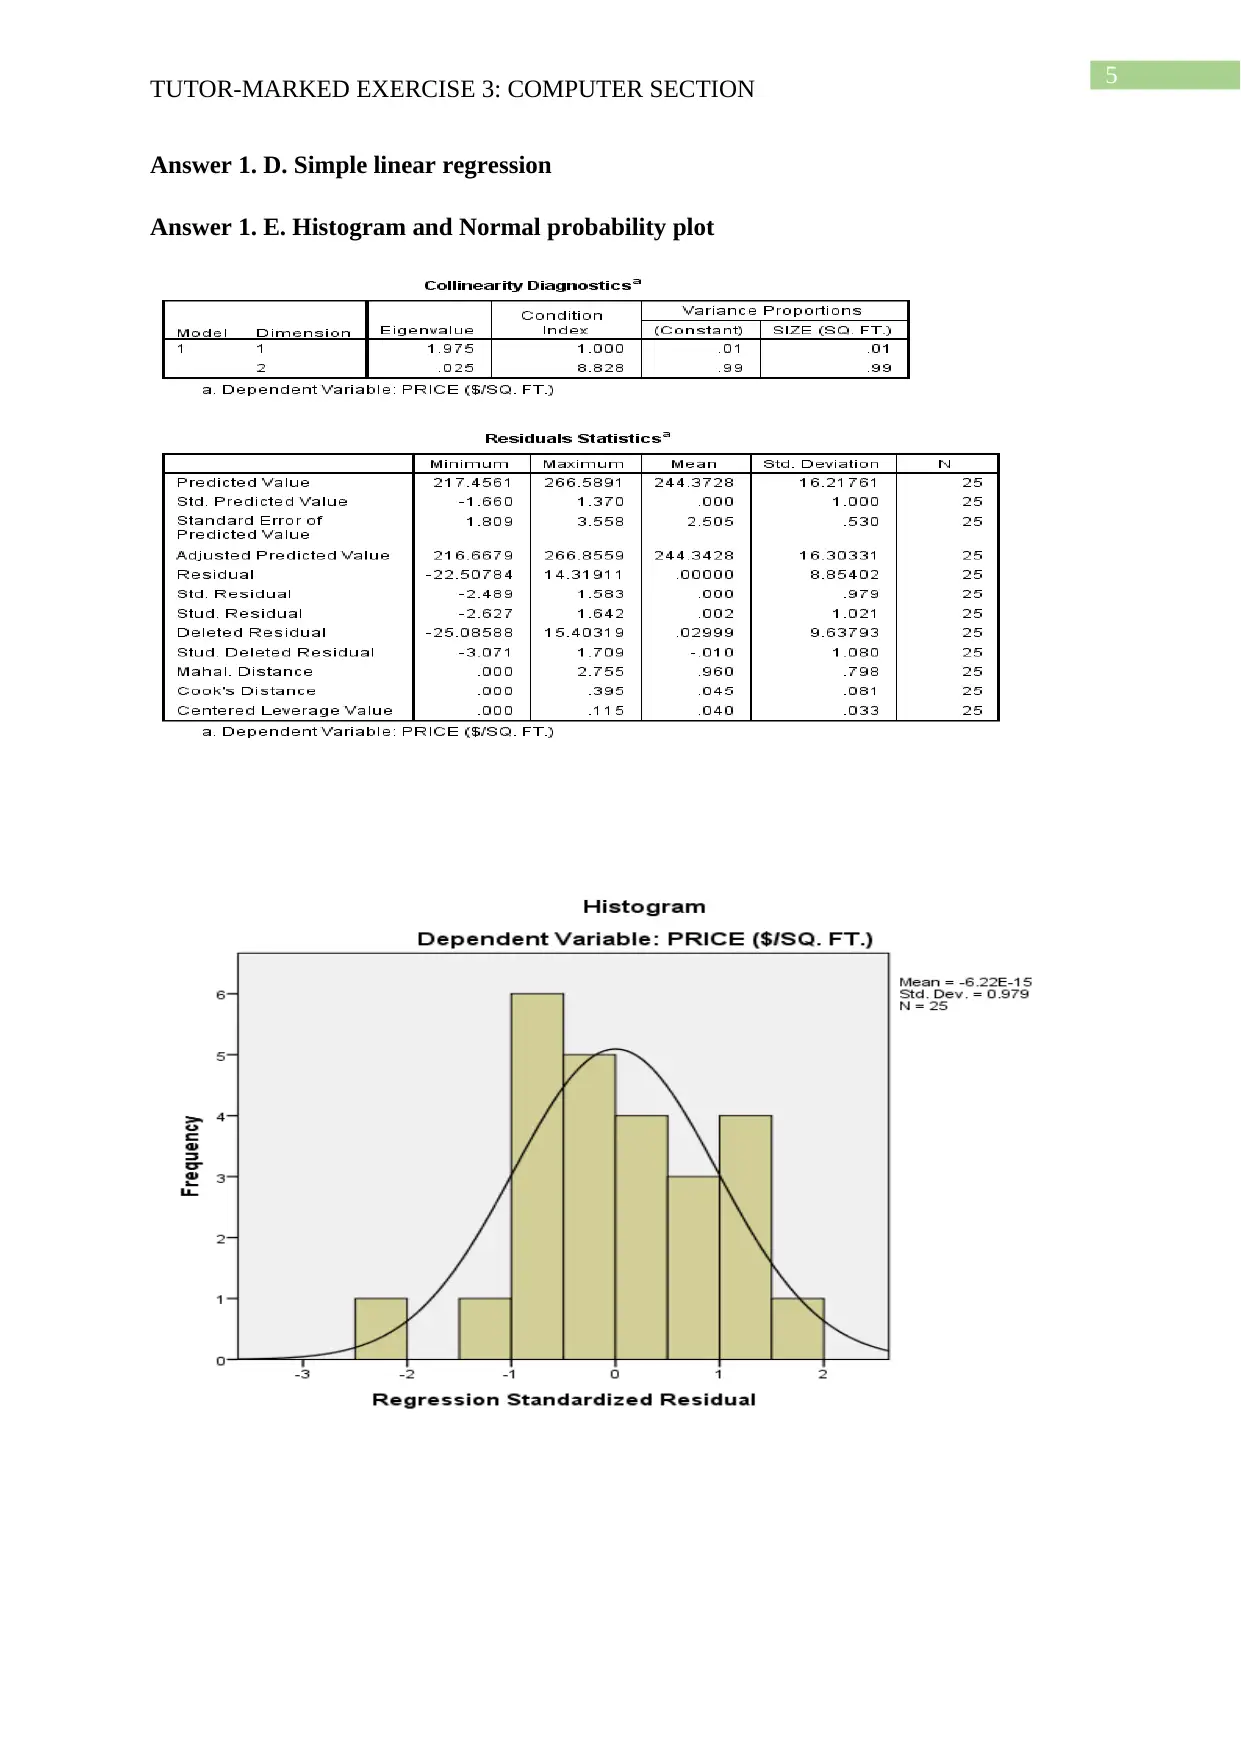
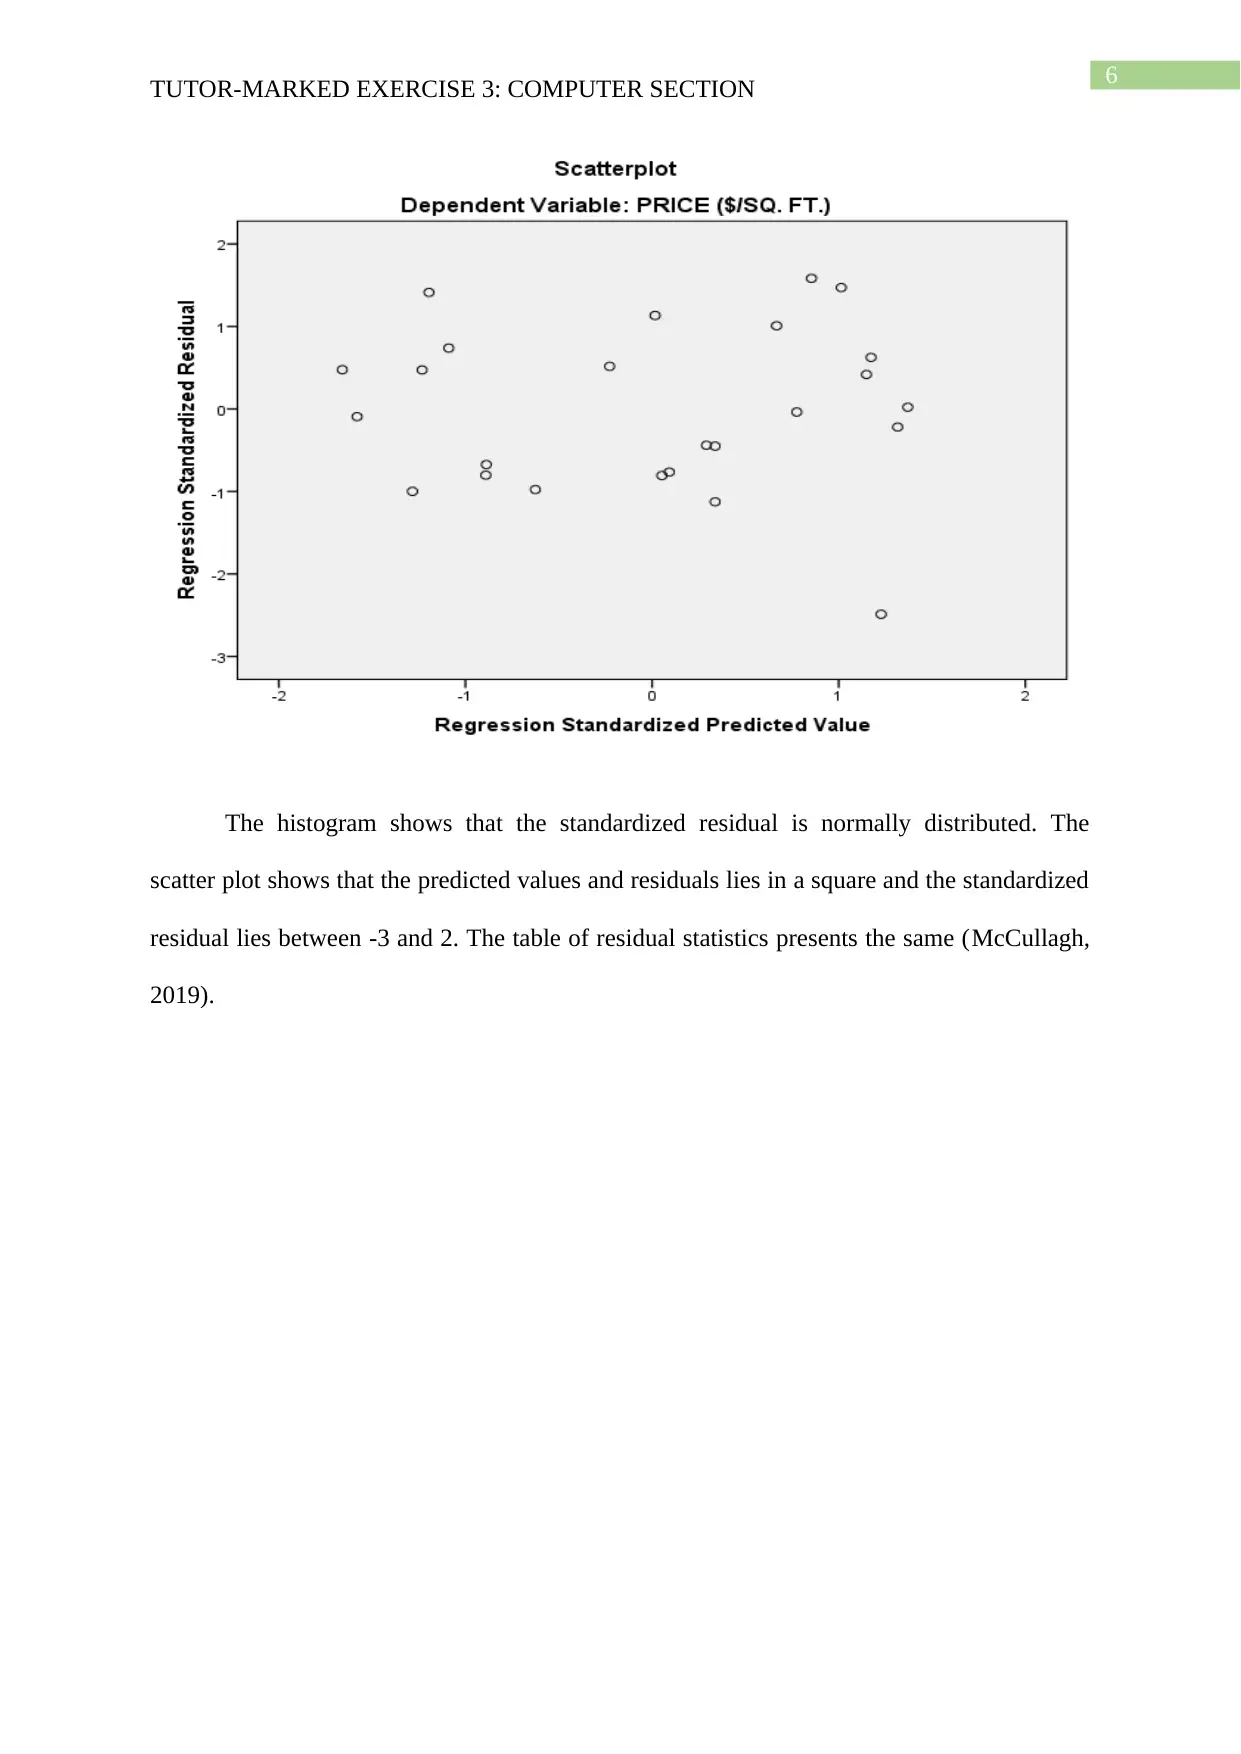
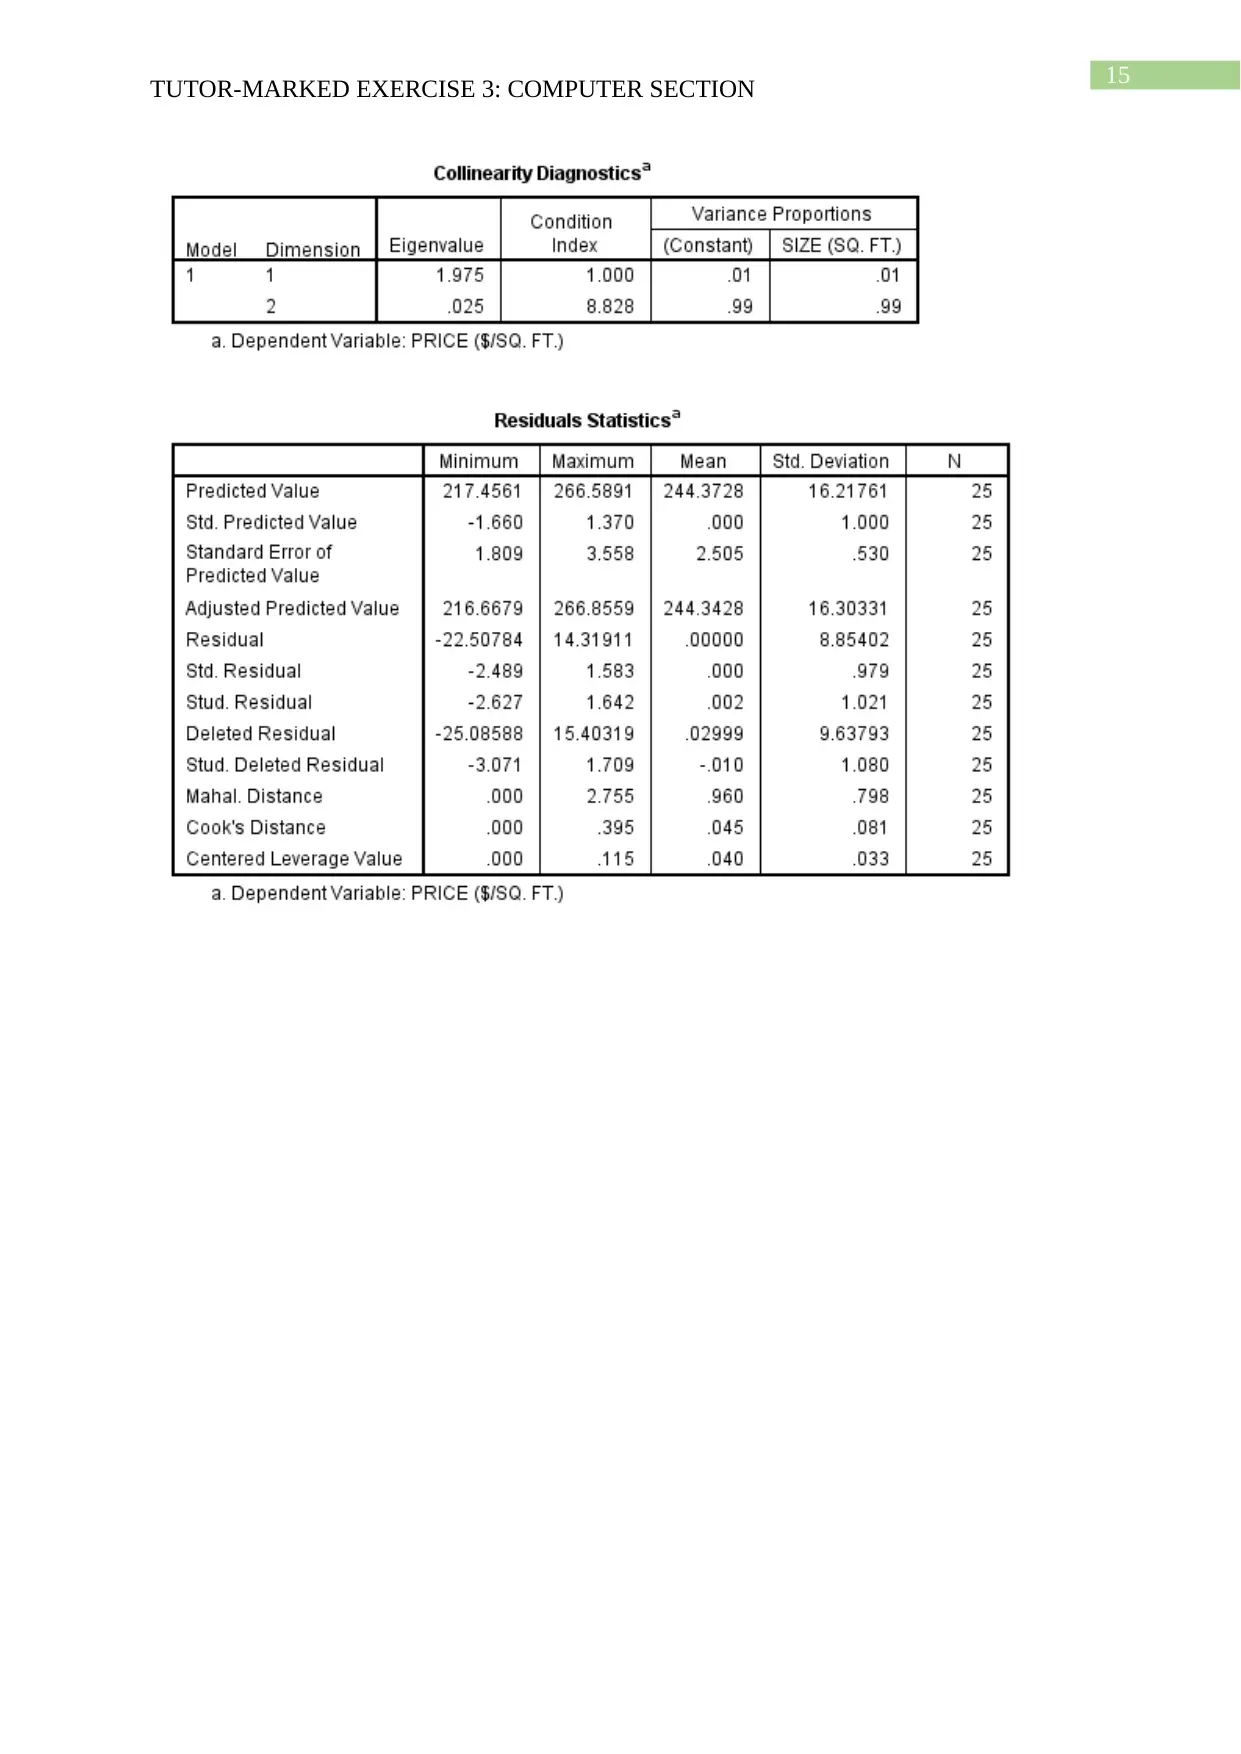
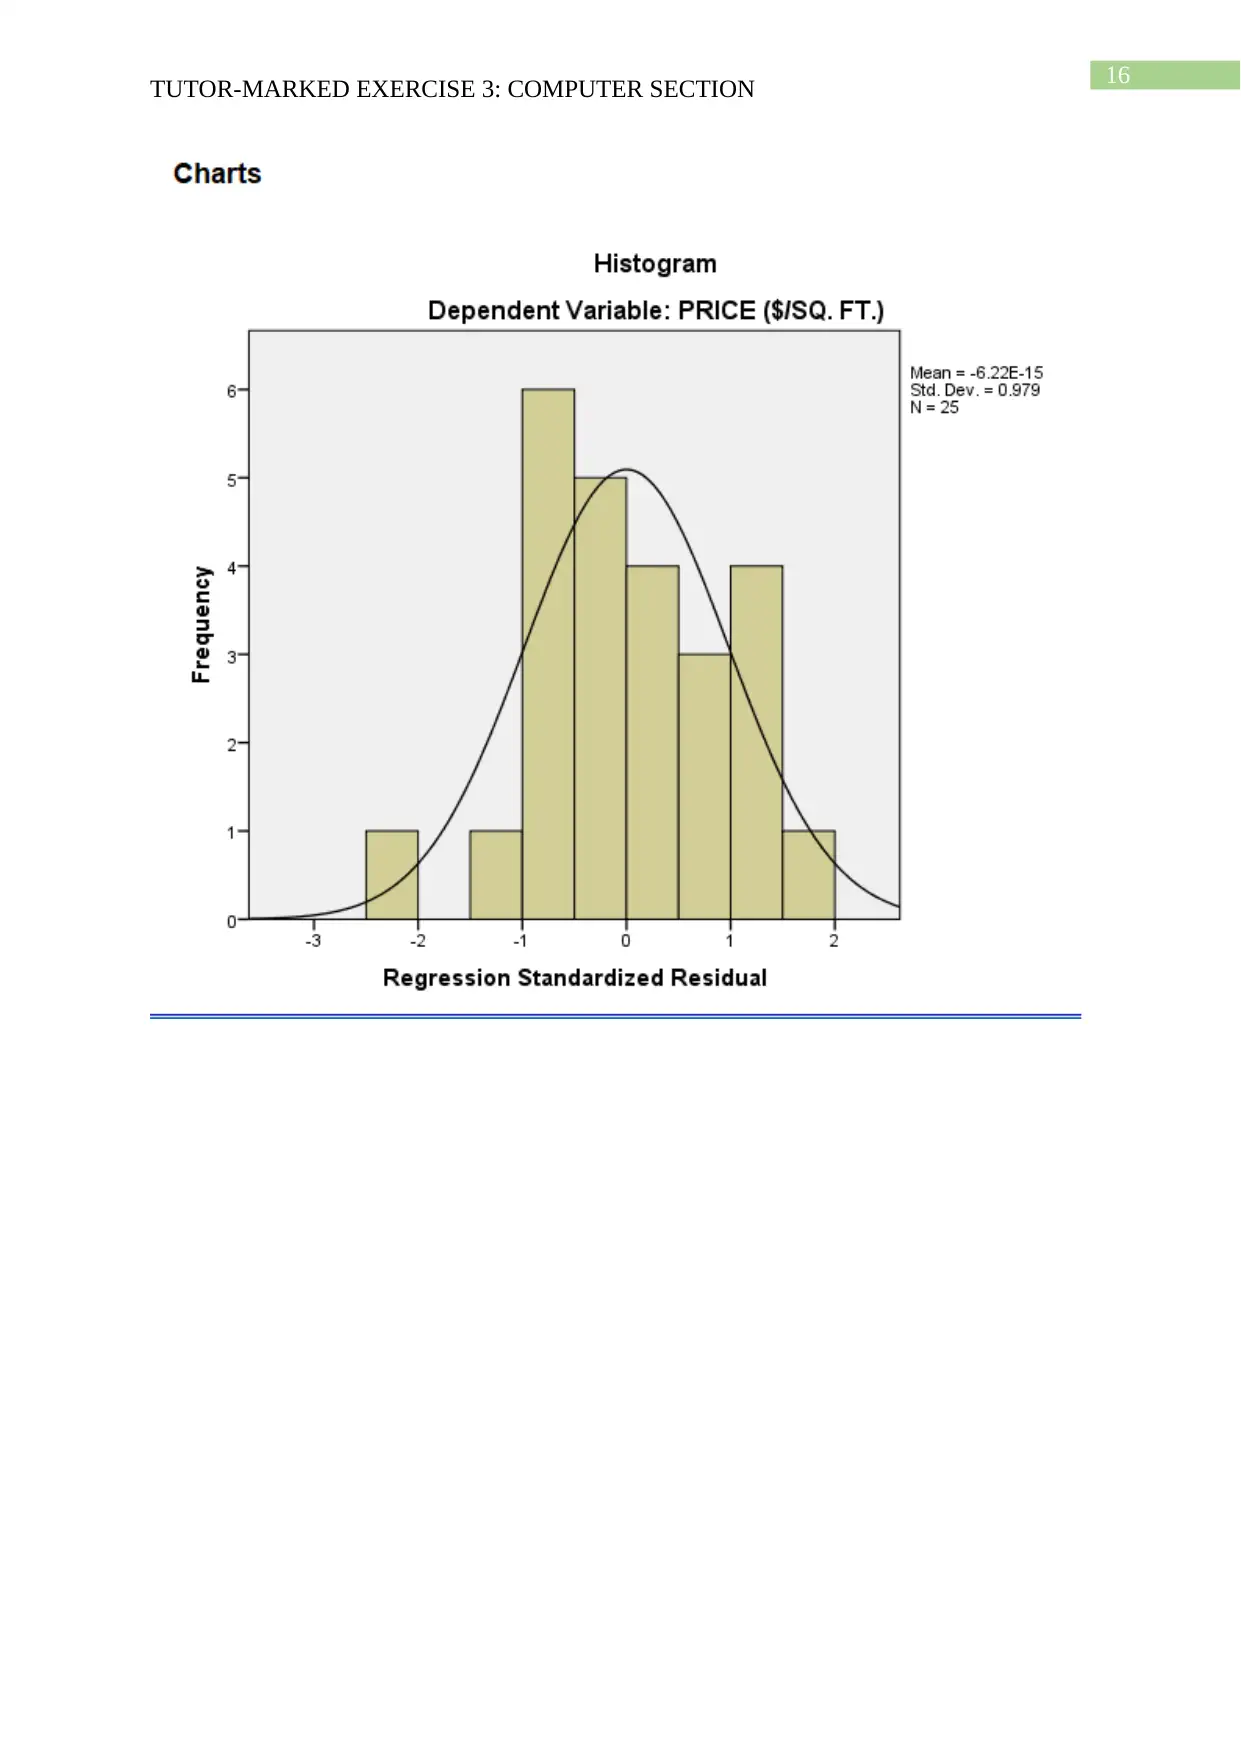
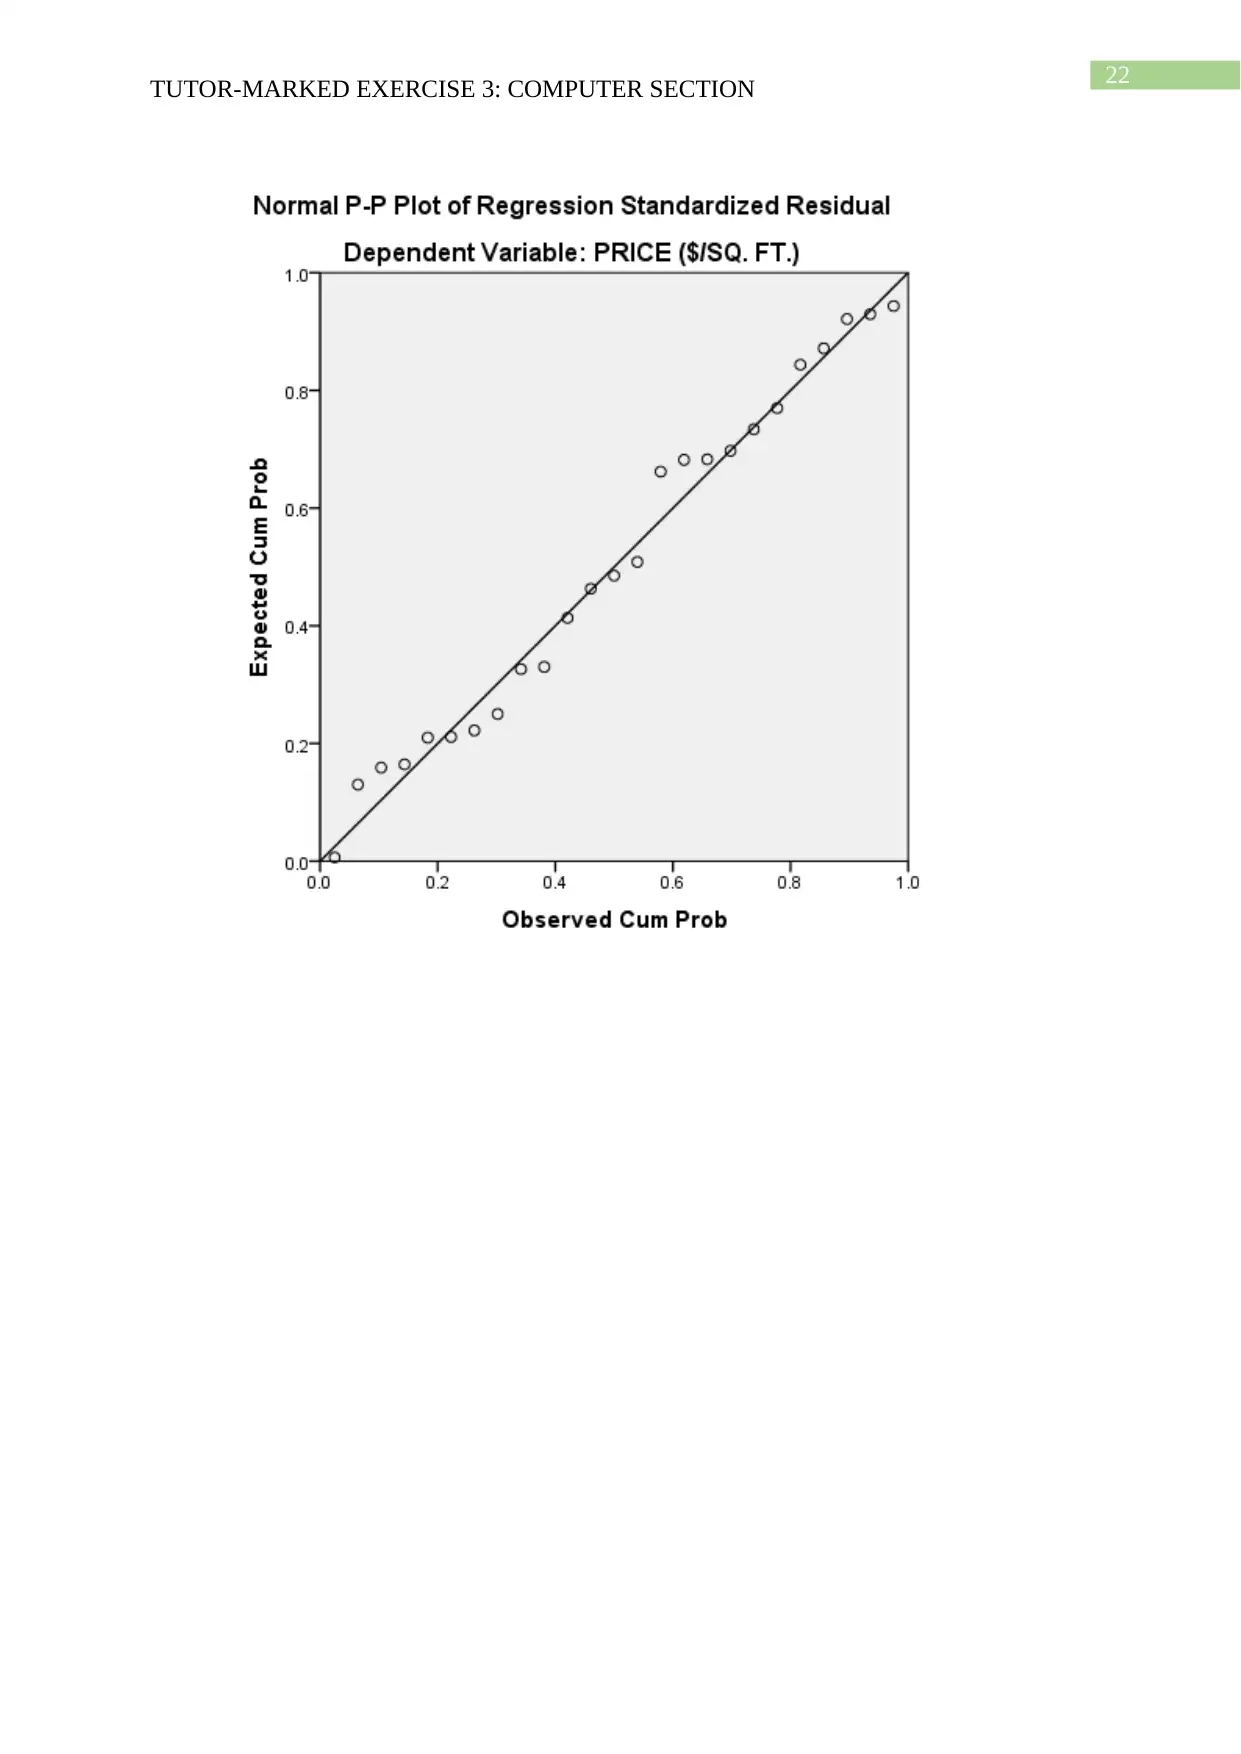
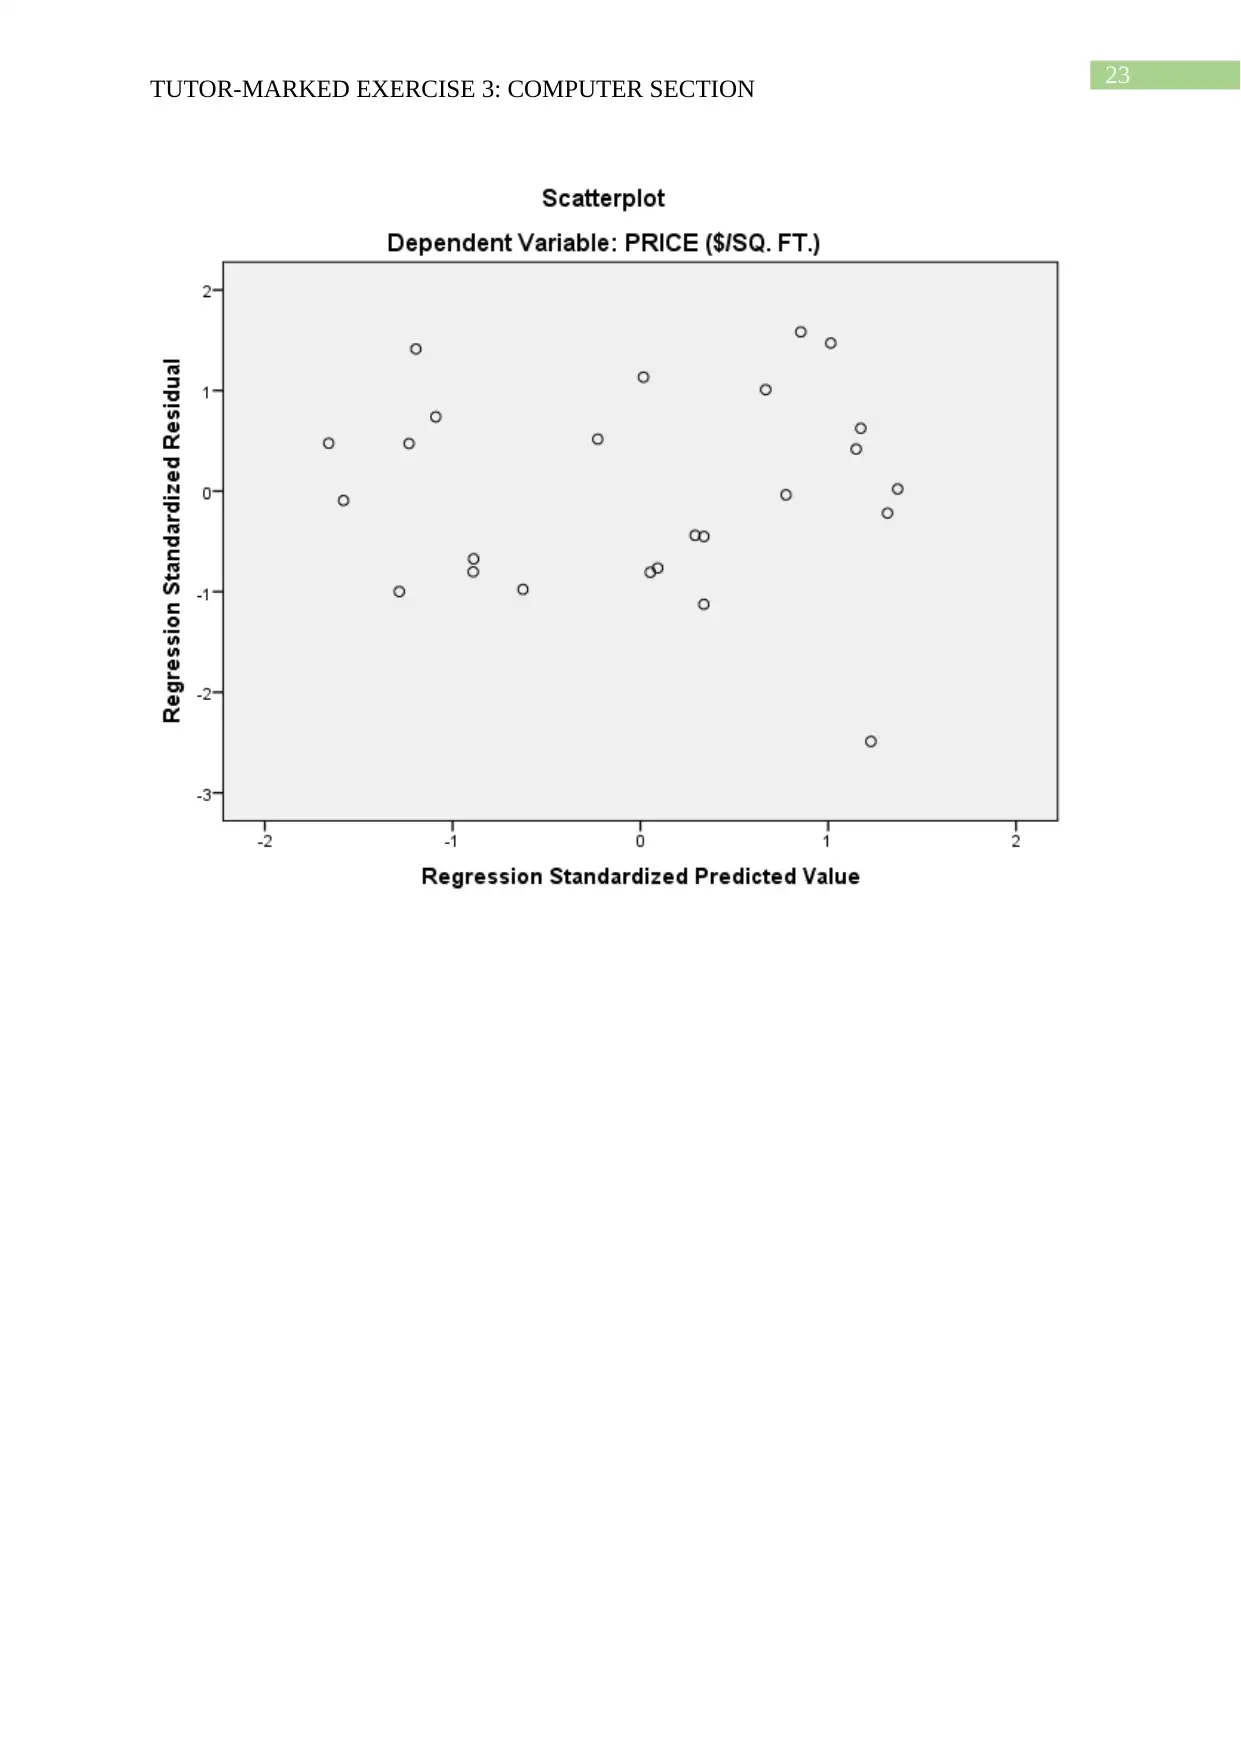
The histogram shows that the standardized residual is normally distributed. The
scatter plot shows that the predicted values and residuals lies in a square and the standardized
residual lies between -3 and 2. The table of residual statistics presents the same (McCullagh,
2019).
TUTOR-MARKED EXERCISE 3: COMPUTER SECTION
The histogram shows that the standardized residual is normally distributed. The
scatter plot shows that the predicted values and residuals lies in a square and the standardized
residual lies between -3 and 2. The table of residual statistics presents the same (McCullagh,
2019).
Paraphrase This Document
Need a fresh take? Get an instant paraphrase of this document with our AI Paraphraser
7
TUTOR-MARKED EXERCISE 3: COMPUTER SECTION
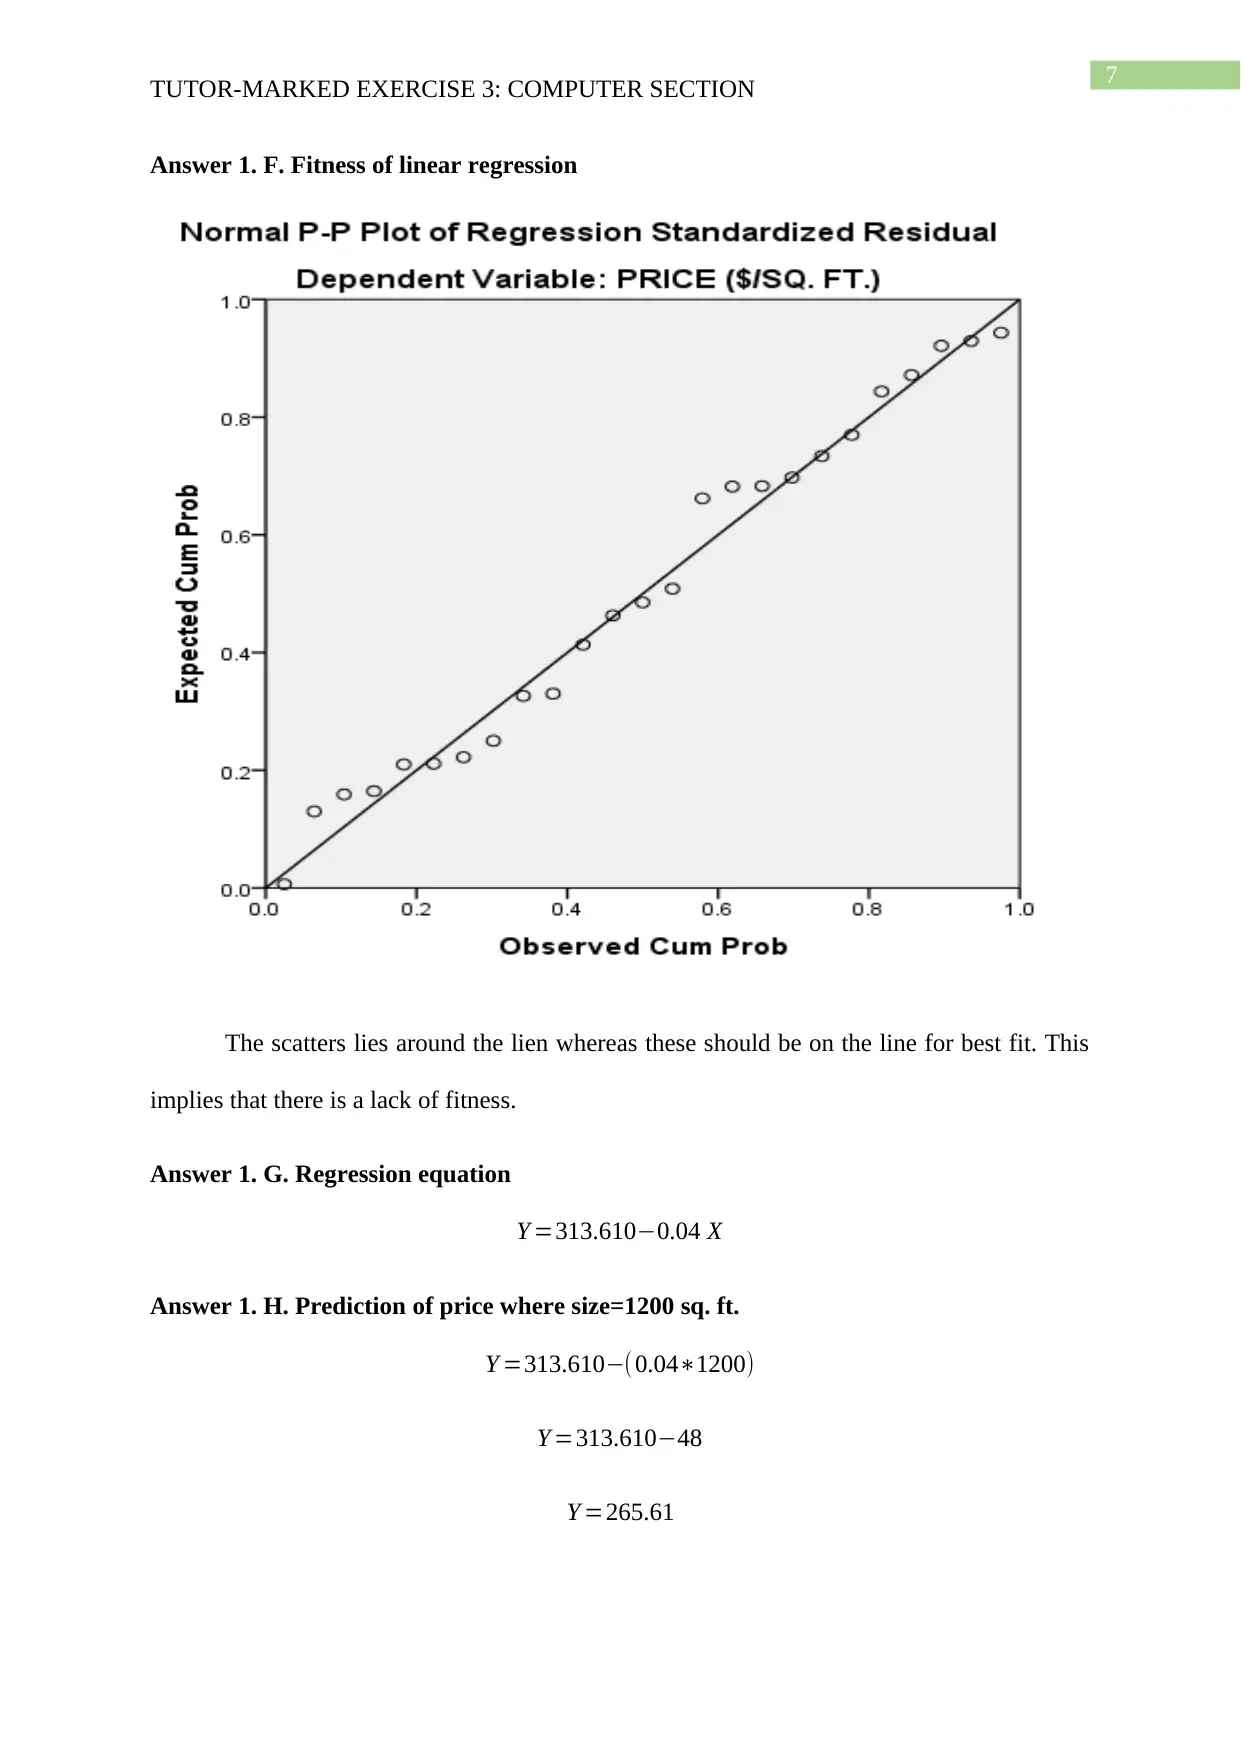
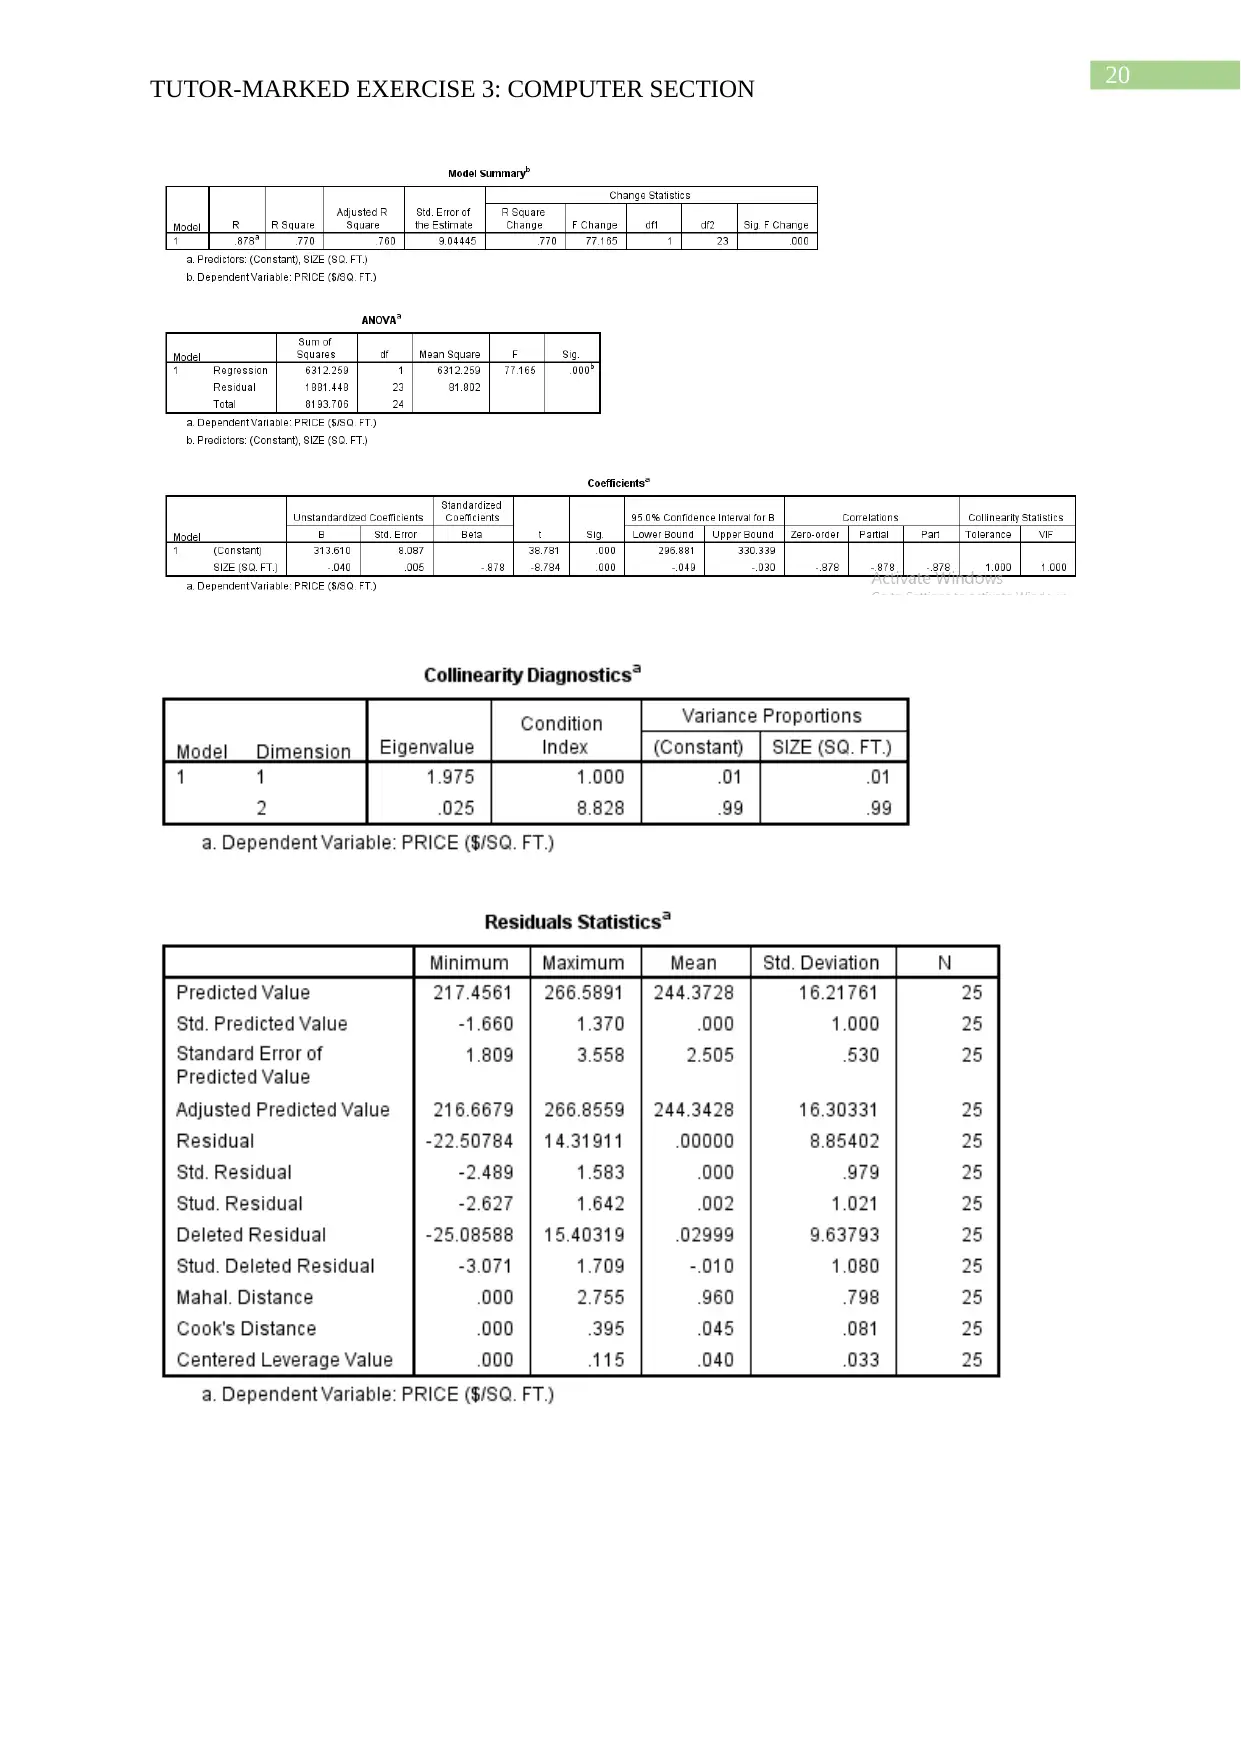
Answer 1. F. Fitness of linear regression
The scatters lies around the lien whereas these should be on the line for best fit. This
implies that there is a lack of fitness.
Answer 1. G. Regression equation
Y =313.610−0.04 X
Answer 1. H. Prediction of price where size=1200 sq. ft.
Y =313.610−( 0.04∗1200)
Y =313.610−48
Y =265.61
TUTOR-MARKED EXERCISE 3: COMPUTER SECTION
Answer 1. F. Fitness of linear regression
The scatters lies around the lien whereas these should be on the line for best fit. This
implies that there is a lack of fitness.
Answer 1. G. Regression equation
Y =313.610−0.04 X
Answer 1. H. Prediction of price where size=1200 sq. ft.
Y =313.610−( 0.04∗1200)
Y =313.610−48
Y =265.61
8
TUTOR-MARKED EXERCISE 3: COMPUTER SECTION
Answer 1. I. Prediction of price where size=4000 sq. ft.
Y =313.610−0.04∗4000
Y =313.610−160
Y =153.61
The regression equation is able to provide the price but this is not correct as the model
is able to predict the price between 217.46 and 266.59.
Answer 1. J. Prediction of the price of Vancouver house
The prediction of the price of Vancouver houses is not possible with the help of these
equation as the data from which the equation is derived is not collected from Vancouver.
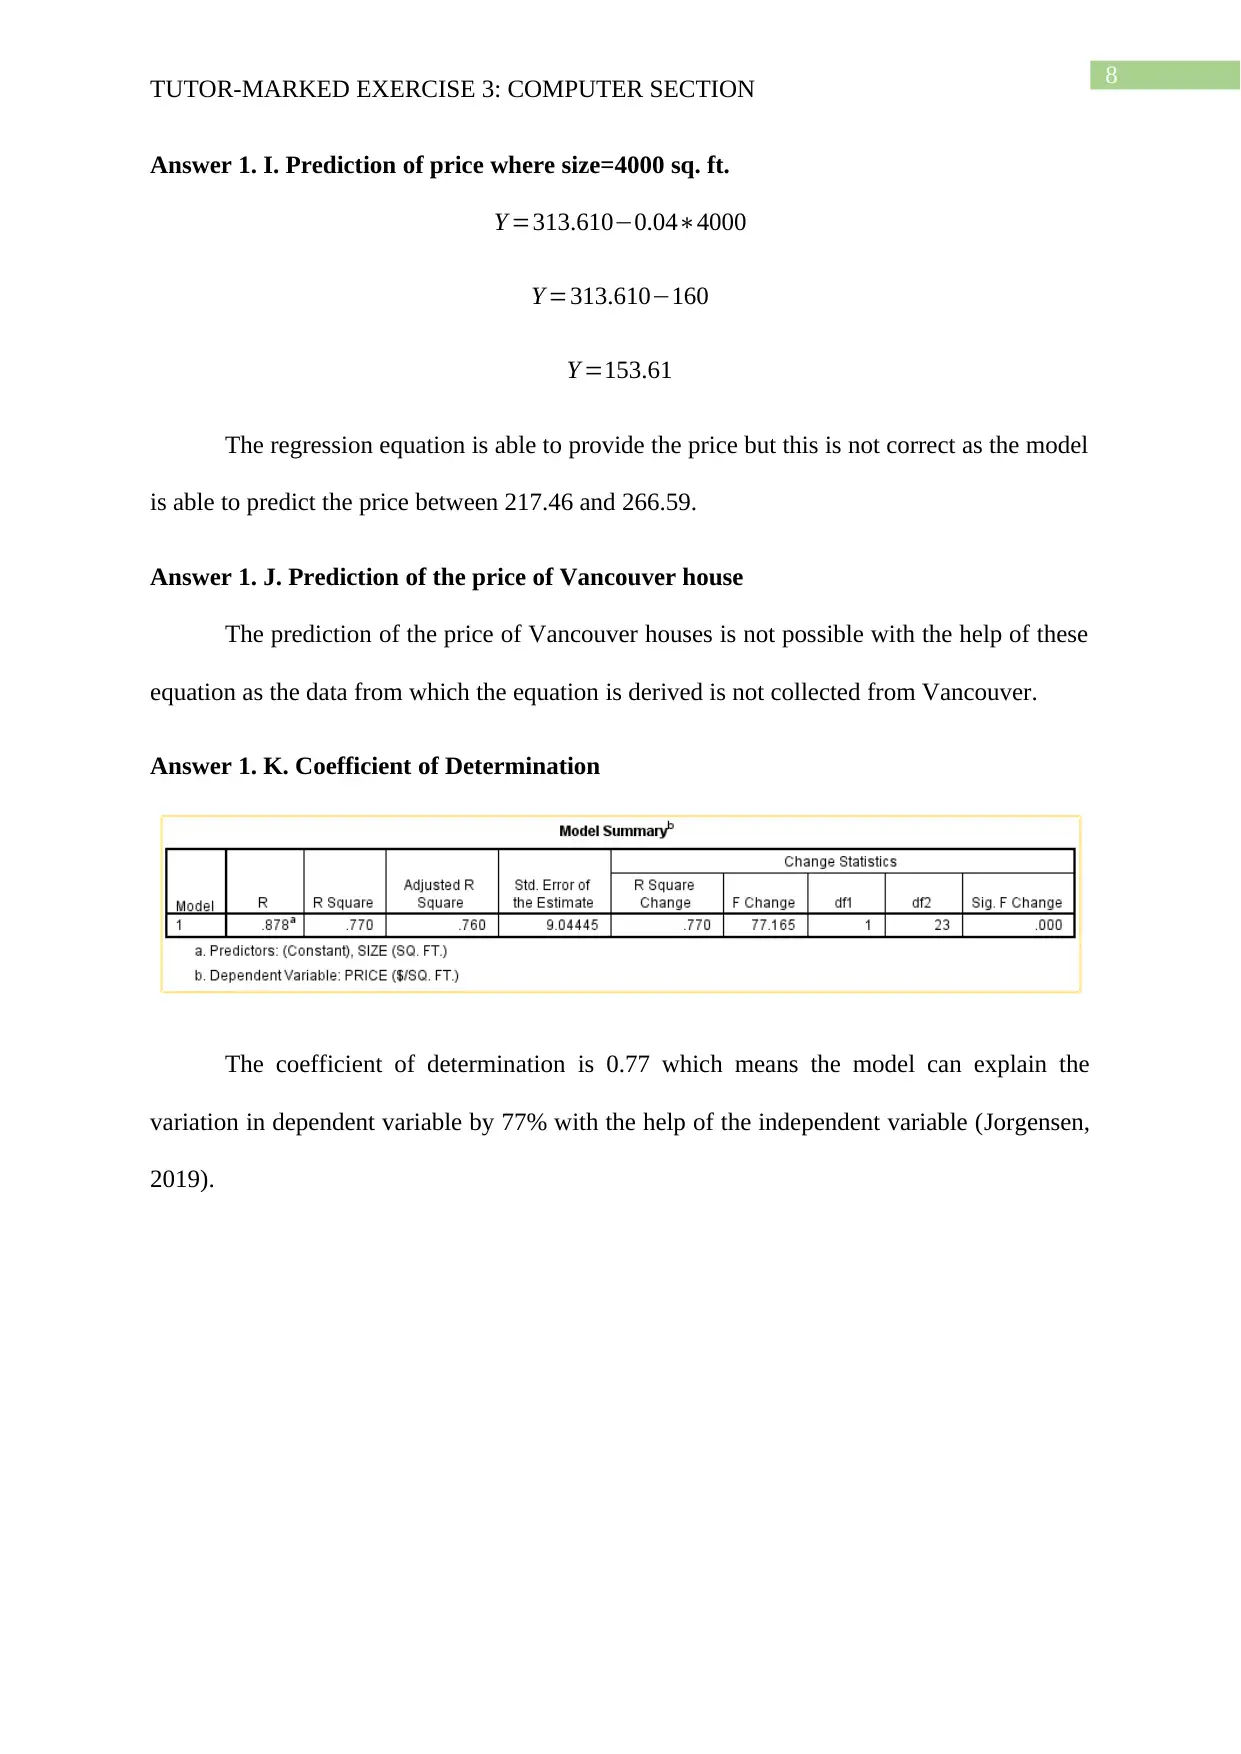
Answer 1. K. Coefficient of Determination
The coefficient of determination is 0.77 which means the model can explain the
variation in dependent variable by 77% with the help of the independent variable (Jorgensen,
2019).
TUTOR-MARKED EXERCISE 3: COMPUTER SECTION
Answer 1. I. Prediction of price where size=4000 sq. ft.
Y =313.610−0.04∗4000
Y =313.610−160
Y =153.61
The regression equation is able to provide the price but this is not correct as the model
is able to predict the price between 217.46 and 266.59.
Answer 1. J. Prediction of the price of Vancouver house
The prediction of the price of Vancouver houses is not possible with the help of these
equation as the data from which the equation is derived is not collected from Vancouver.
Answer 1. K. Coefficient of Determination
The coefficient of determination is 0.77 which means the model can explain the
variation in dependent variable by 77% with the help of the independent variable (Jorgensen,
2019).
9
TUTOR-MARKED EXERCISE 3: COMPUTER SECTION
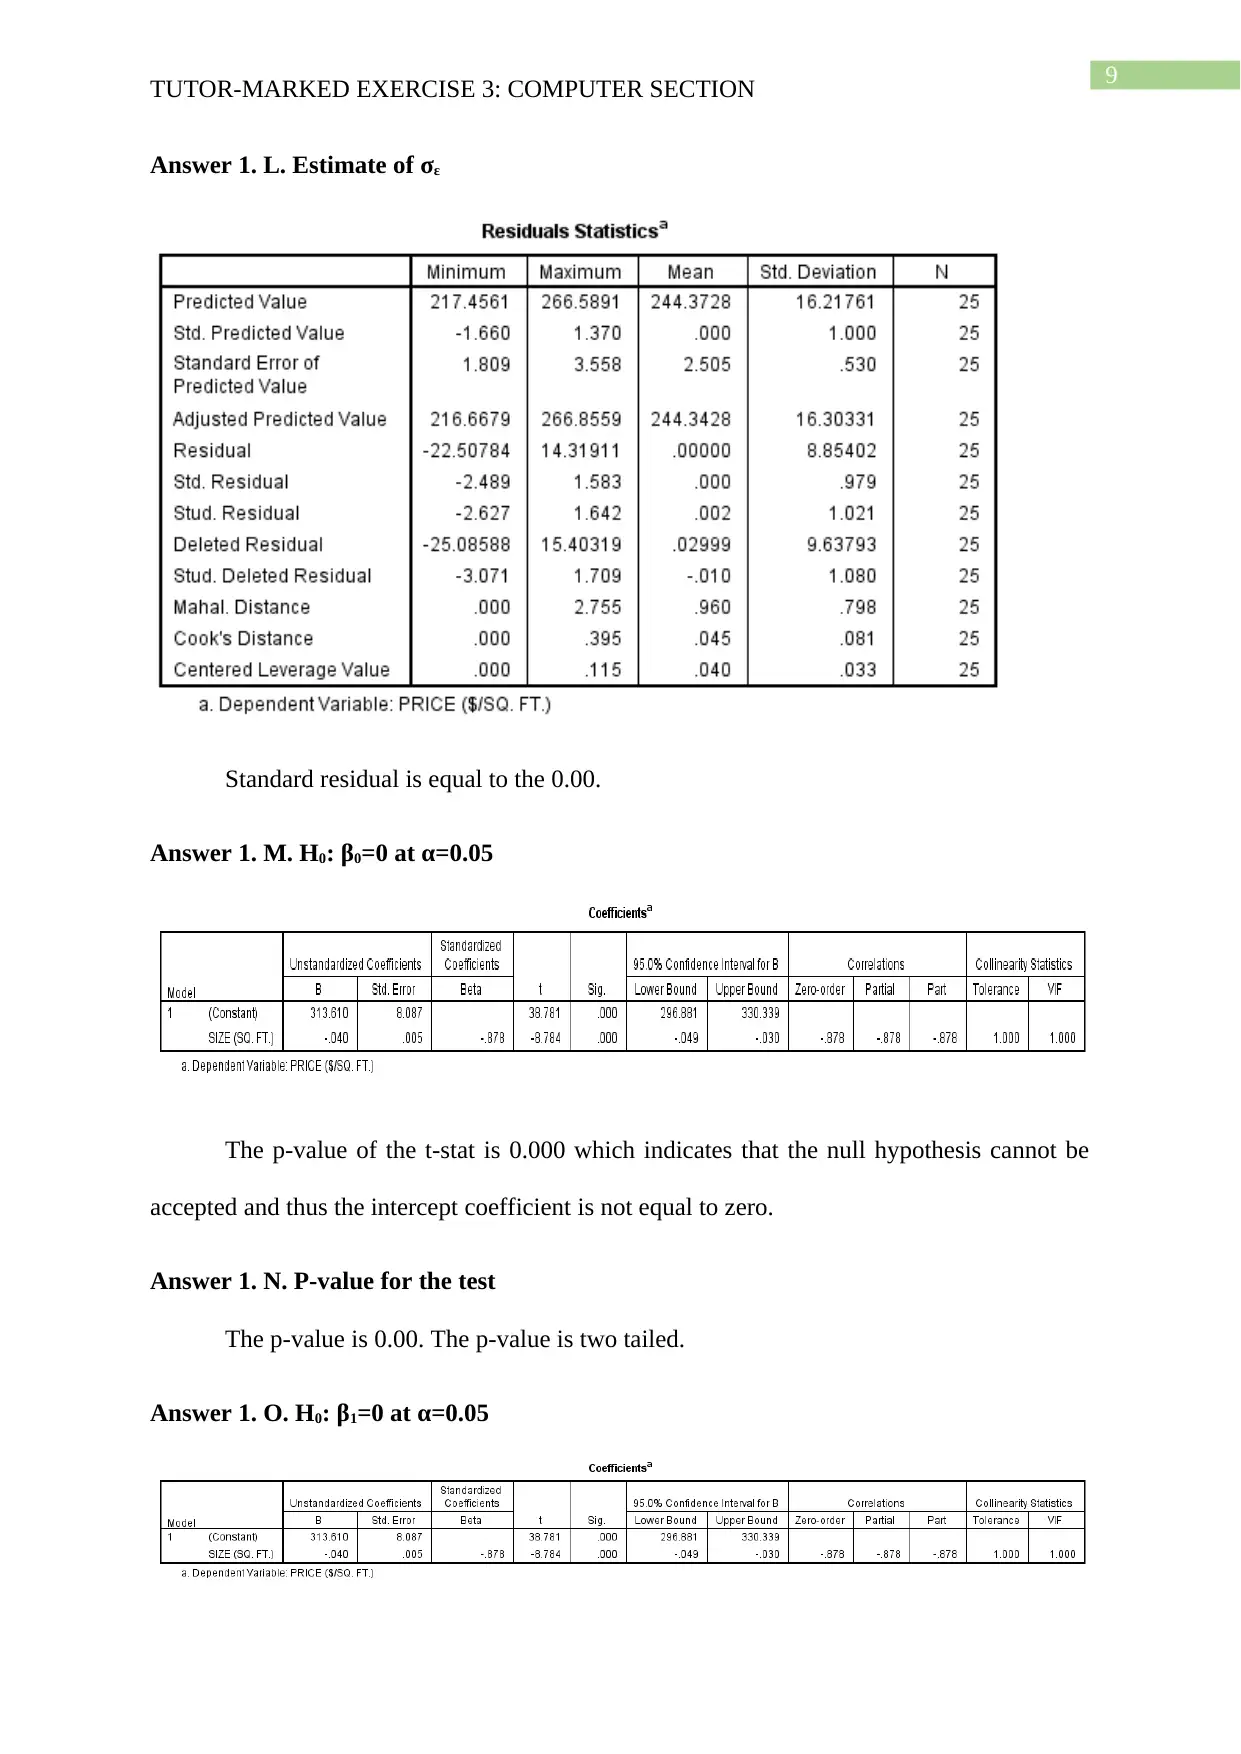
Answer 1. L. Estimate of σε
Standard residual is equal to the 0.00.
Answer 1. M. H0: β0=0 at α=0.05
The p-value of the t-stat is 0.000 which indicates that the null hypothesis cannot be
accepted and thus the intercept coefficient is not equal to zero.
Answer 1. N. P-value for the test
The p-value is 0.00. The p-value is two tailed.
Answer 1. O. H0: β1=0 at α=0.05
TUTOR-MARKED EXERCISE 3: COMPUTER SECTION
Answer 1. L. Estimate of σε
Standard residual is equal to the 0.00.
Answer 1. M. H0: β0=0 at α=0.05
The p-value of the t-stat is 0.000 which indicates that the null hypothesis cannot be
accepted and thus the intercept coefficient is not equal to zero.
Answer 1. N. P-value for the test
The p-value is 0.00. The p-value is two tailed.
Answer 1. O. H0: β1=0 at α=0.05
Secure Best Marks with AI Grader
Need help grading? Try our AI Grader for instant feedback on your assignments.
10
TUTOR-MARKED EXERCISE 3: COMPUTER SECTION
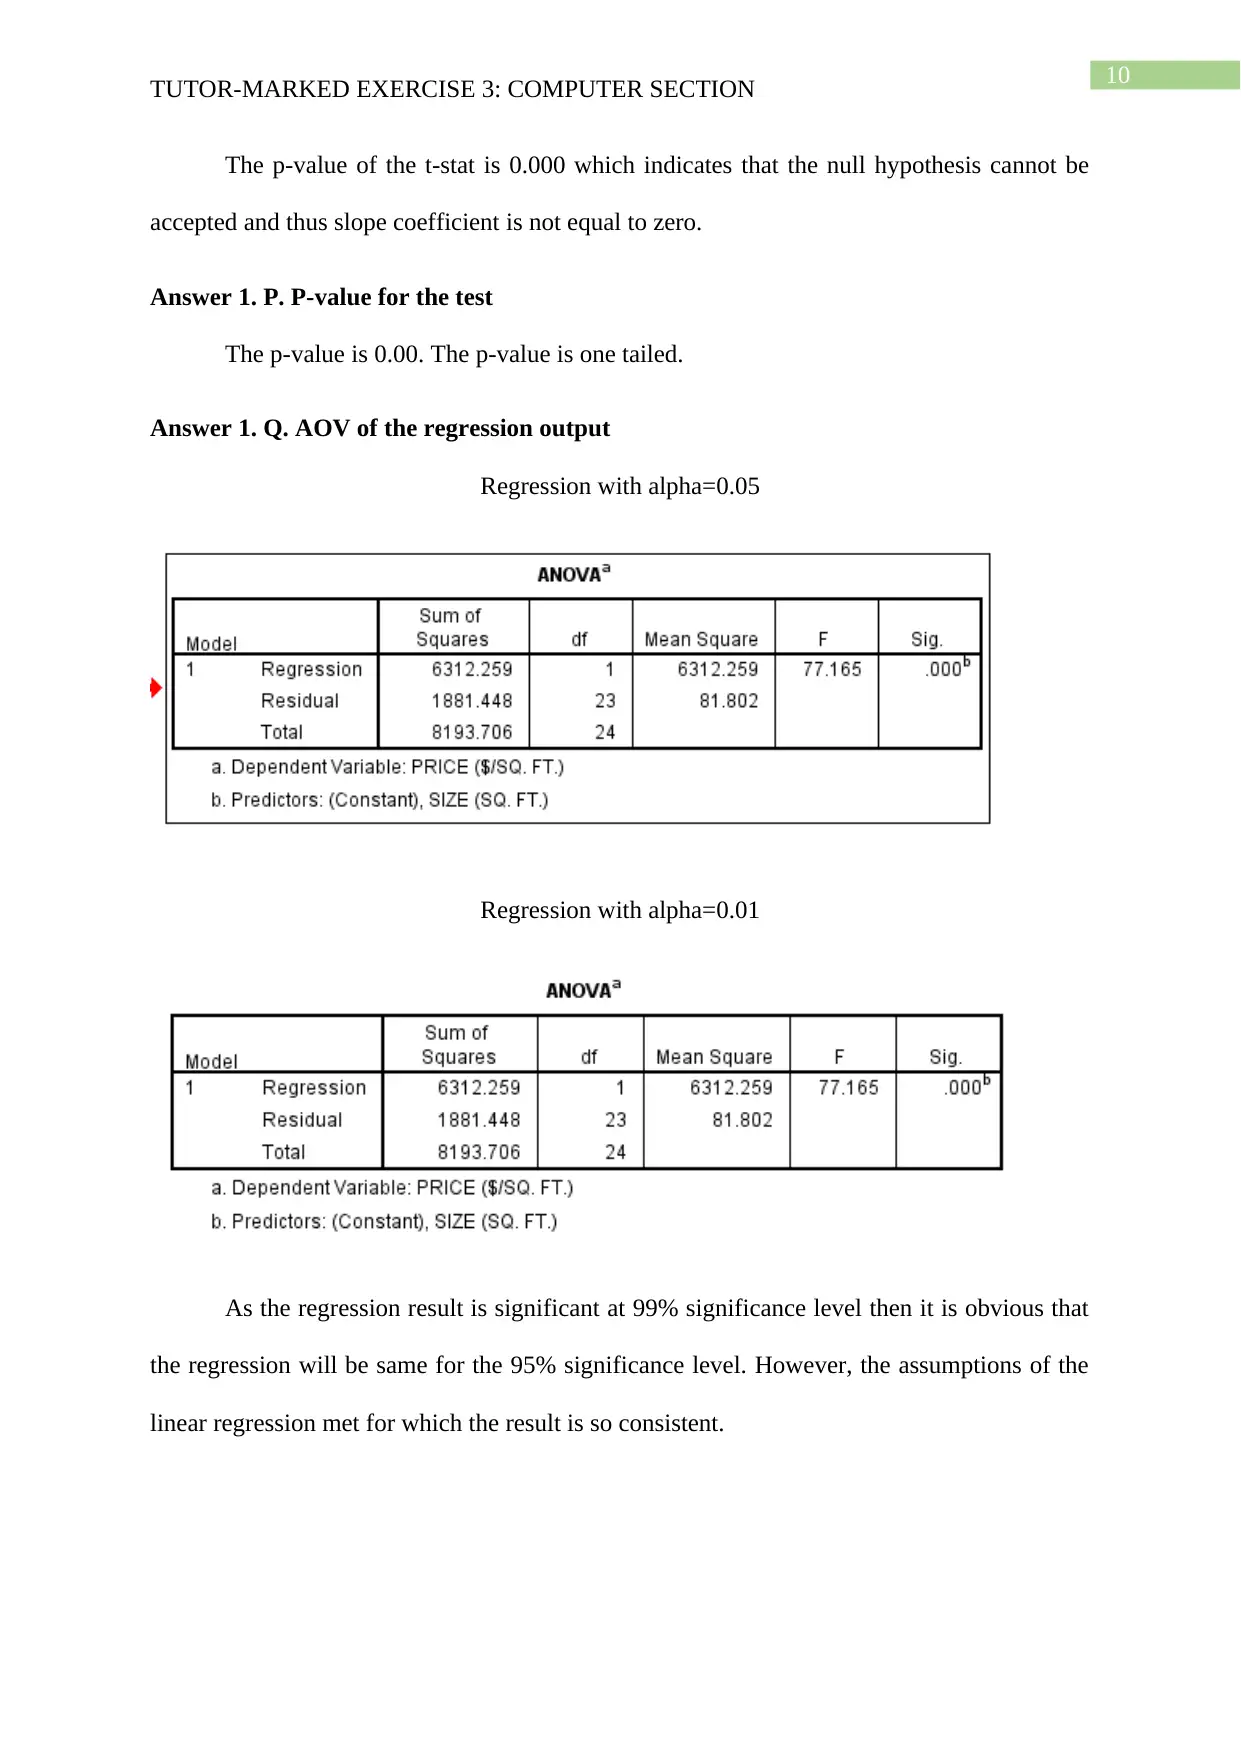
The p-value of the t-stat is 0.000 which indicates that the null hypothesis cannot be
accepted and thus slope coefficient is not equal to zero.
Answer 1. P. P-value for the test
The p-value is 0.00. The p-value is one tailed.
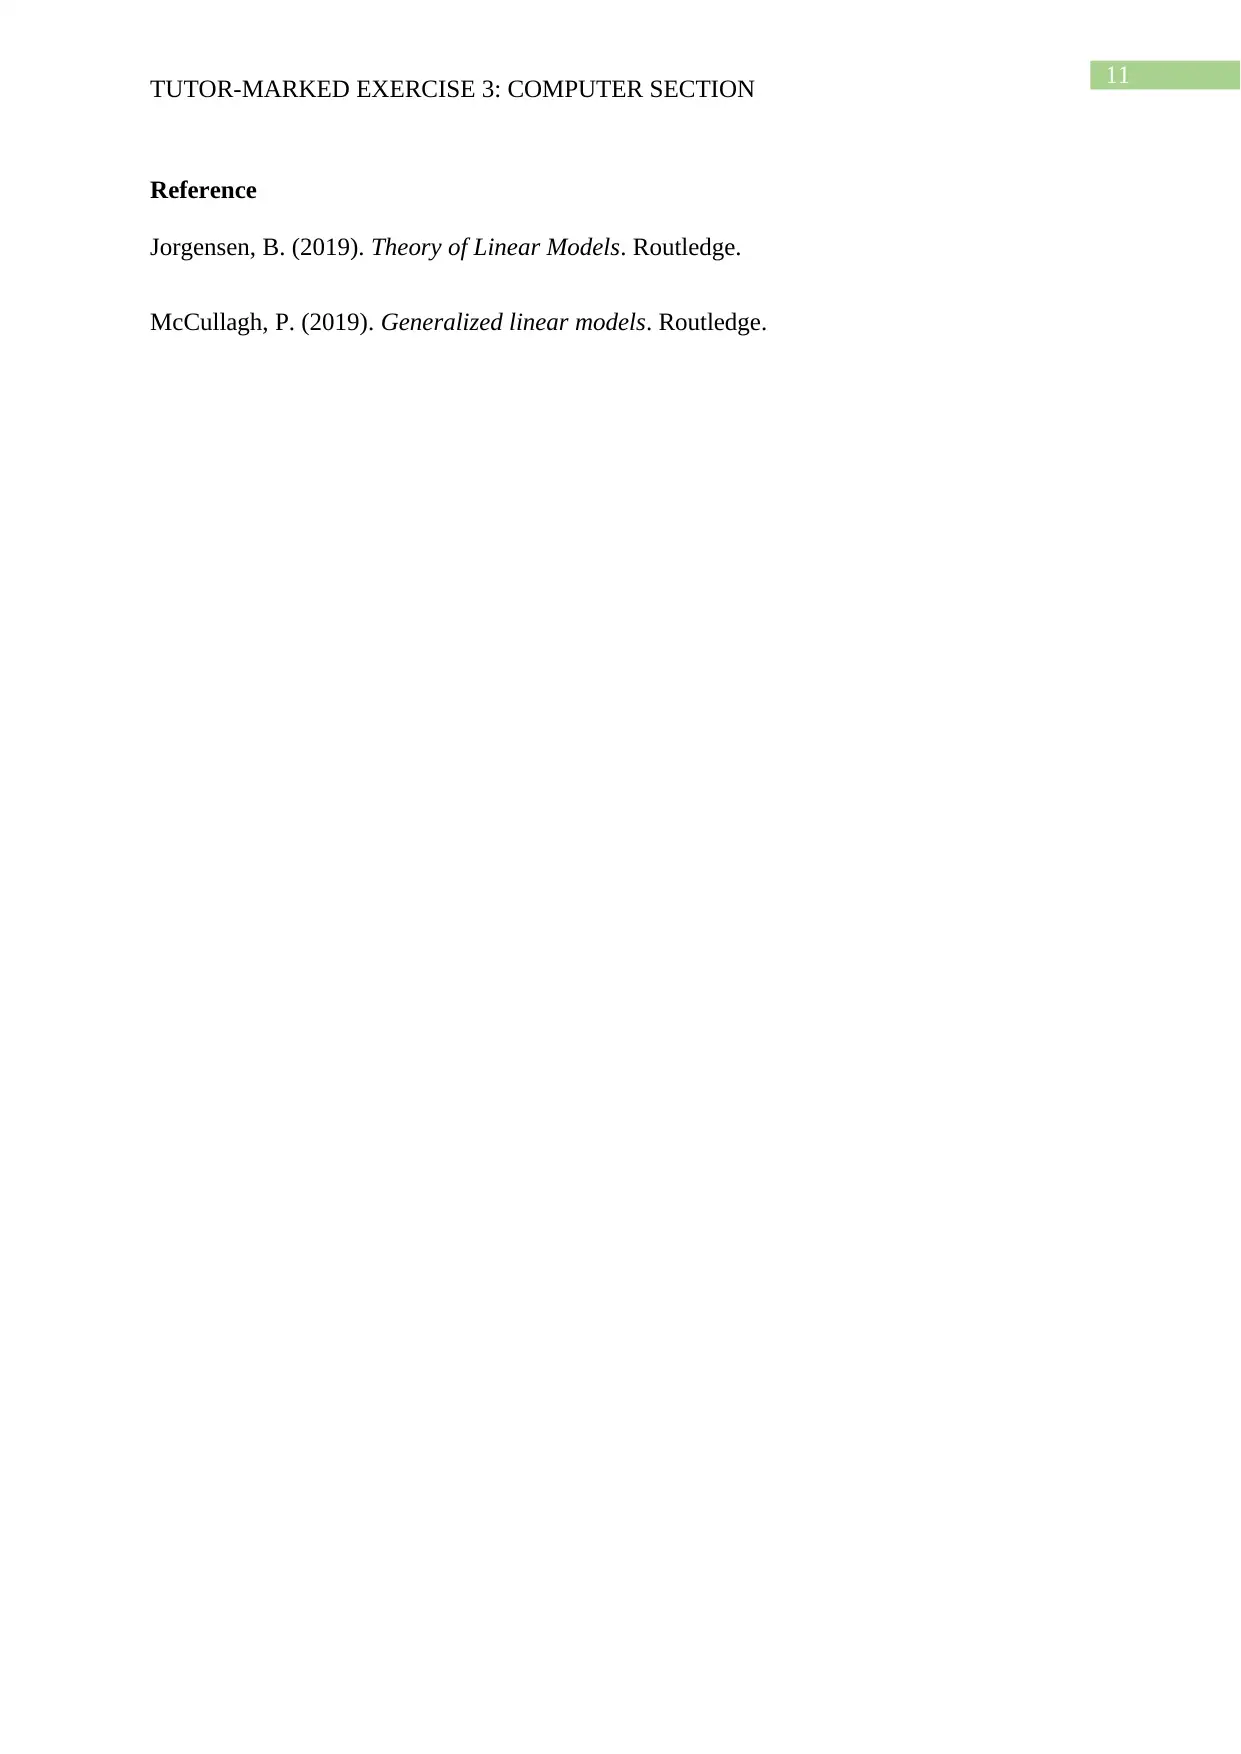
Answer 1. Q. AOV of the regression output
Regression with alpha=0.05
Regression with alpha=0.01
As the regression result is significant at 99% significance level then it is obvious that
the regression will be same for the 95% significance level. However, the assumptions of the
linear regression met for which the result is so consistent.
TUTOR-MARKED EXERCISE 3: COMPUTER SECTION
The p-value of the t-stat is 0.000 which indicates that the null hypothesis cannot be
accepted and thus slope coefficient is not equal to zero.
Answer 1. P. P-value for the test
The p-value is 0.00. The p-value is one tailed.
Answer 1. Q. AOV of the regression output
Regression with alpha=0.05
Regression with alpha=0.01
As the regression result is significant at 99% significance level then it is obvious that
the regression will be same for the 95% significance level. However, the assumptions of the
linear regression met for which the result is so consistent.
11
TUTOR-MARKED EXERCISE 3: COMPUTER SECTION
Reference
Jorgensen, B. (2019). Theory of Linear Models. Routledge.
McCullagh, P. (2019). Generalized linear models. Routledge.
TUTOR-MARKED EXERCISE 3: COMPUTER SECTION
Reference
Jorgensen, B. (2019). Theory of Linear Models. Routledge.
McCullagh, P. (2019). Generalized linear models. Routledge.

12
TUTOR-MARKED EXERCISE 3: COMPUTER SECTION
Appendices
Appendix 1
TUTOR-MARKED EXERCISE 3: COMPUTER SECTION
Appendices
Appendix 1
Paraphrase This Document
Need a fresh take? Get an instant paraphrase of this document with our AI Paraphraser
13
TUTOR-MARKED EXERCISE 3: COMPUTER SECTION
Appendix 2
TUTOR-MARKED EXERCISE 3: COMPUTER SECTION
Appendix 2
14
TUTOR-MARKED EXERCISE 3: COMPUTER SECTION
Appendix 3
TUTOR-MARKED EXERCISE 3: COMPUTER SECTION
Appendix 3
15
TUTOR-MARKED EXERCISE 3: COMPUTER SECTION
TUTOR-MARKED EXERCISE 3: COMPUTER SECTION
Secure Best Marks with AI Grader
Need help grading? Try our AI Grader for instant feedback on your assignments.
16
TUTOR-MARKED EXERCISE 3: COMPUTER SECTION
TUTOR-MARKED EXERCISE 3: COMPUTER SECTION
17
TUTOR-MARKED EXERCISE 3: COMPUTER SECTION
TUTOR-MARKED EXERCISE 3: COMPUTER SECTION

18
TUTOR-MARKED EXERCISE 3: COMPUTER SECTION
TUTOR-MARKED EXERCISE 3: COMPUTER SECTION
Paraphrase This Document
Need a fresh take? Get an instant paraphrase of this document with our AI Paraphraser
19
TUTOR-MARKED EXERCISE 3: COMPUTER SECTION
Appendix 4
TUTOR-MARKED EXERCISE 3: COMPUTER SECTION
Appendix 4
20
TUTOR-MARKED EXERCISE 3: COMPUTER SECTION
TUTOR-MARKED EXERCISE 3: COMPUTER SECTION
21
TUTOR-MARKED EXERCISE 3: COMPUTER SECTION
TUTOR-MARKED EXERCISE 3: COMPUTER SECTION
Secure Best Marks with AI Grader
Need help grading? Try our AI Grader for instant feedback on your assignments.
22
TUTOR-MARKED EXERCISE 3: COMPUTER SECTION
TUTOR-MARKED EXERCISE 3: COMPUTER SECTION
23
TUTOR-MARKED EXERCISE 3: COMPUTER SECTION
TUTOR-MARKED EXERCISE 3: COMPUTER SECTION

24
TUTOR-MARKED EXERCISE 3: COMPUTER SECTION
TUTOR-MARKED EXERCISE 3: COMPUTER SECTION
Paraphrase This Document
Need a fresh take? Get an instant paraphrase of this document with our AI Paraphraser

25
TUTOR-MARKED EXERCISE 3: COMPUTER SECTION
TUTOR-MARKED EXERCISE 3: COMPUTER SECTION
1 out of 26
Related Documents


Your All-in-One AI-Powered Toolkit for Academic Success.
+13062052269
info@desklib.com
Available 24*7 on WhatsApp / Email
![[object Object]](/_next/static/media/star-bottom.7253800d.svg)
Unlock your academic potential
© 2024 | Zucol Services PVT LTD | All rights reserved.