logo

Tutor-marked Exercise 3: Computer Section

Tutor-marked Exercise consisting of two sections: a theory section and a computer section, with grades allocated to each section. Submission requirements and instructions provided.

26 Pages783 Words426 Views
   

Added on  2022-12-09

About This Document

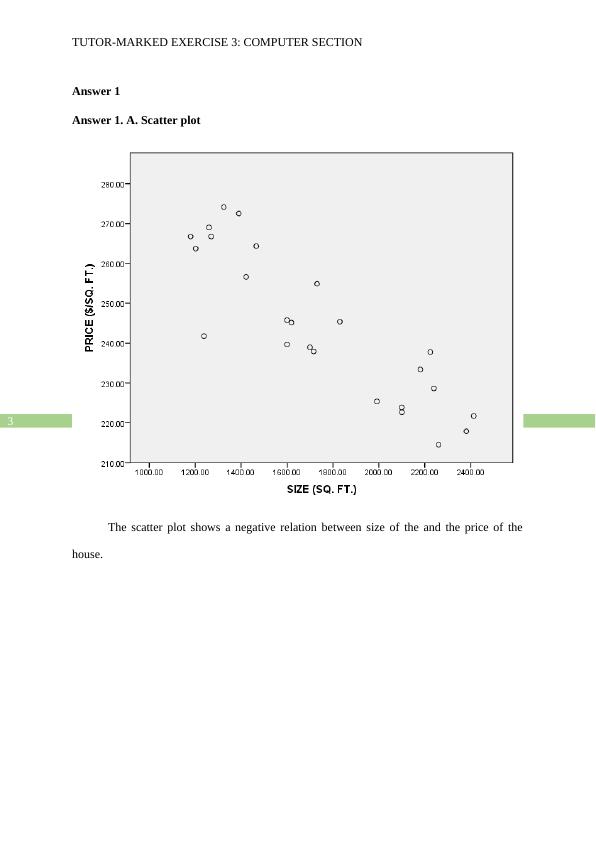
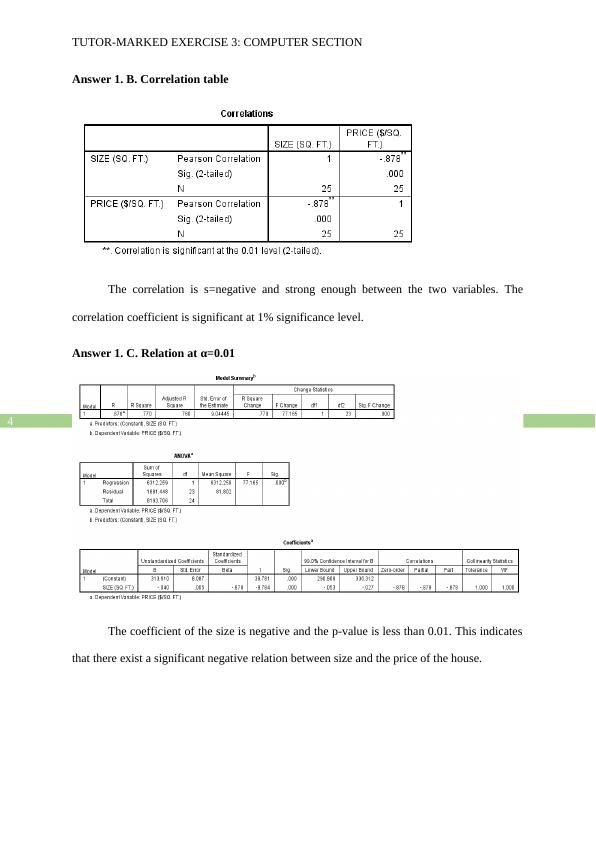
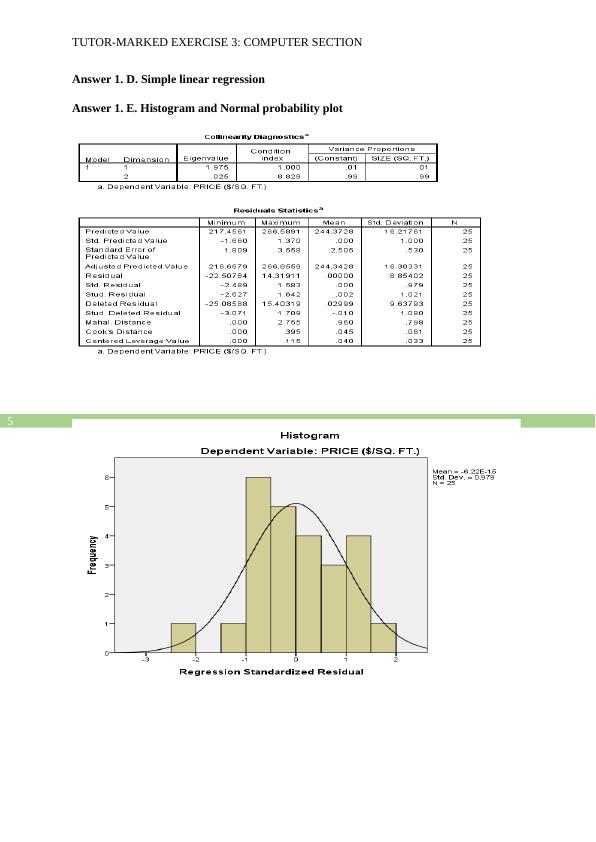
This document is a tutor-marked exercise for the computer section. It includes answers to various questions related to scatter plots, correlation tables, regression equations, and more.

Tutor-marked Exercise 3: Computer Section

Tutor-marked Exercise consisting of two sections: a theory section and a computer section, with grades allocated to each section. Submission requirements and instructions provided.

   Added on 2022-12-09

ShareRelated Documents
Running head: TUTOR-MARKED EXERCISE 3: COMPUTER SECTION
Tutor-marked Exercise 3: Computer Section
Name of the Student:
Name of the University:
Author Note:
Tutor-marked Exercise 3: Computer Section_1
1
TUTOR-MARKED EXERCISE 3: COMPUTER SECTION
Table of Contents
Answer 1....................................................................................................................................3
Answer 1. A. Scatter plot.......................................................................................................3
Answer 1. B. Correlation table...............................................................................................3
Answer 1. C. Relation at α=0.01............................................................................................4
Answer 1. D. Simple linear regression...................................................................................4
Answer 1. E. Histogram and Normal probability plot...........................................................4
Answer 1. F. Fitness of linear regression...............................................................................6
Answer 1. G. Regression equation.........................................................................................6
Answer 1. H. Prediction of price where size=1200 sq. ft......................................................6
Answer 1. I. Prediction of price where size=4000 sq. ft........................................................7
Answer 1. J. Prediction of the price of Vancouver house......................................................7
Answer 1. K. Coefficient of Determination...........................................................................7
Answer 1. L. Estimate of σε...................................................................................................8
Answer 1. M. H0: β0=0 at α=0.05...........................................................................................8
Answer 1. N. P-value for the test...........................................................................................8
Answer 1. O. H0: β1=0 at α=0.05............................................................................................8
Answer 1. P. P-value for the test............................................................................................9
Answer 1. Q. AOV of the regression output..........................................................................9
Reference..................................................................................................................................10
Appendices...............................................................................................................................11
Appendix 1...........................................................................................................................11
Tutor-marked Exercise 3: Computer Section_2
2
TUTOR-MARKED EXERCISE 3: COMPUTER SECTION
Appendix 2...........................................................................................................................12
Appendix 3...........................................................................................................................13
Appendix 4...........................................................................................................................18
Tutor-marked Exercise 3: Computer Section_3
3
TUTOR-MARKED EXERCISE 3: COMPUTER SECTION
Answer 1
Answer 1. A. Scatter plot
The scatter plot shows a negative relation between size of the and the price of the
house.
Tutor-marked Exercise 3: Computer Section_4
4
TUTOR-MARKED EXERCISE 3: COMPUTER SECTION
Answer 1. B. Correlation table
The correlation is s=negative and strong enough between the two variables. The
correlation coefficient is significant at 1% significance level.
Answer 1. C. Relation at α=0.01
The coefficient of the size is negative and the p-value is less than 0.01. This indicates
that there exist a significant negative relation between size and the price of the house.
Tutor-marked Exercise 3: Computer Section_5
5
TUTOR-MARKED EXERCISE 3: COMPUTER SECTION
Answer 1. D. Simple linear regression
Answer 1. E. Histogram and Normal probability plot
Tutor-marked Exercise 3: Computer Section_6

End of preview

Want to access all the pages? Upload your documents or become a member.

Related Documents
Tutor-marked Exercise 4: Computer Section
|33
|801
|100

Regression Analysis in Statistics
|11
|1898
|65

Linear Regression and Correlation Analysis Assignment
|13
|1372
|109

Analysis of R&D Expenses and Assets in Firms
|17
|2546
|373

(PDF) Essentials of Business Research Methods
|6
|1035
|164

Problems in Statistics- Correlation and Regression
|10
|944
|25