Compare and Contrast Chart Types for Data Visualization
7 Pages953 Words362 Views
Added on 2022-10-19
About This Document
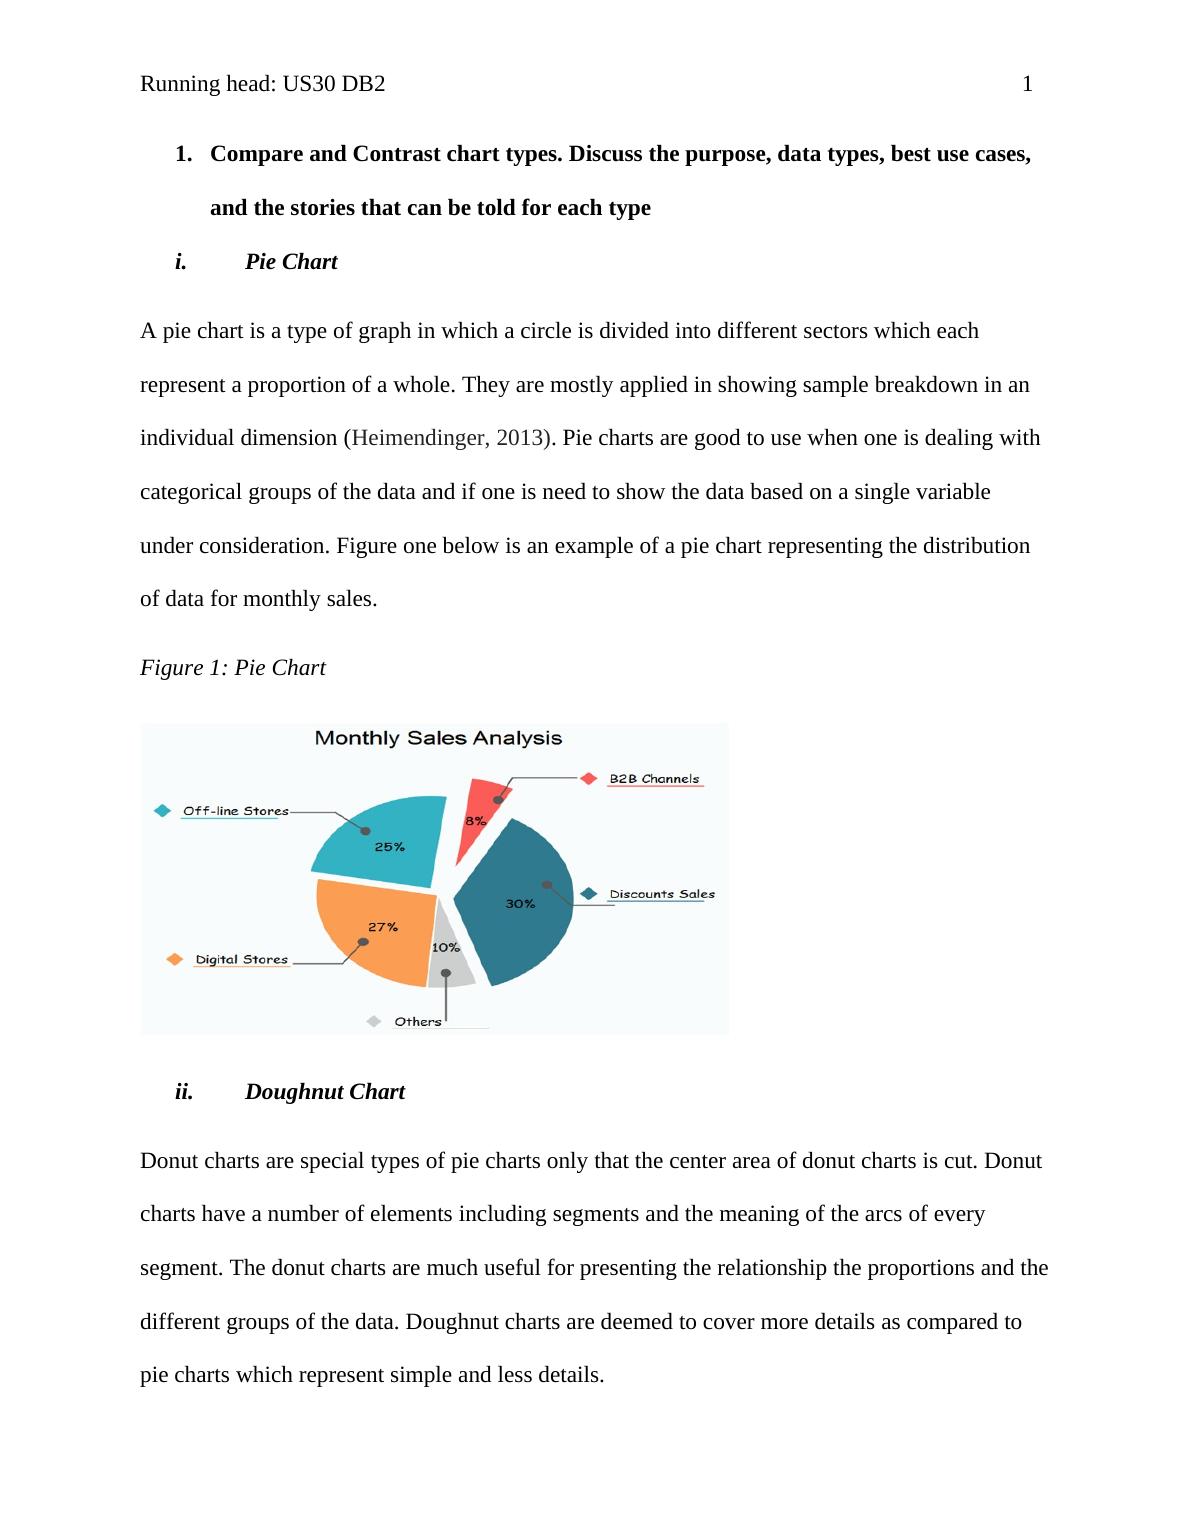
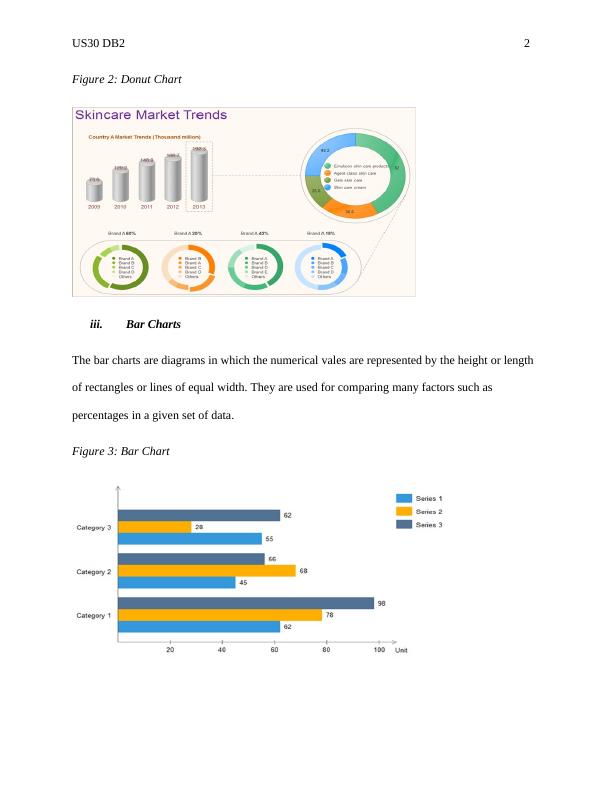
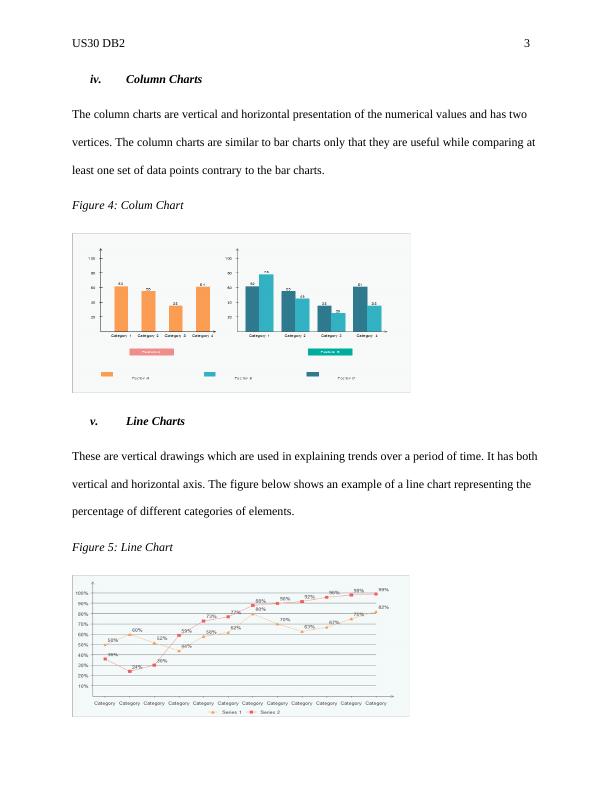
This article discusses different chart types for data visualization including pie charts, donut charts, bar charts, column charts, line charts, area charts, and scatter charts. It also explores the best use cases and stories that can be told for each type. Additionally, the article covers the four basic options for visualizing a single number and when it is acceptable to use a donut chart. References are also provided.
Compare and Contrast Chart Types for Data Visualization
Added on 2022-10-19
ShareRelated Documents
End of preview
Want to access all the pages? Upload your documents or become a member.
Analyzing the Visual Presentation of Westpac Banking Corporation
|18
|2553
|190
BTM 480 - Visual Representation of RBS
|20
|2175
|232
Foundation Skills in Data Analysis 2022
|12
|2024
|32
Statistics and Research Methods for Business Decision Making
|12
|1274
|210
MIS770A – Foundation Skills in Data Analysis
|18
|3089
|81
Applied Statistical Methods | Assignment
|7
|701
|14