Wireshark Analysis of Network Performance - BN208, MIT Australia
VerifiedAdded on 2023/06/11
|20
|2012
|348
Report
AI Summary
This report provides a detailed analysis of network packets captured using Wireshark from three different websites and an audio stream. The analysis includes examining load distribution, throughput graphs, time sequence graphs, flow graphs, and window scaling for each website to assess their performance. The report also covers an analysis of audio delivery, focusing on TCP radio capture and packet analysis. The conclusion summarizes the findings, noting the variations in performance across different websites due to differing packet flow rates, as observed through the various analytical methods employed. Desklib offers a wide range of study resources, including similar solved assignments and past papers, to support students' academic needs.

COURSE:
UNIT NAME:
UNIT CODE:
FACULTY:
DEPARTMENT:
NAME:
REGISTRATION_NUMBER:
1 | P a g e
UNIT NAME:
UNIT CODE:
FACULTY:
DEPARTMENT:
NAME:
REGISTRATION_NUMBER:
1 | P a g e
Paraphrase This Document
Need a fresh take? Get an instant paraphrase of this document with our AI Paraphraser
Table of Contents
Introduction.............................................................................................................................................3
Analysis of Web performance in wire shark............................................................................................3
1.Analysis for http://www.newspapers.com.au/.......................................................................................3
By load distribution.............................................................................................................................3
By use of throughput graph.................................................................................................................3
By use of flow graph...........................................................................................................................5
By use of window scaling....................................................................................................................5
2.cbsinteractive.com....................................................................................................................................6
By load distribution.............................................................................................................................6
By throughput graph............................................................................................................................7
By use of Time sequence.....................................................................................................................8
Use of flow graph................................................................................................................................8
Use of window scaling.........................................................................................................................9
3.Online newspapers..............................................................................................................................10
By load distribution..........................................................................................................................10
By throughput graph..........................................................................................................................11
By time sequence...............................................................................................................................12
By use of window scaling..................................................................................................................14
By use of flow graph.........................................................................................................................15
TASK 2.....................................................................................................................................................16
Audio delivery analysis.............................................................................................................................16
Conclusion.............................................................................................................................................19
References.................................................................................................................................................20
2 | P a g e
TASK 1
Introduction
This is a report on analyzation of network packets using Wireshark. It involves capturing of
packets of three different websites. The packets are then analyzed through four different ways
and their results analyzed accordingly and compared. The packets are analyzed by load
distribution, graph , time sequence, flow graph and window scaling. The last section contains
analyzation a video streaming packet for five minutes then the results are analyzed.
Analysis of Web performance in wire shark.
1.Analysis for http://www.newspapers.com.au/
By load distribution.
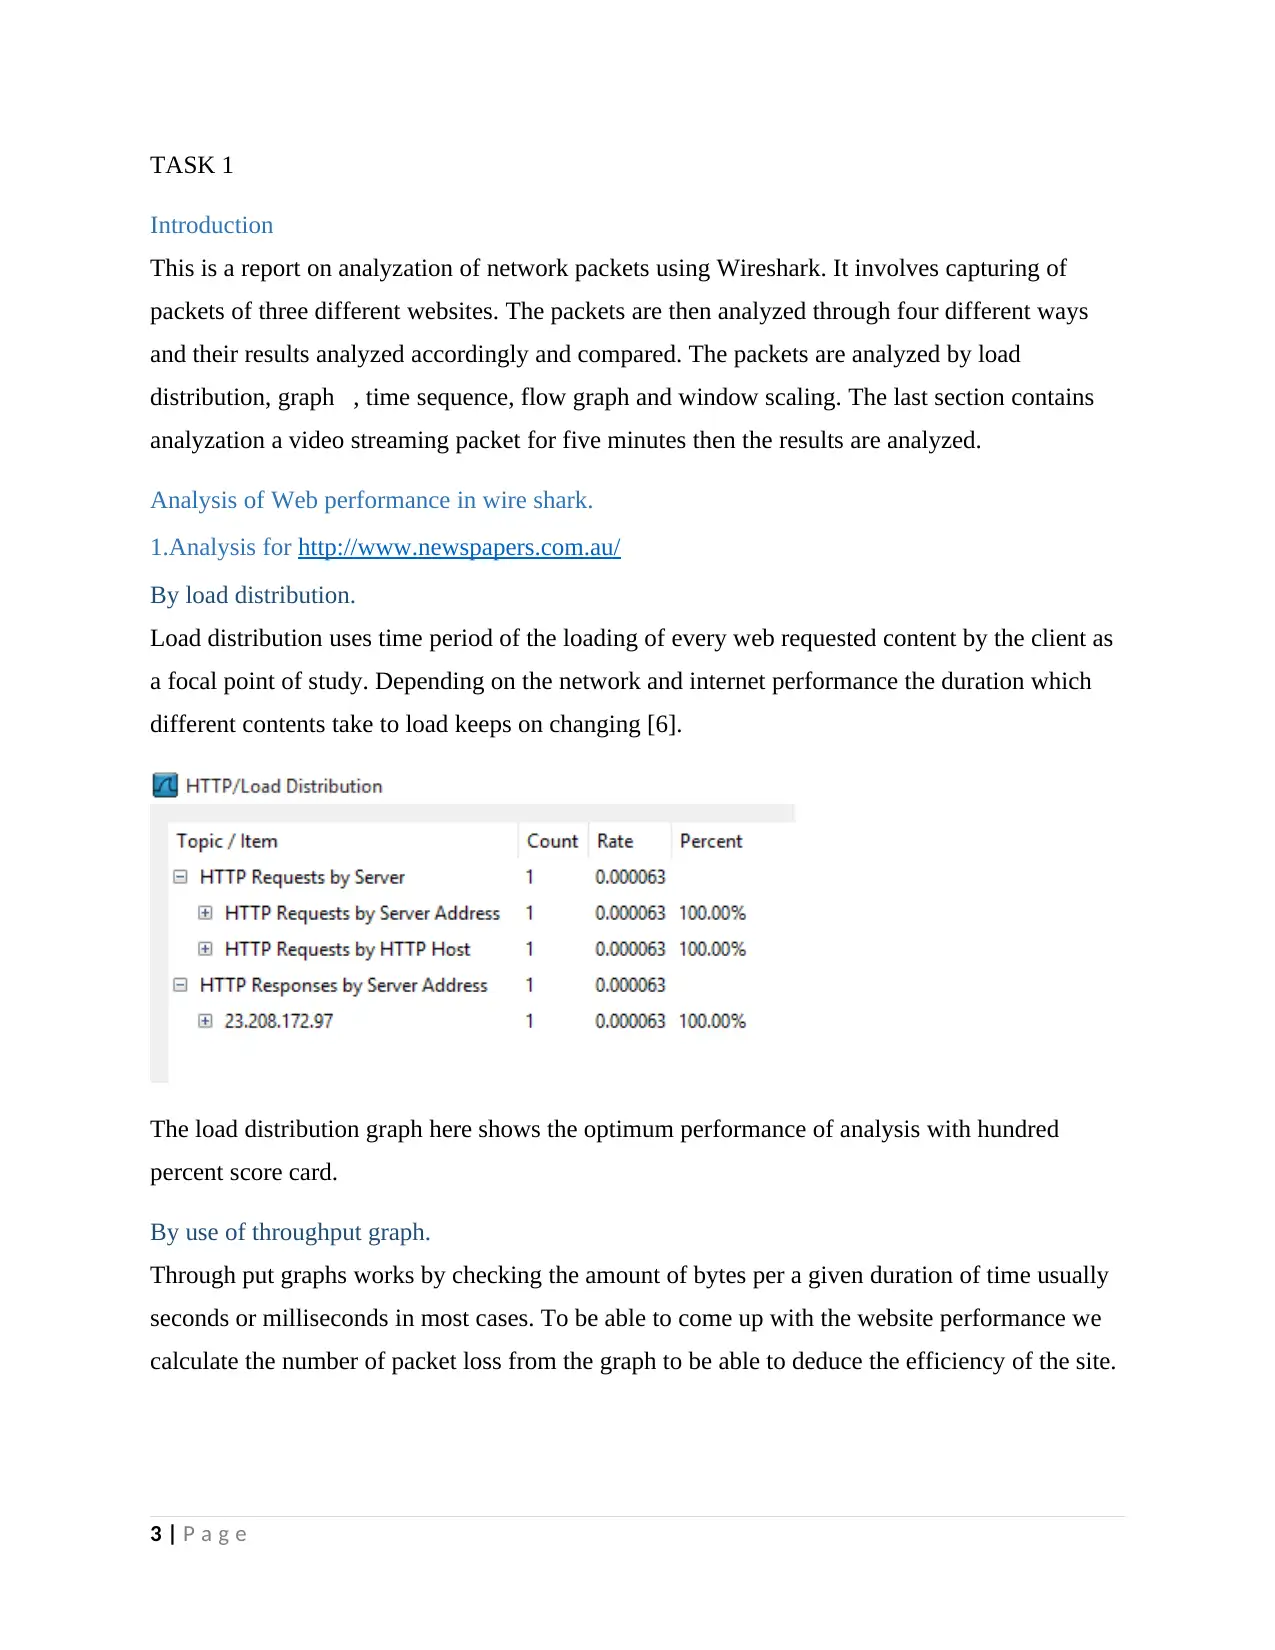
Load distribution uses time period of the loading of every web requested content by the client as
a focal point of study. Depending on the network and internet performance the duration which
different contents take to load keeps on changing [6].
The load distribution graph here shows the optimum performance of analysis with hundred
percent score card.
By use of throughput graph.
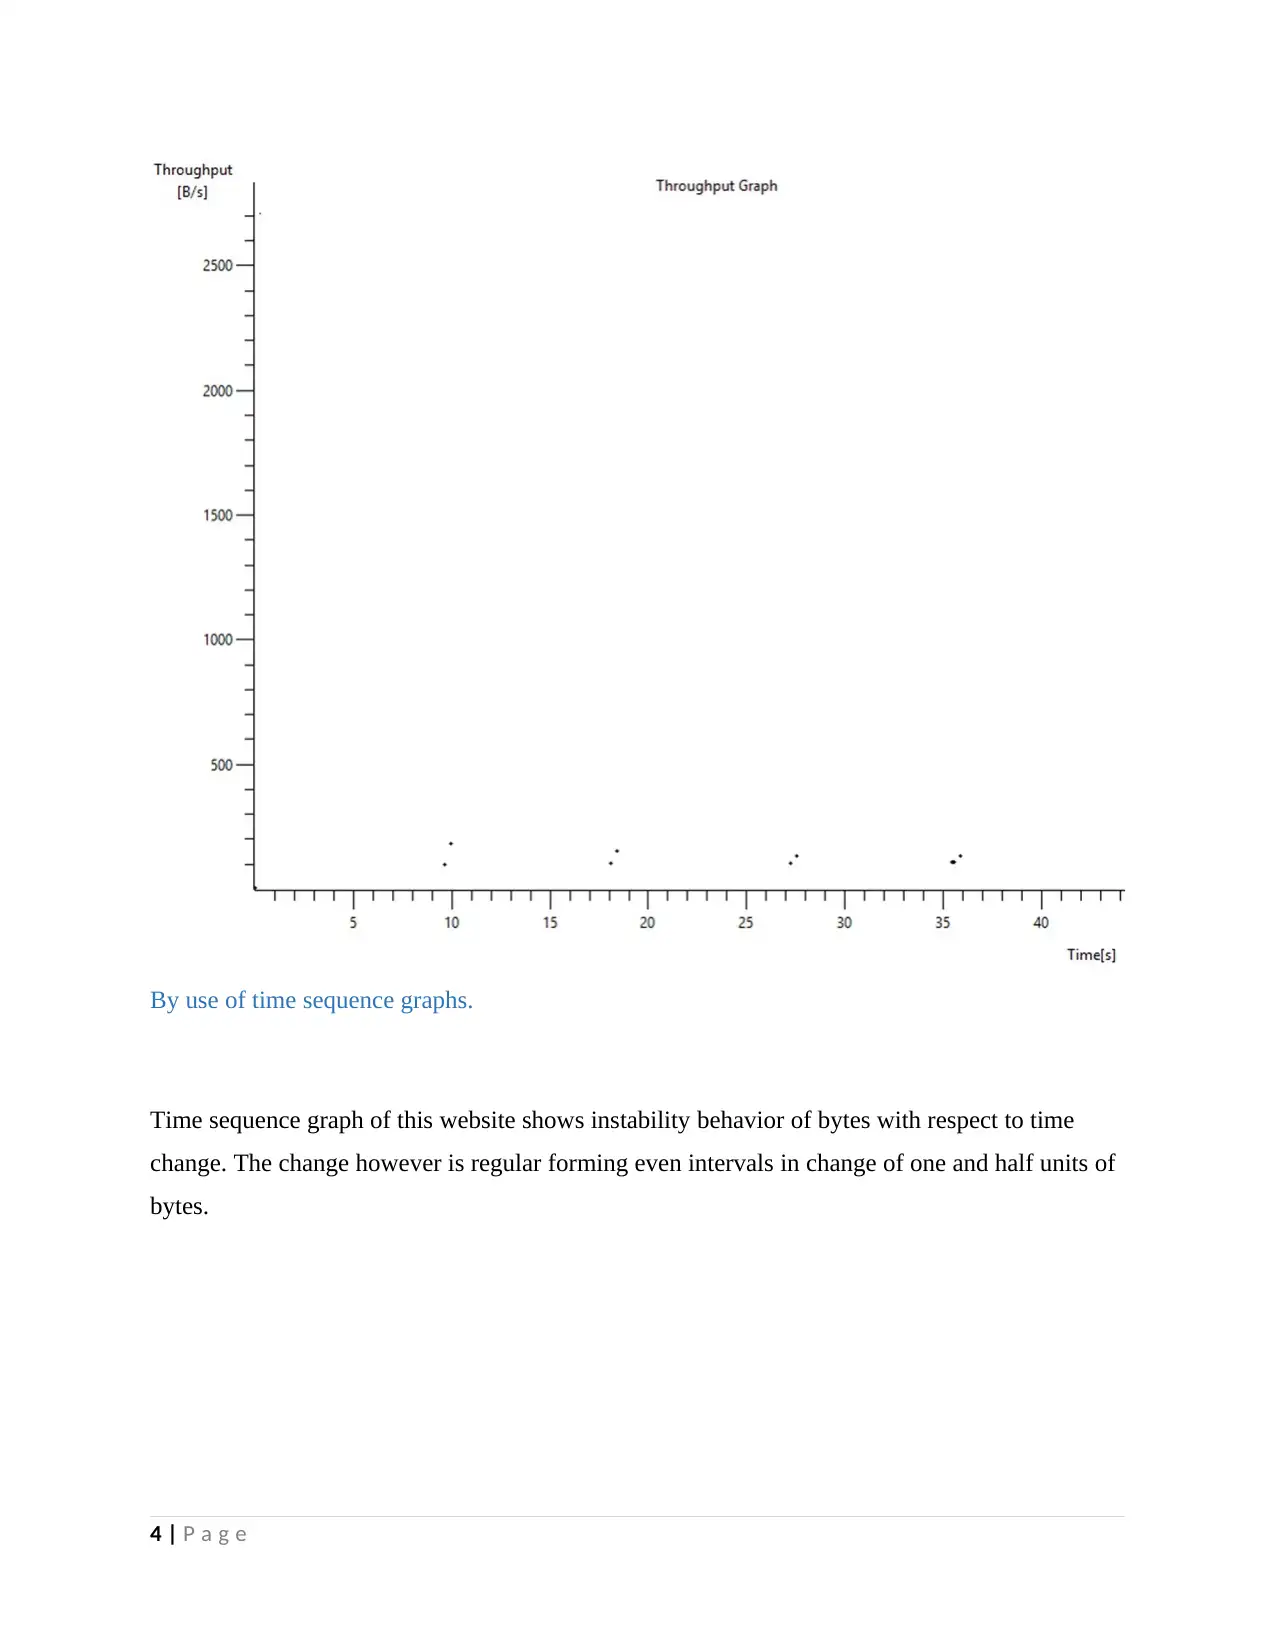
Through put graphs works by checking the amount of bytes per a given duration of time usually
seconds or milliseconds in most cases. To be able to come up with the website performance we
calculate the number of packet loss from the graph to be able to deduce the efficiency of the site.
3 | P a g e
⊘ This is a preview!⊘
Do you want full access?
Subscribe today to unlock all pages.

Trusted by 1+ million students worldwide
By use of time sequence graphs.
Time sequence graph of this website shows instability behavior of bytes with respect to time
change. The change however is regular forming even intervals in change of one and half units of
bytes.
4 | P a g e
Time sequence graph of this website shows instability behavior of bytes with respect to time
change. The change however is regular forming even intervals in change of one and half units of
bytes.
4 | P a g e
Paraphrase This Document
Need a fresh take? Get an instant paraphrase of this document with our AI Paraphraser
By use of flow graph.
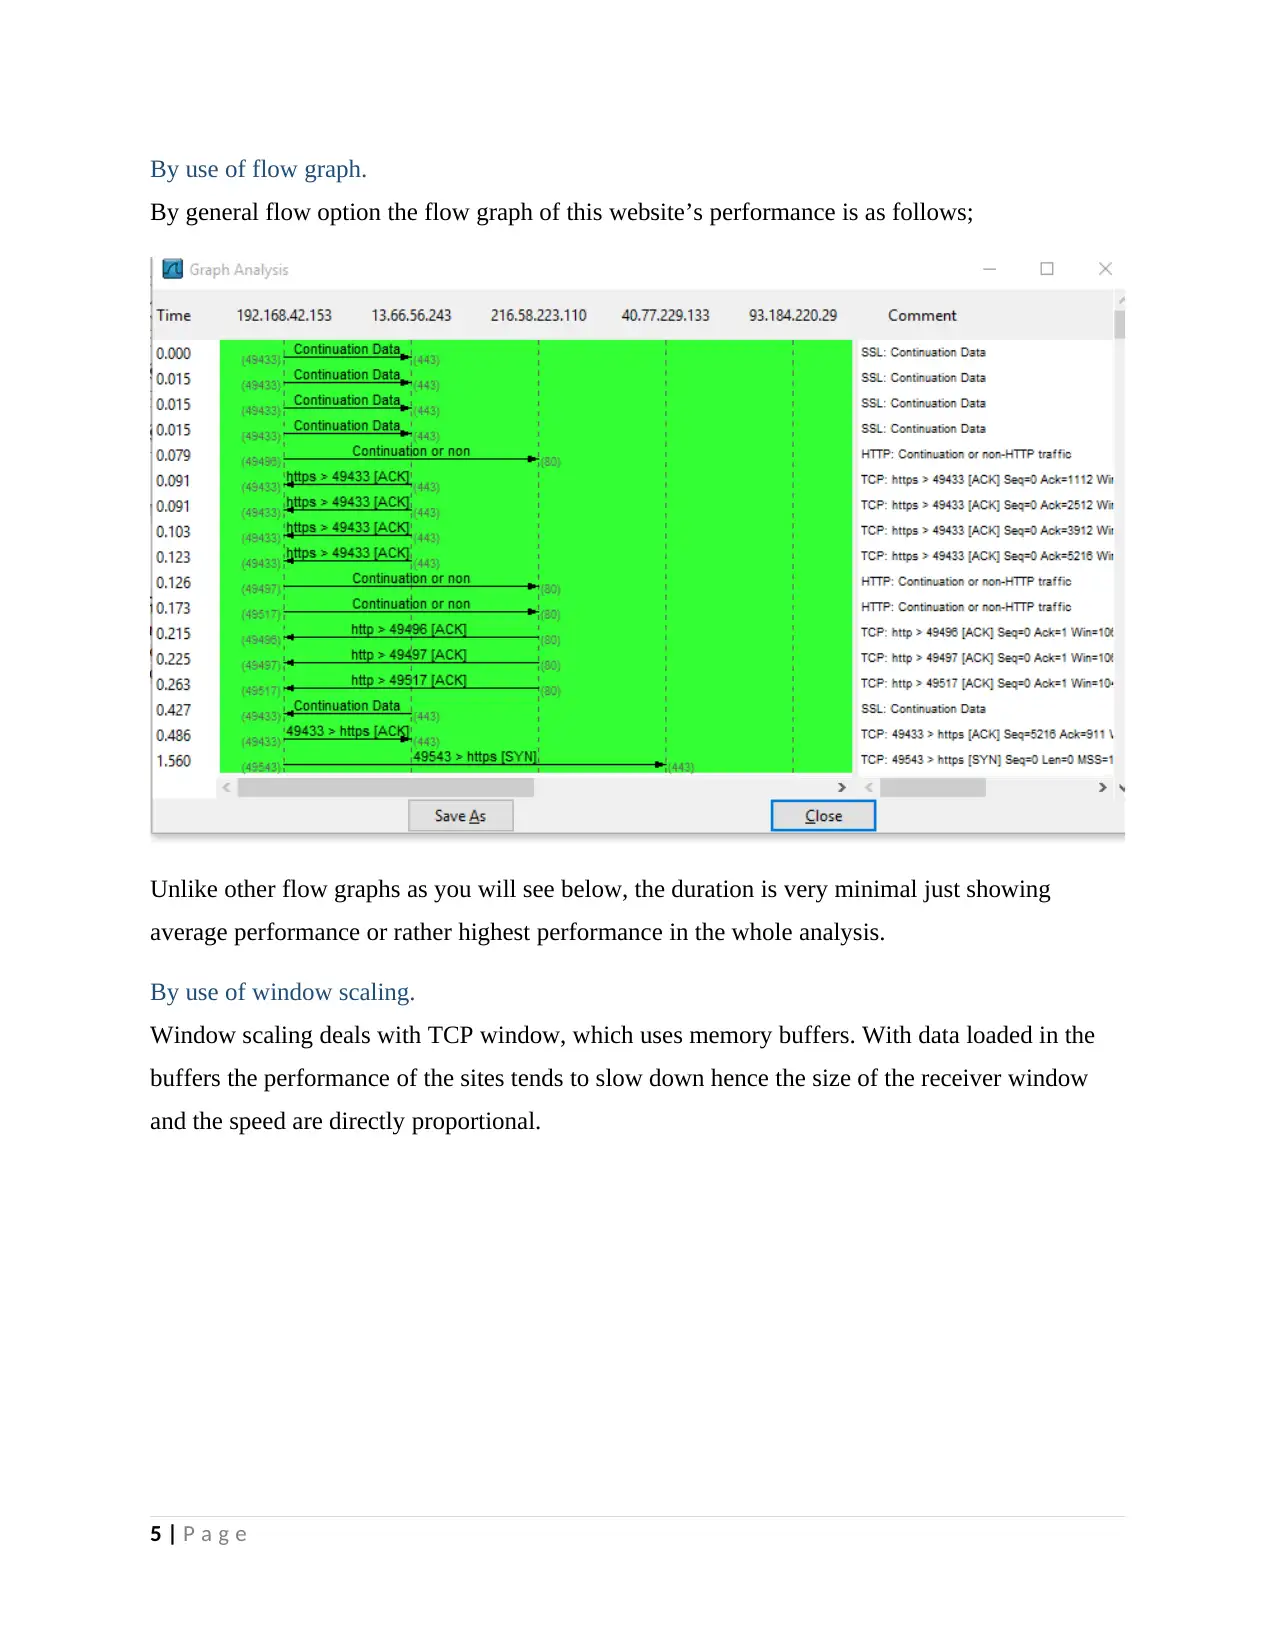
By general flow option the flow graph of this website’s performance is as follows;
Unlike other flow graphs as you will see below, the duration is very minimal just showing
average performance or rather highest performance in the whole analysis.
By use of window scaling.
Window scaling deals with TCP window, which uses memory buffers. With data loaded in the
buffers the performance of the sites tends to slow down hence the size of the receiver window
and the speed are directly proportional.
5 | P a g e
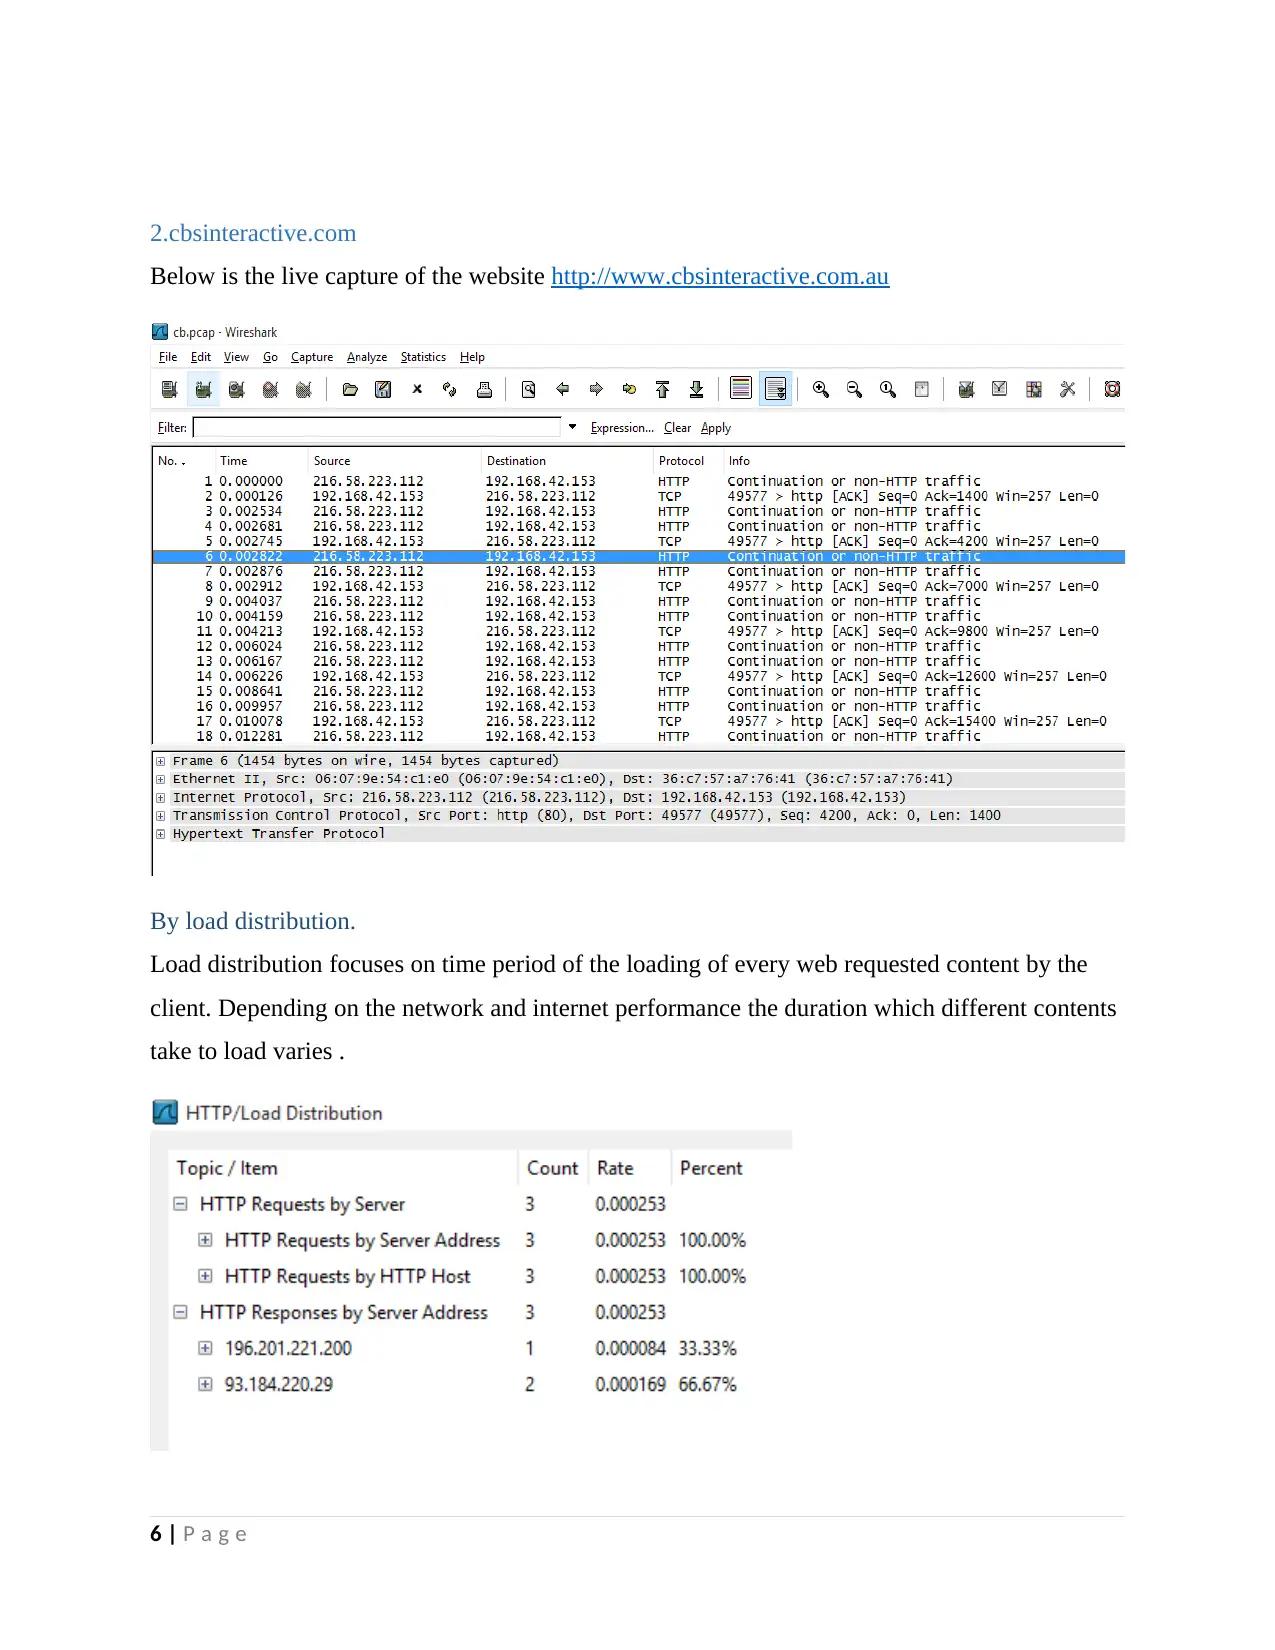
2.cbsinteractive.com
Below is the live capture of the website http://www.cbsinteractive.com.au
By load distribution.
Load distribution focuses on time period of the loading of every web requested content by the
client. Depending on the network and internet performance the duration which different contents
take to load varies .
6 | P a g e
⊘ This is a preview!⊘
Do you want full access?
Subscribe today to unlock all pages.

Trusted by 1+ million students worldwide
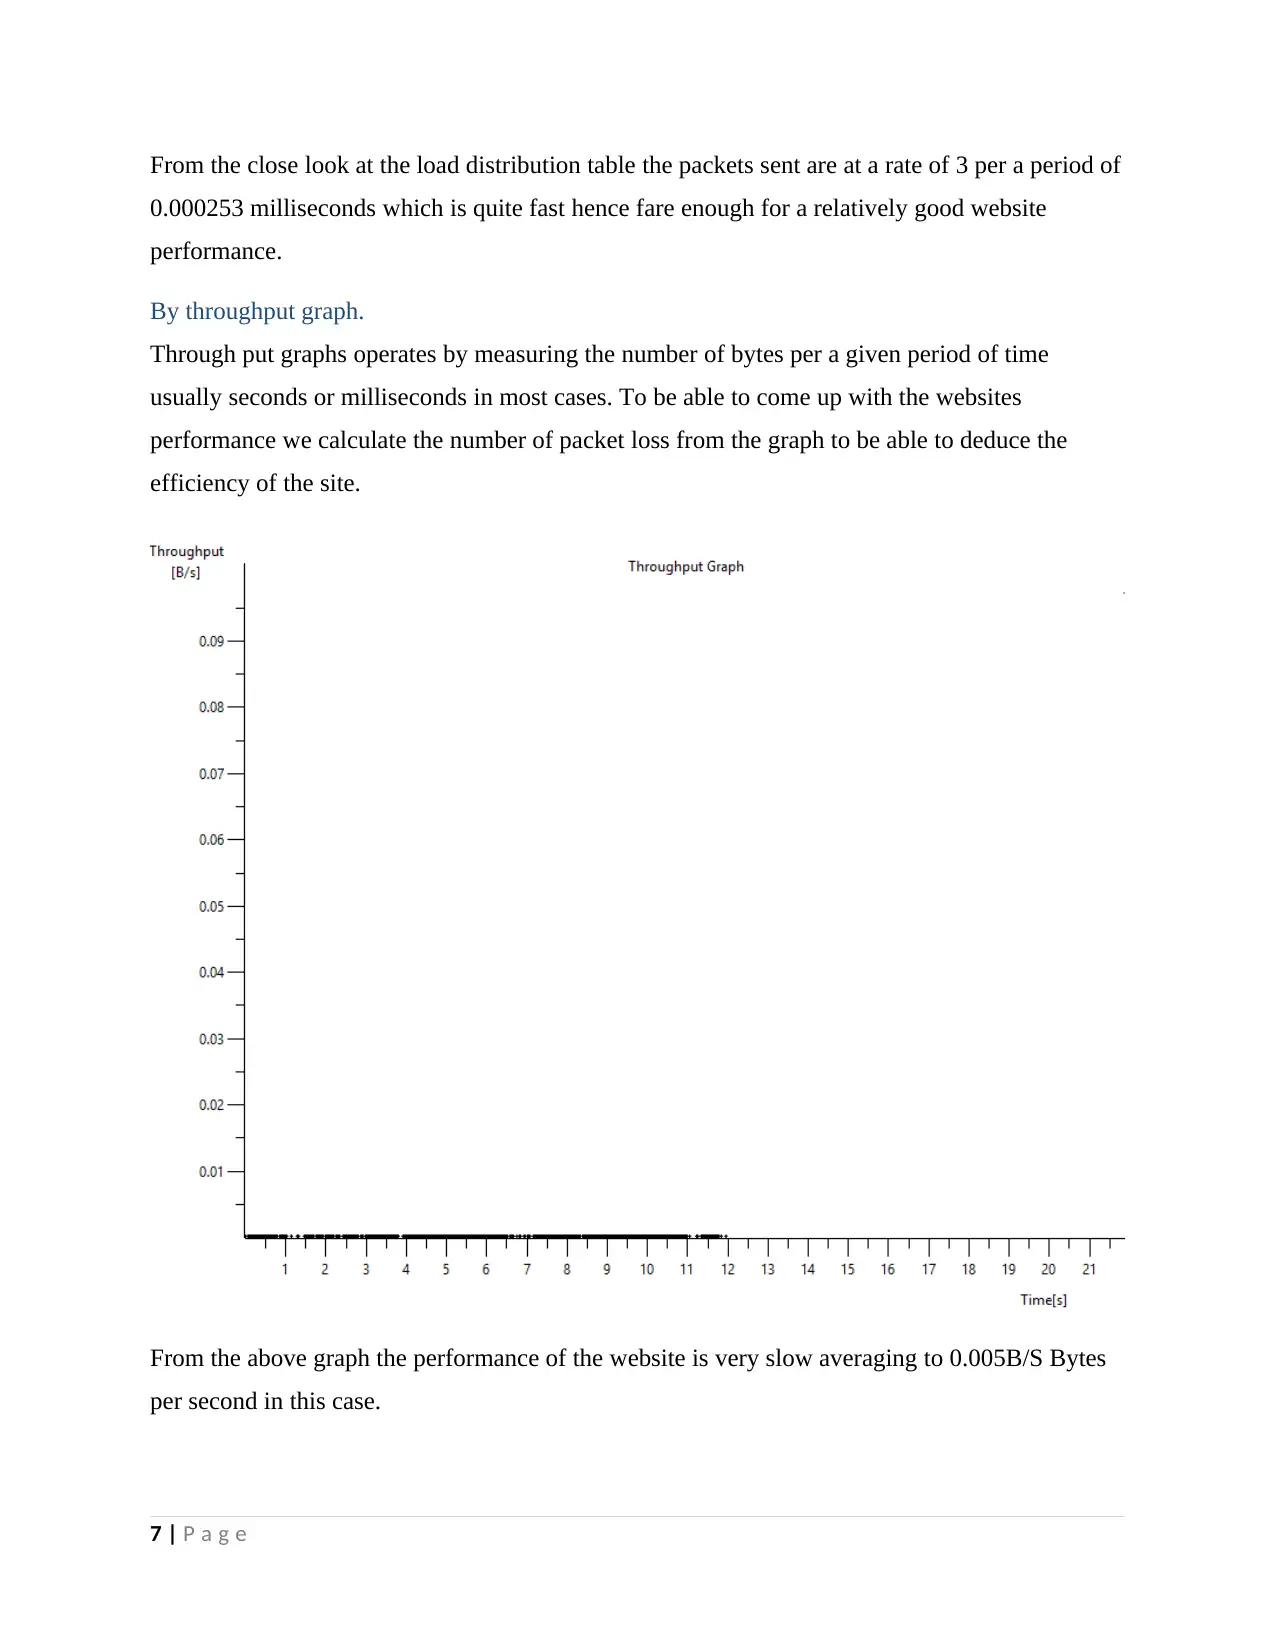
From the close look at the load distribution table the packets sent are at a rate of 3 per a period of
0.000253 milliseconds which is quite fast hence fare enough for a relatively good website
performance.
By throughput graph.
Through put graphs operates by measuring the number of bytes per a given period of time
usually seconds or milliseconds in most cases. To be able to come up with the websites
performance we calculate the number of packet loss from the graph to be able to deduce the
efficiency of the site.
From the above graph the performance of the website is very slow averaging to 0.005B/S Bytes
per second in this case.
7 | P a g e
Paraphrase This Document
Need a fresh take? Get an instant paraphrase of this document with our AI Paraphraser
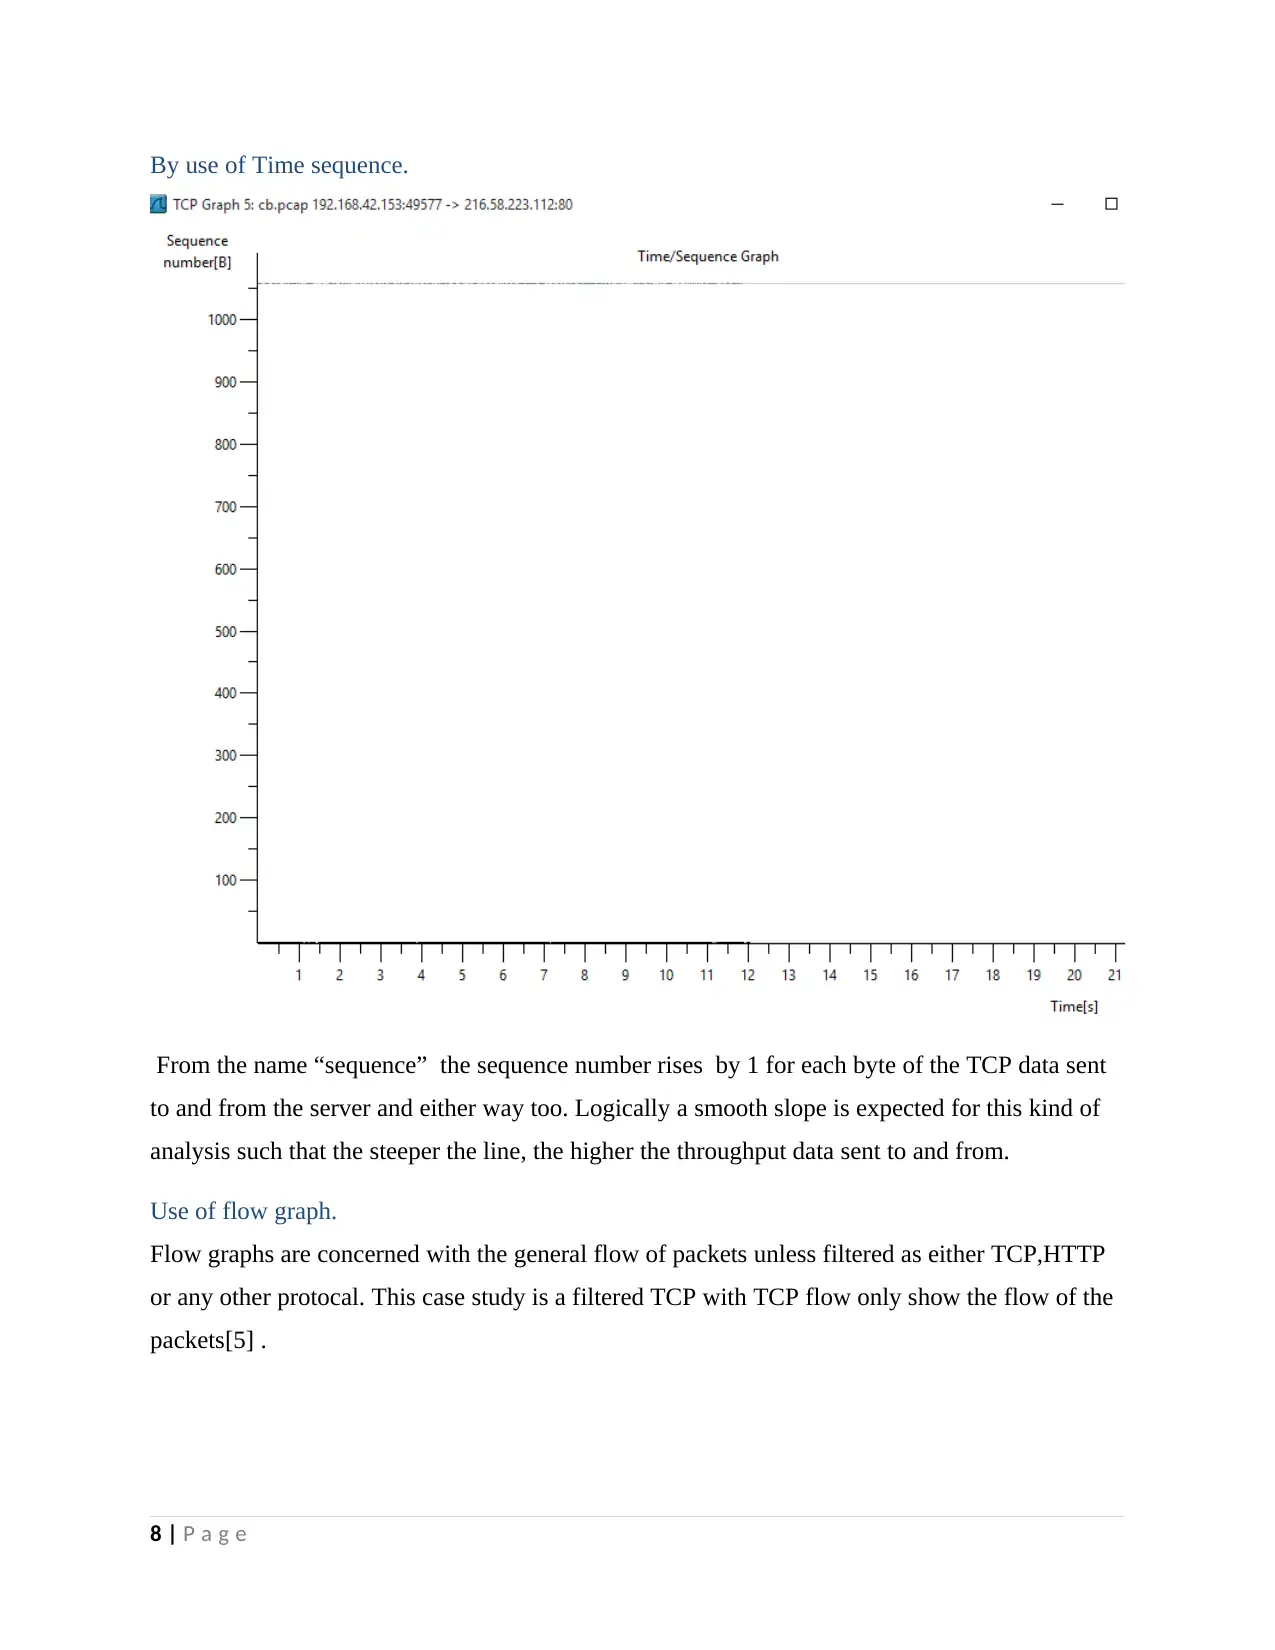
By use of Time sequence.
From the name “sequence” the sequence number rises by 1 for each byte of the TCP data sent
to and from the server and either way too. Logically a smooth slope is expected for this kind of
analysis such that the steeper the line, the higher the throughput data sent to and from.
Use of flow graph.
Flow graphs are concerned with the general flow of packets unless filtered as either TCP,HTTP
or any other protocal. This case study is a filtered TCP with TCP flow only show the flow of the
packets[5] .
8 | P a g e
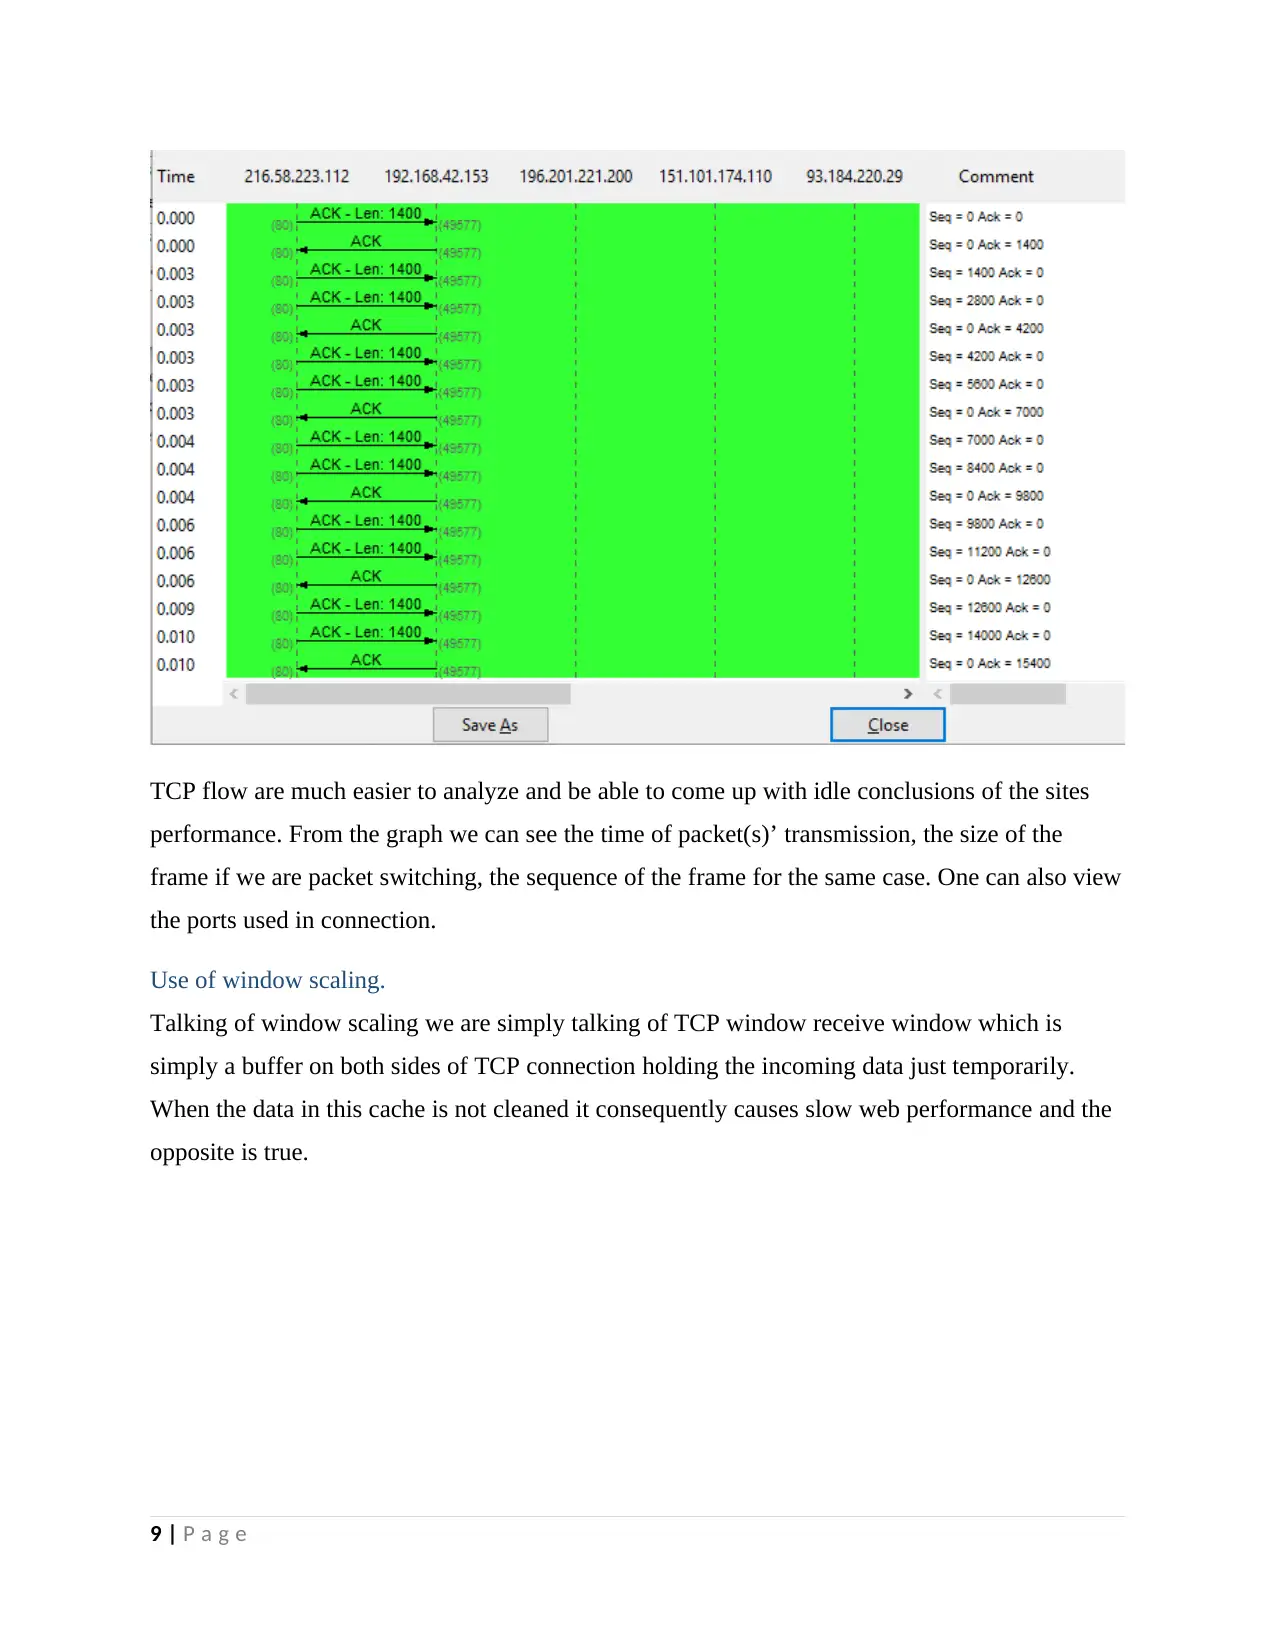
TCP flow are much easier to analyze and be able to come up with idle conclusions of the sites
performance. From the graph we can see the time of packet(s)’ transmission, the size of the
frame if we are packet switching, the sequence of the frame for the same case. One can also view
the ports used in connection.
Use of window scaling.
Talking of window scaling we are simply talking of TCP window receive window which is
simply a buffer on both sides of TCP connection holding the incoming data just temporarily.
When the data in this cache is not cleaned it consequently causes slow web performance and the
opposite is true.
9 | P a g e
⊘ This is a preview!⊘
Do you want full access?
Subscribe today to unlock all pages.

Trusted by 1+ million students worldwide
3.Online newspapers.
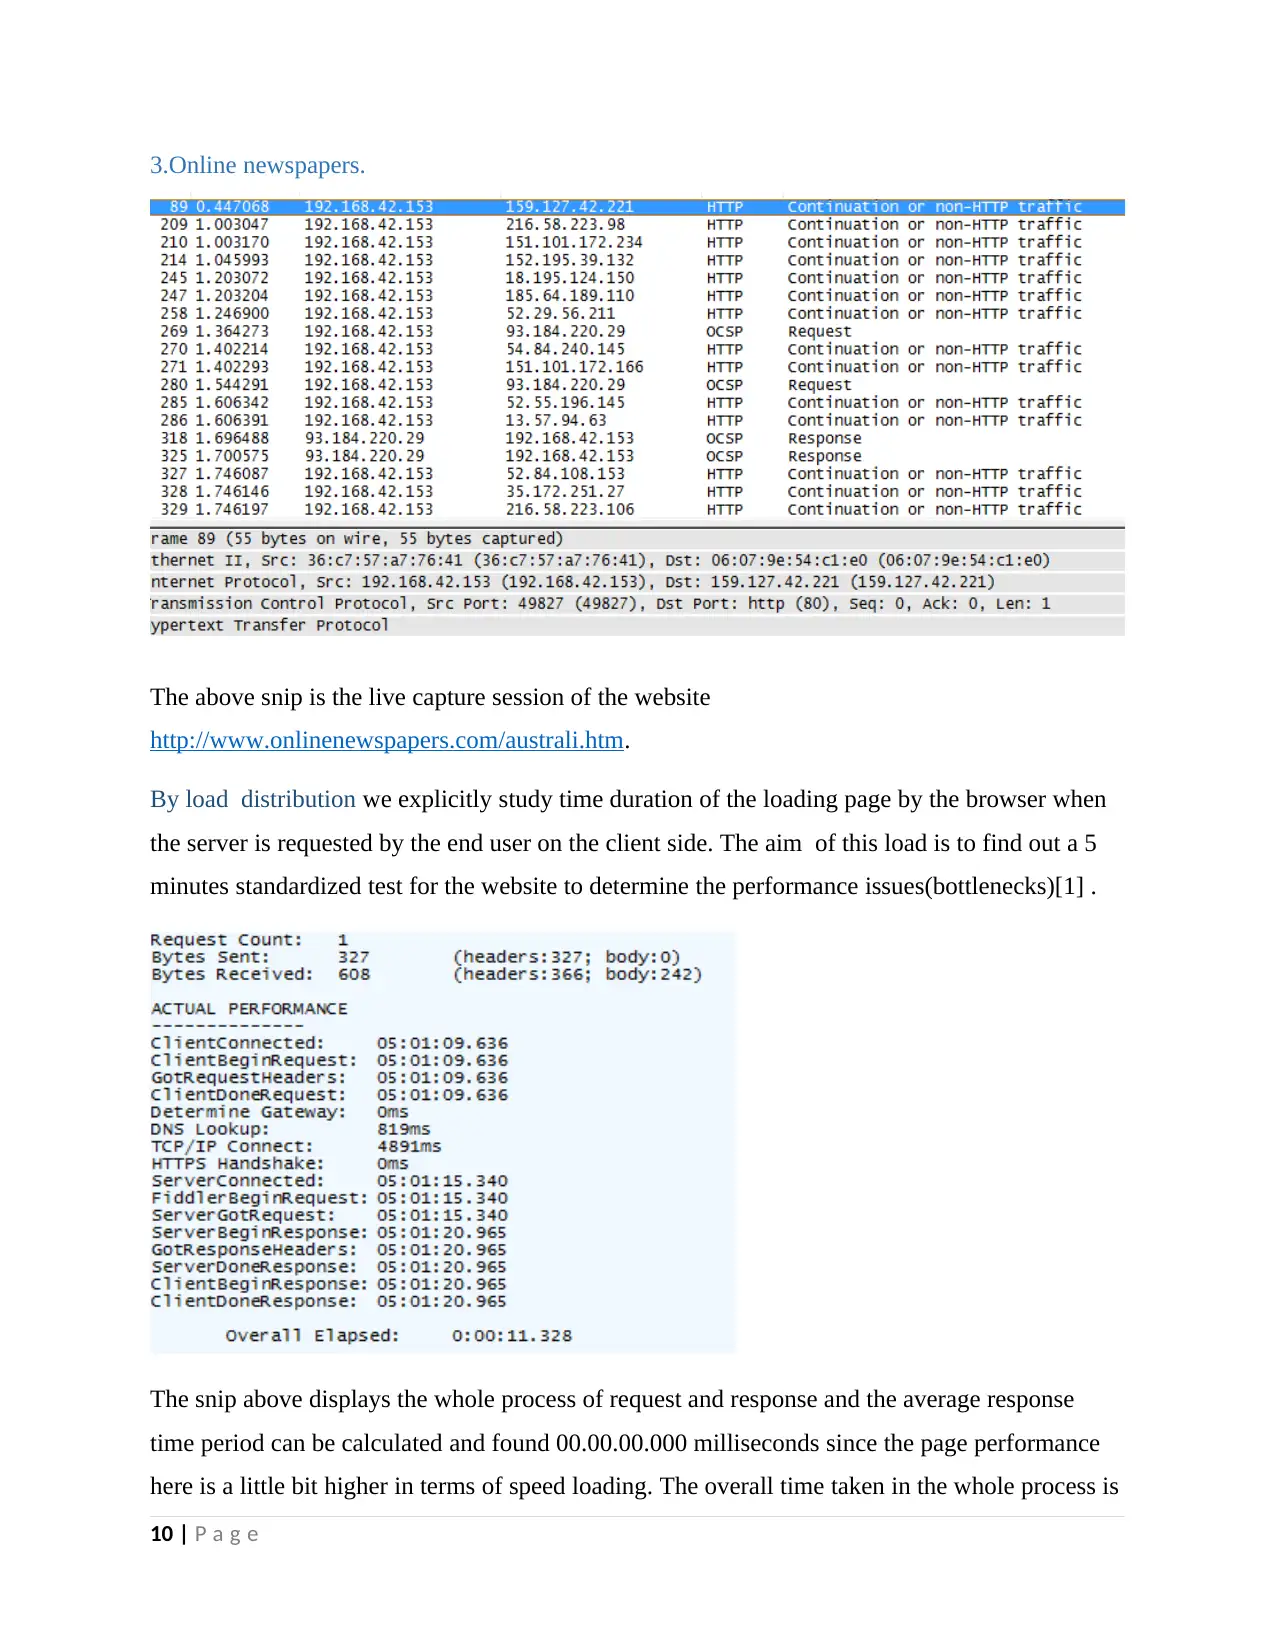
The above snip is the live capture session of the website
http://www.onlinenewspapers.com/australi.htm.
By load distribution we explicitly study time duration of the loading page by the browser when
the server is requested by the end user on the client side. The aim of this load is to find out a 5
minutes standardized test for the website to determine the performance issues(bottlenecks)[1] .
The snip above displays the whole process of request and response and the average response
time period can be calculated and found 00.00.00.000 milliseconds since the page performance
here is a little bit higher in terms of speed loading. The overall time taken in the whole process is
10 | P a g e
Paraphrase This Document
Need a fresh take? Get an instant paraphrase of this document with our AI Paraphraser
shown, performance of the website is said to be slow or fast relatively depending on several
factors such as the basic computer resources like the RAM and the CPU processing power.
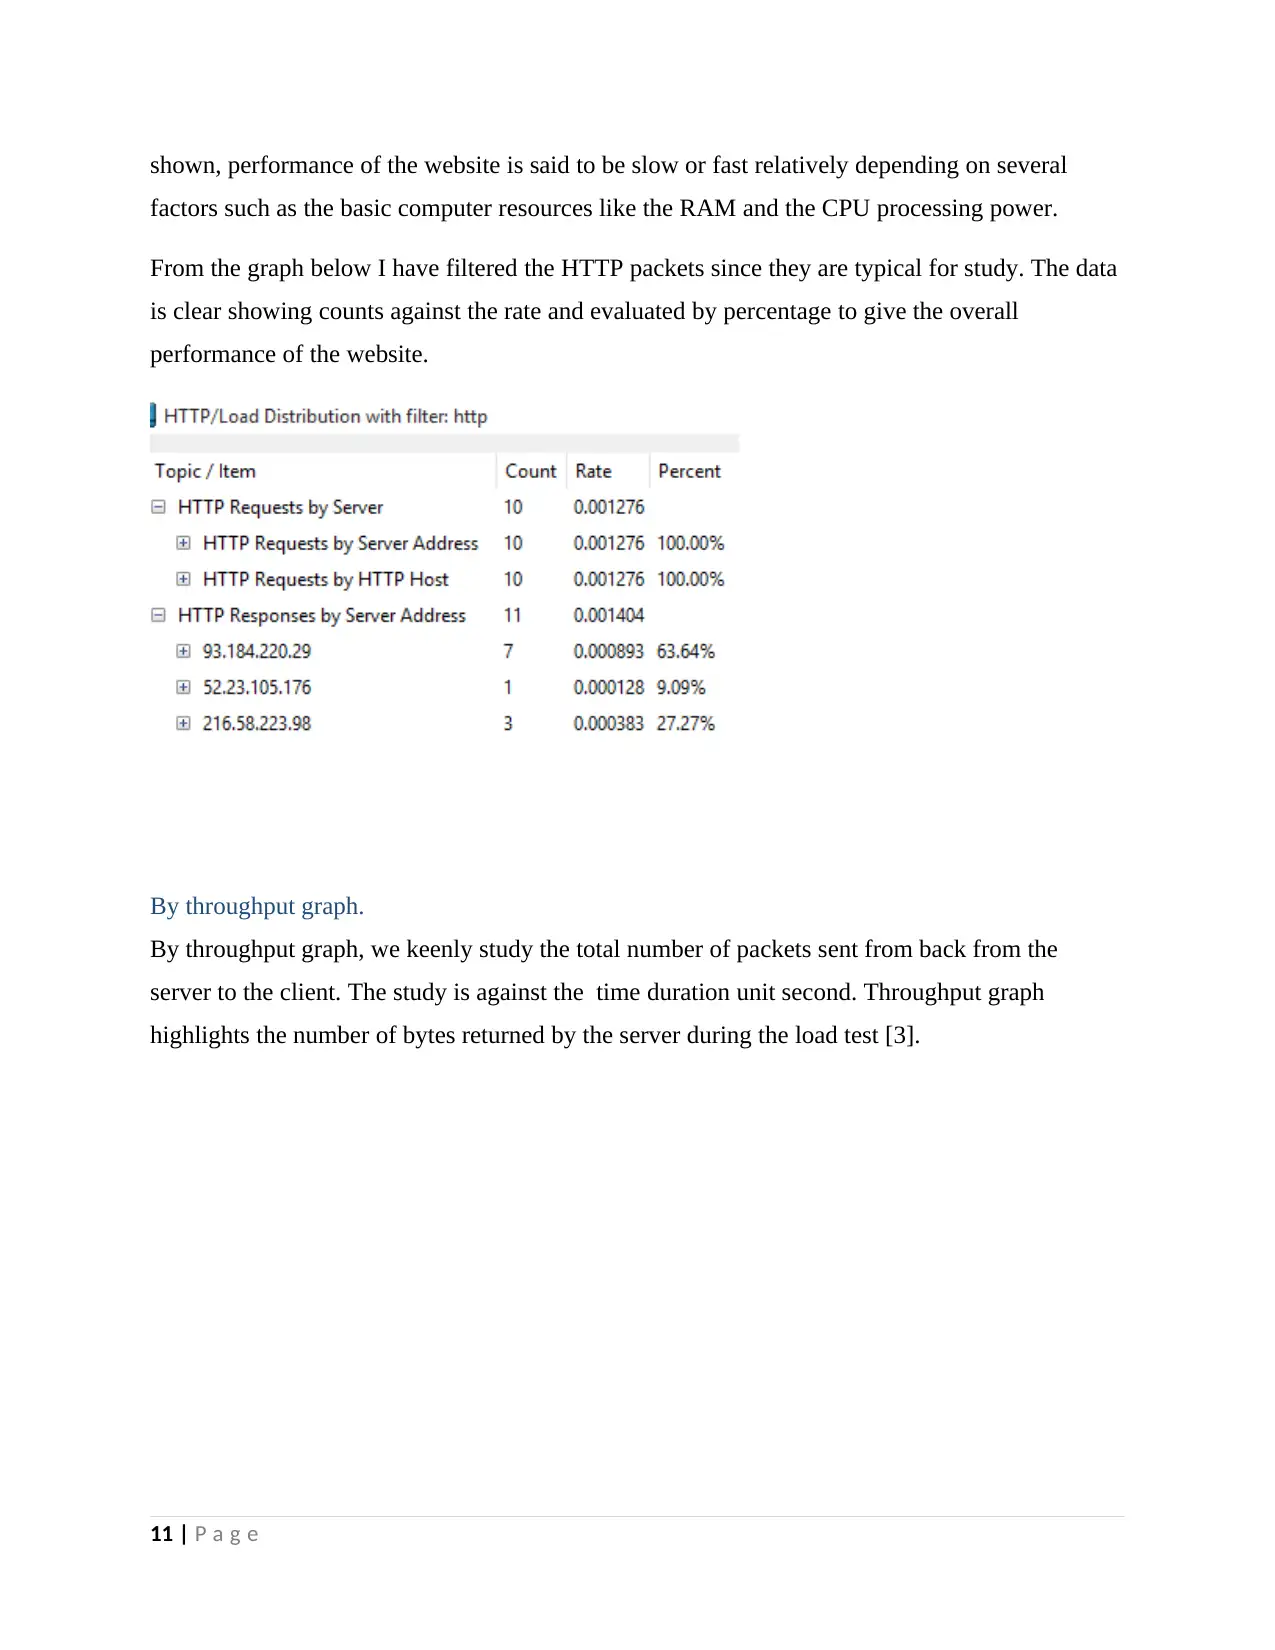
From the graph below I have filtered the HTTP packets since they are typical for study. The data
is clear showing counts against the rate and evaluated by percentage to give the overall
performance of the website.
By throughput graph.
By throughput graph, we keenly study the total number of packets sent from back from the
server to the client. The study is against the time duration unit second. Throughput graph
highlights the number of bytes returned by the server during the load test [3].
11 | P a g e
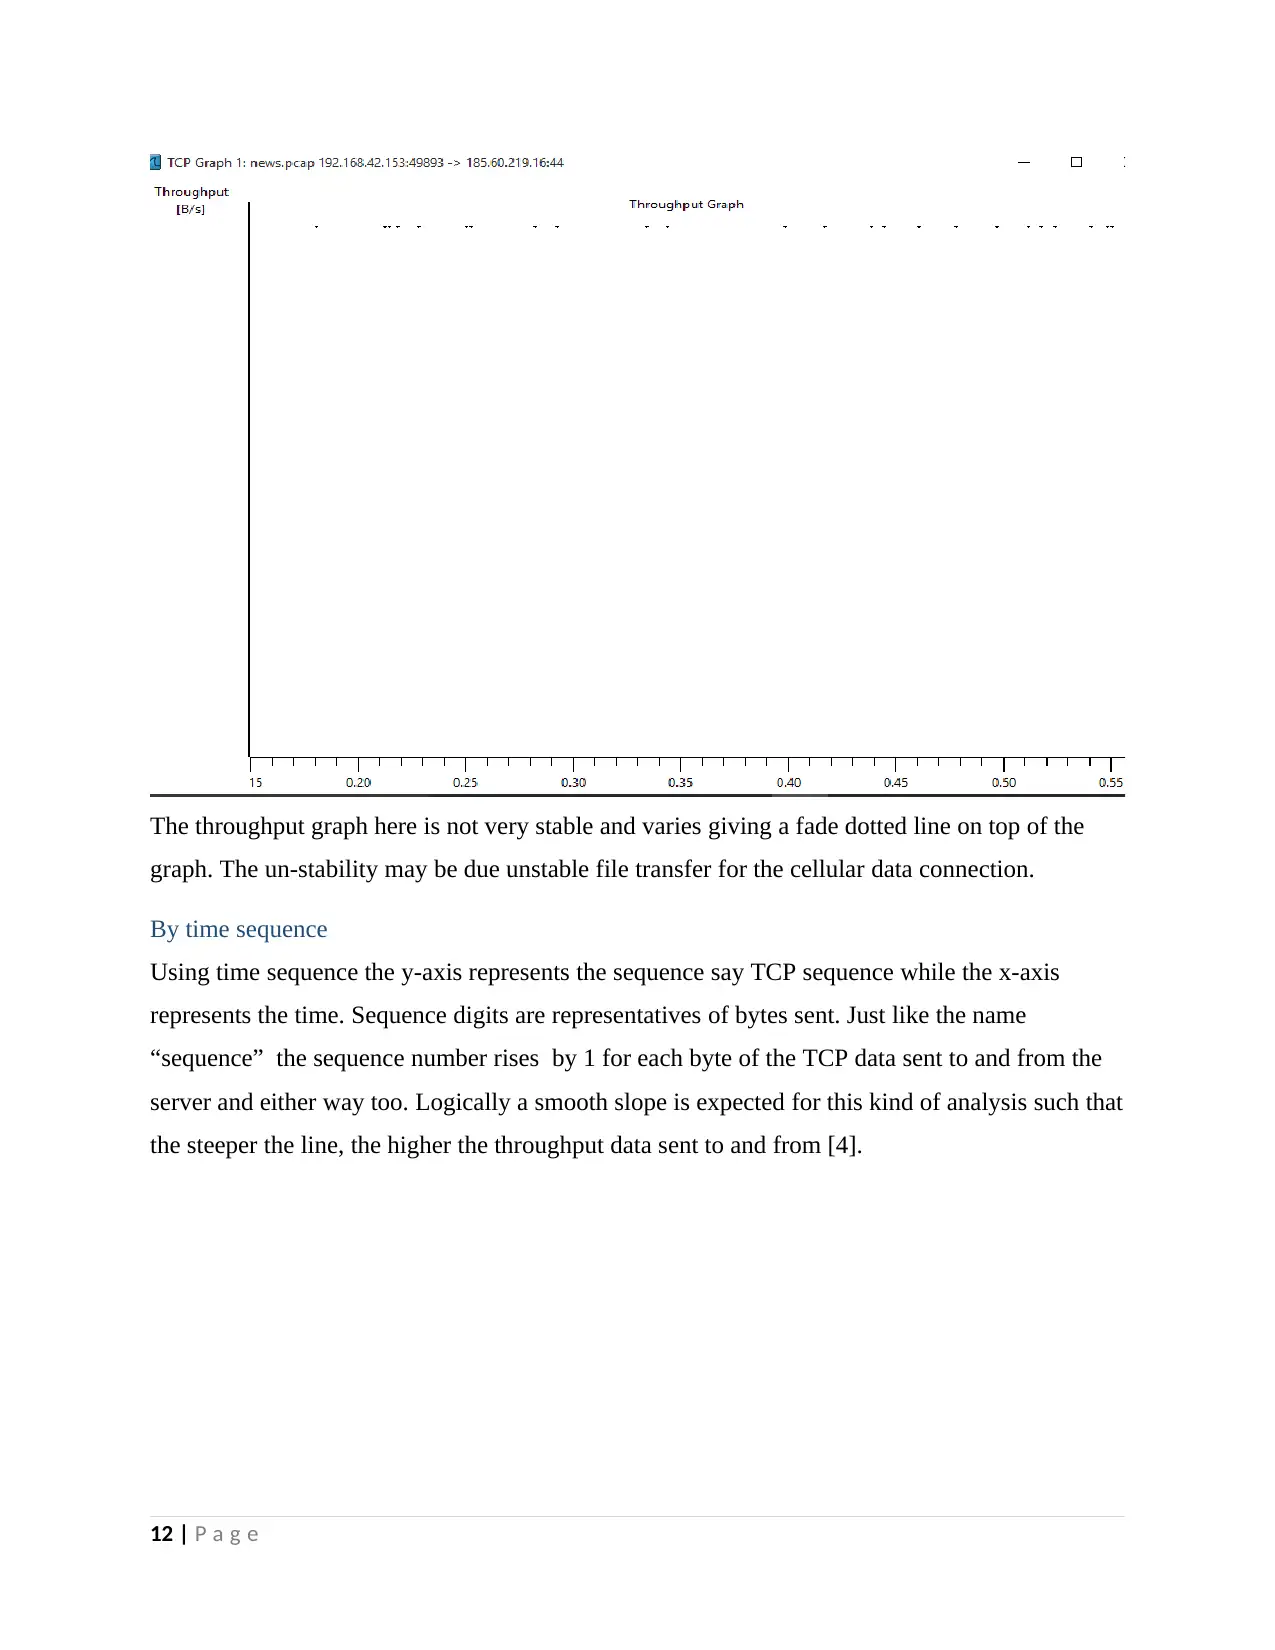
The throughput graph here is not very stable and varies giving a fade dotted line on top of the
graph. The un-stability may be due unstable file transfer for the cellular data connection.
By time sequence
Using time sequence the y-axis represents the sequence say TCP sequence while the x-axis
represents the time. Sequence digits are representatives of bytes sent. Just like the name
“sequence” the sequence number rises by 1 for each byte of the TCP data sent to and from the
server and either way too. Logically a smooth slope is expected for this kind of analysis such that
the steeper the line, the higher the throughput data sent to and from [4].
12 | P a g e
⊘ This is a preview!⊘
Do you want full access?
Subscribe today to unlock all pages.

Trusted by 1+ million students worldwide
1 out of 20
Related Documents
Your All-in-One AI-Powered Toolkit for Academic Success.
+13062052269
info@desklib.com
Available 24*7 on WhatsApp / Email
![[object Object]](/_next/static/media/star-bottom.7253800d.svg)
Unlock your academic potential
Copyright © 2020–2026 A2Z Services. All Rights Reserved. Developed and managed by ZUCOL.


