Comprehensive Analysis of MSFT and APPL Stock Investment Strategies
VerifiedAdded on 2021/02/20
|11
|1097
|47
Project
AI Summary
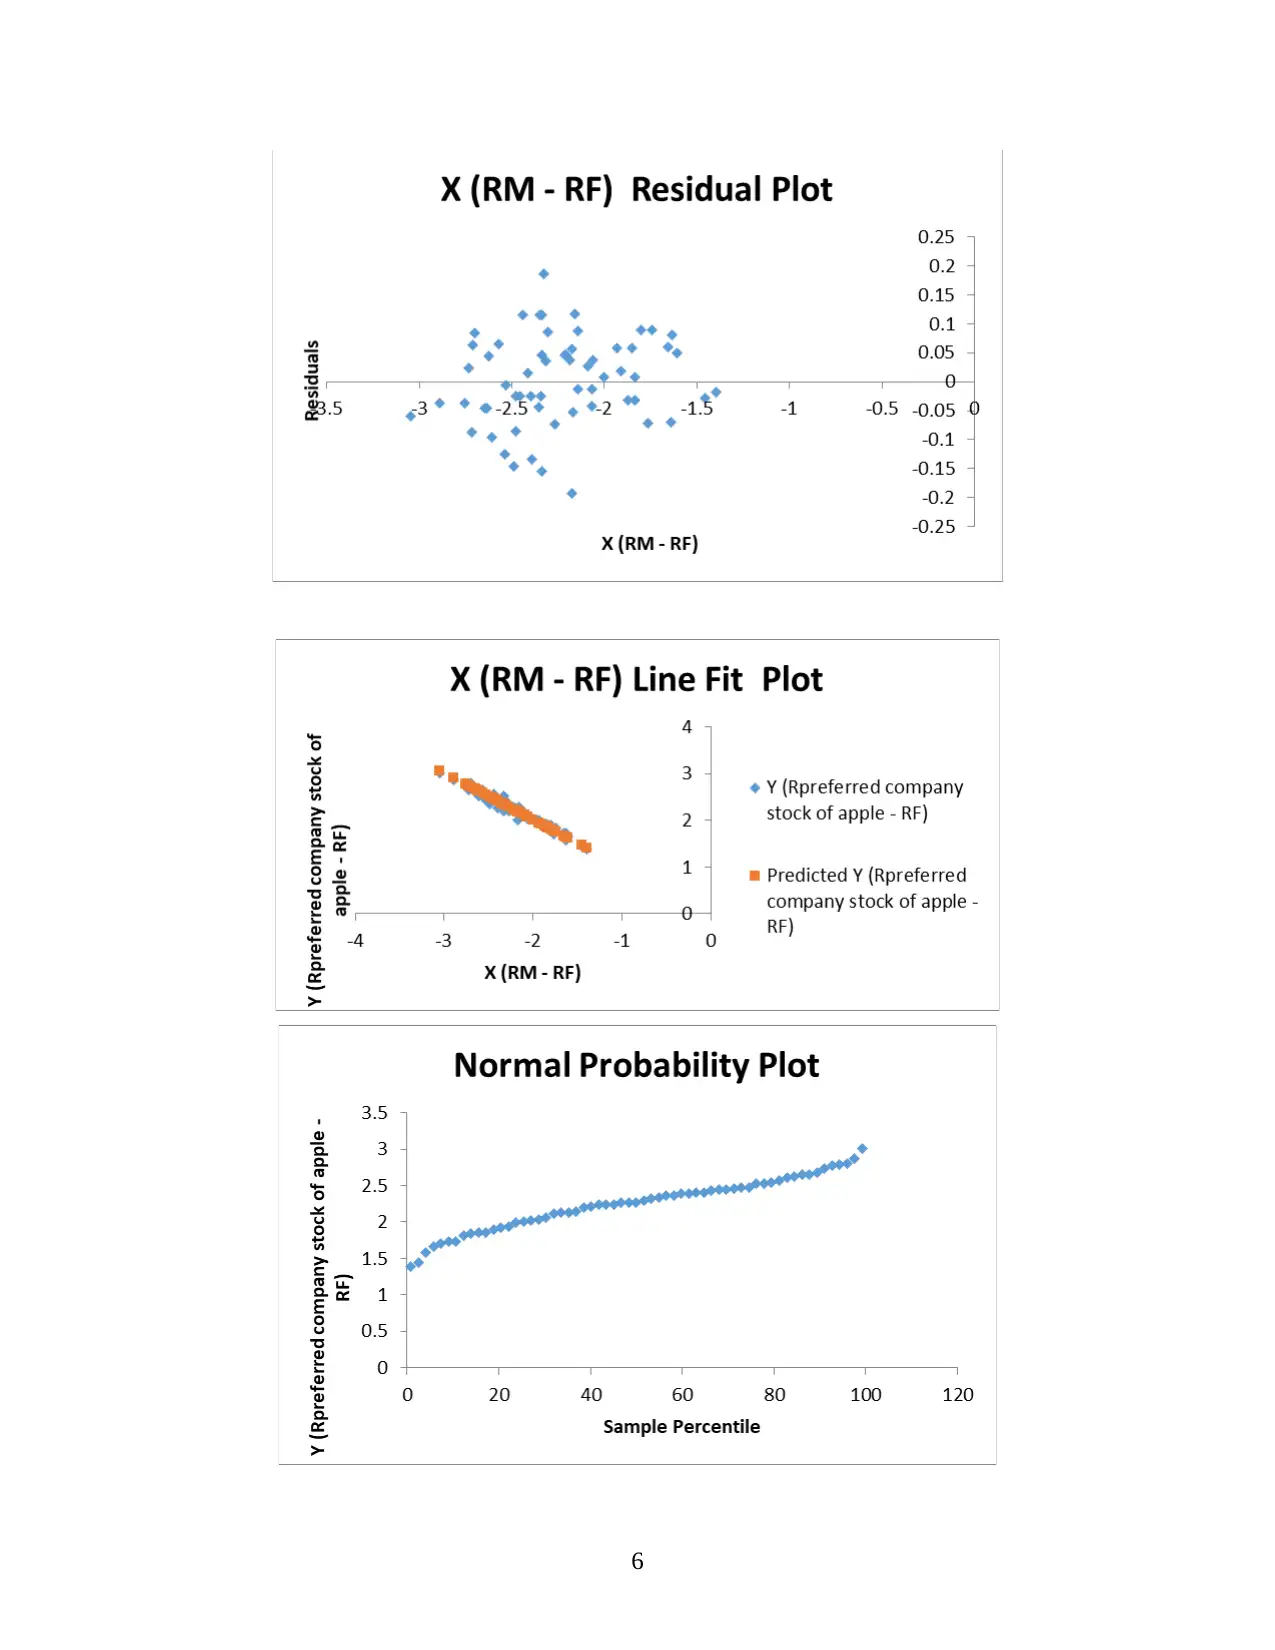
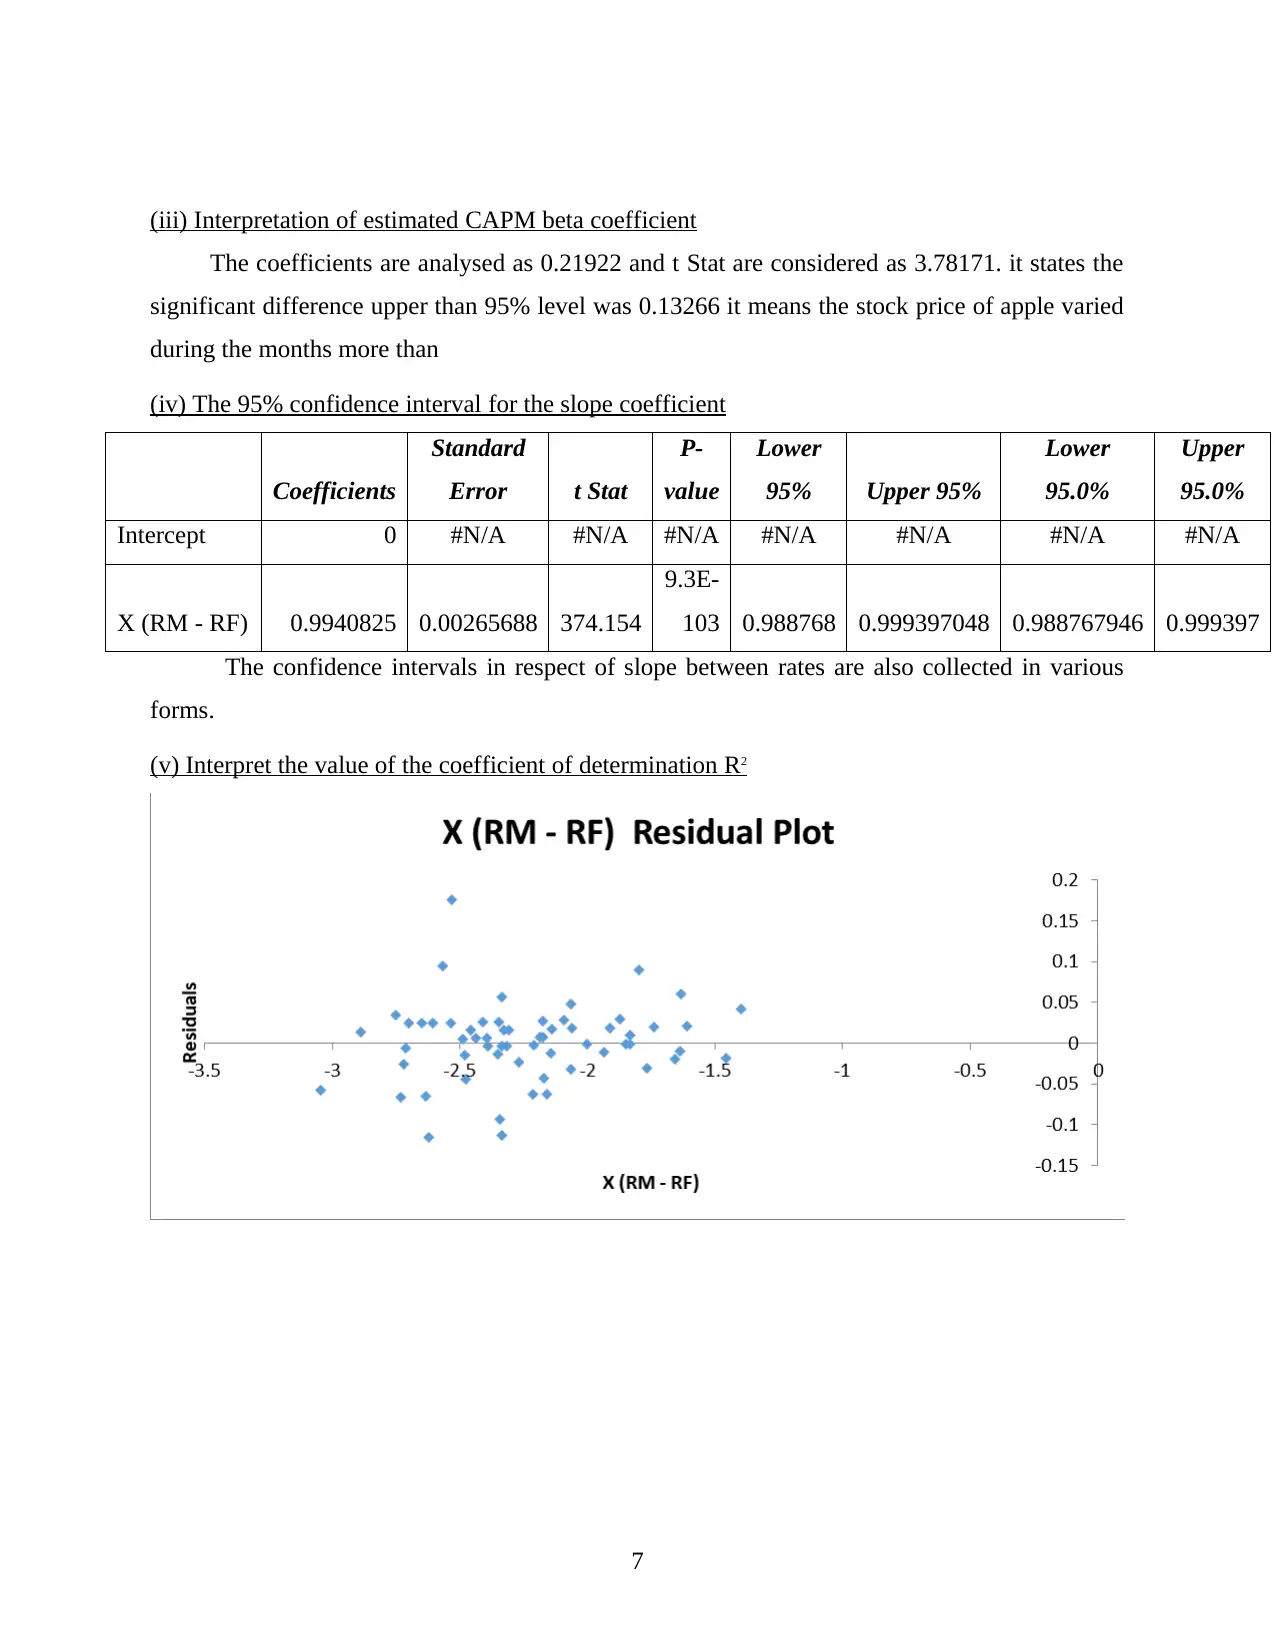
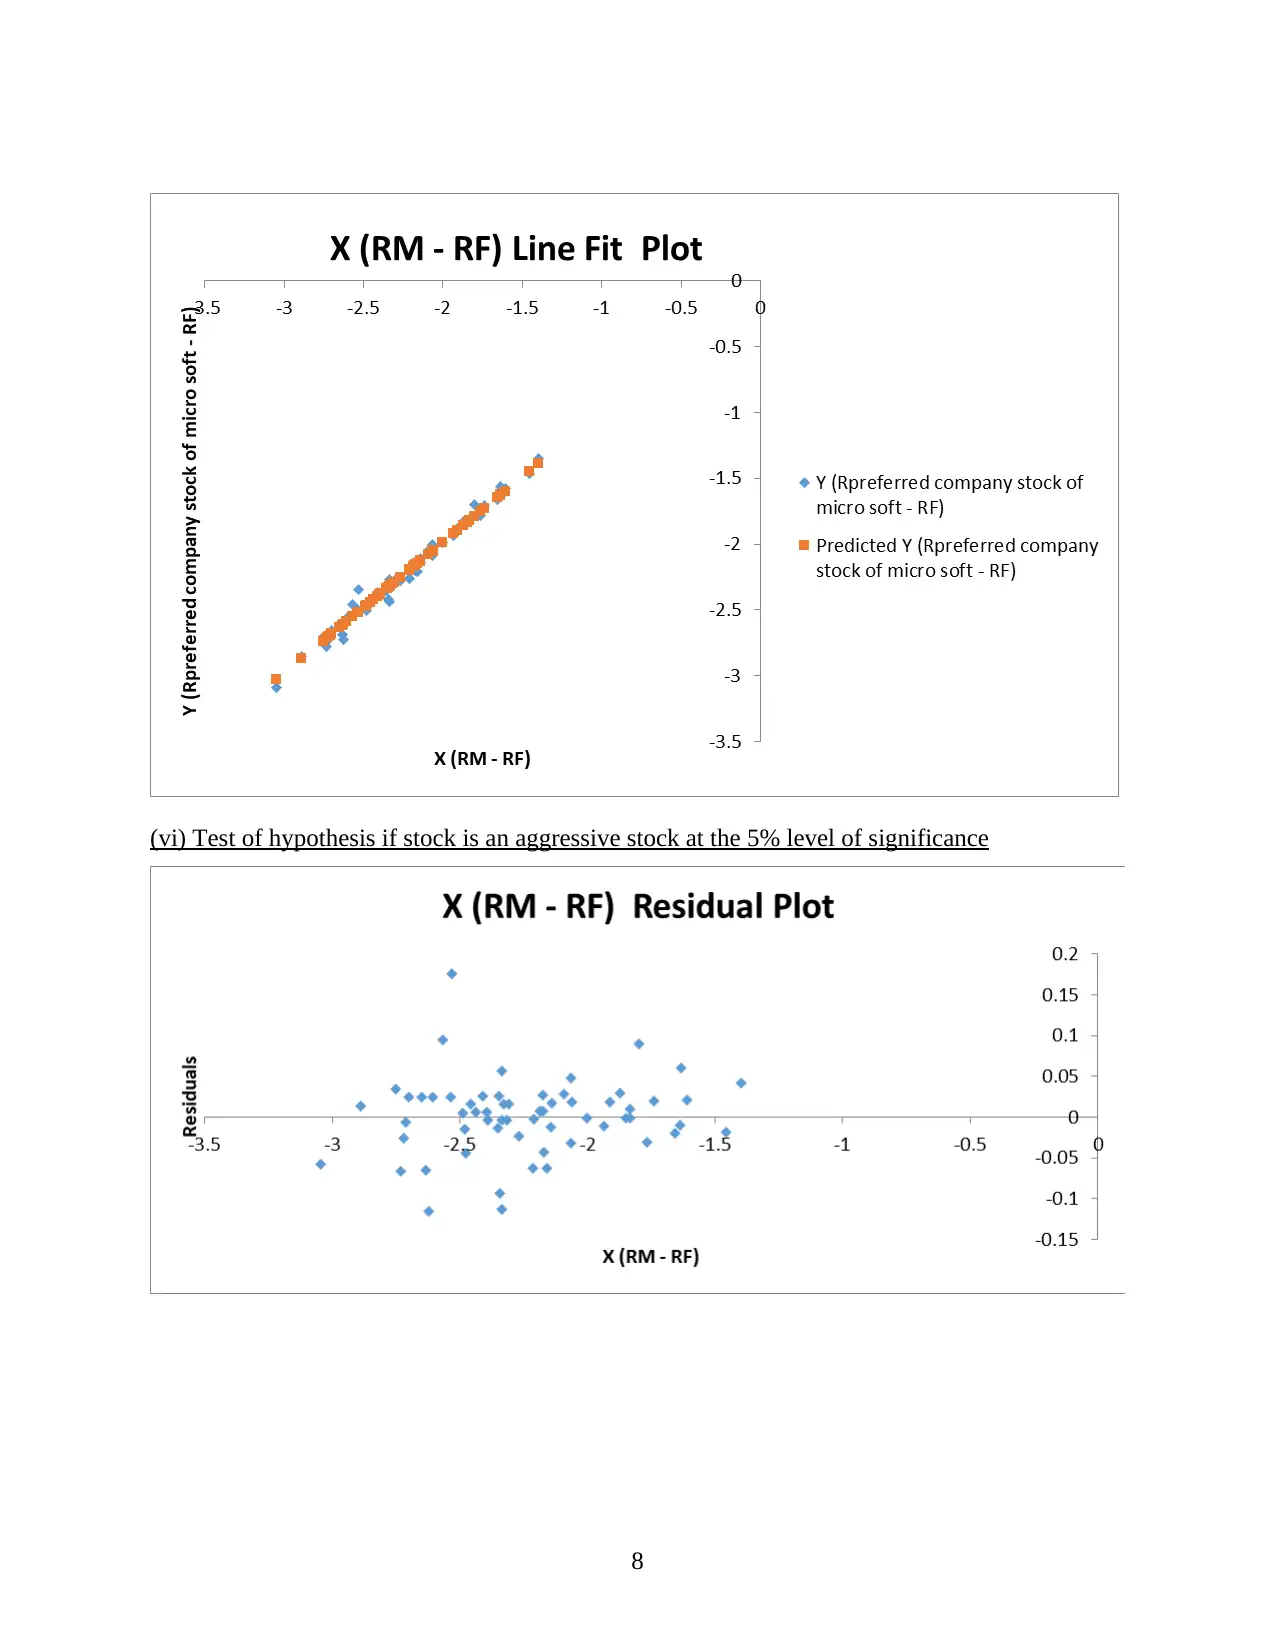
This project undertakes a detailed financial analysis of Microsoft (MSFT) and Apple (APPL) stocks. It begins with hypothesis testing, including the Jarque-Berra test for normality of returns and a t-test to assess if the average return on APPL differs from 3%. The project then compares the risks associated with both stocks using statistical measures like mean, variance, and correlation. Furthermore, regression analysis is employed to evaluate the excess market return, estimate the Capital Asset Pricing Model (CAPM) beta coefficient, interpret the coefficient of determination (R2), and test whether a stock is aggressive. The analysis involves interpreting statistical outputs such as coefficients, t-stats, p-values, and confidence intervals to draw conclusions about the investment characteristics of MSFT and APPL. The project aims to provide insights into stock performance and investment strategies through rigorous financial modeling and statistical analysis.


1 out of 11
Related Documents

![Statistical Analysis of Business and Finance Data - [Semester]](/_next/image/?url=https%3A%2F%2Fdesklib.com%2Fmedia%2Fbusiness-finance-statistics-hypothesis-interpretation_page_2.jpg&w=256&q=75)


Your All-in-One AI-Powered Toolkit for Academic Success.
+13062052269
info@desklib.com
Available 24*7 on WhatsApp / Email
![[object Object]](/_next/static/media/star-bottom.7253800d.svg)
Copyright © 2020–2026 A2Z Services. All Rights Reserved. Developed and managed by ZUCOL.