Statistics for Business and Finance Assignment
Added on 2023-06-03
15 Pages3064 Words264 Views
Running Head: STATISTICS FOR BUSINESS AND FINANCE ASSIGNMENT
STATISTICS FOR BUSINESS AND FINANCE ASSIGNMENT
Student’s Name
Institution Affiliation
STATISTICS FOR BUSINESS AND FINANCE ASSIGNMENT
Student’s Name
Institution Affiliation
2 | S t a t i s t i c s f o r B u s i n e s s A n d F i n a n c e
Contents
1. Computation of the return of the three series of stock prices...............................................................3
1.1. Jarque-Berra test: Are GD and Boeing Stocks’ Returns normally distributed or not?................3
1.2. Risk–return relationship...............................................................................................................4
2. Hypothesis test at 0.05% significant level: Is average returns of GD stock is equal to 2.8% or
different?.....................................................................................................................................................5
3. Hypothesis test at 0.05% significant level: Are the variances of GD and Boeing (BA) stocks similar
or different?.................................................................................................................................................5
4. Hypothesis test at 0.05% significant level: Are the average returns of GD and BA stocks equal or
not?..............................................................................................................................................................6
5. CAPM Model..........................................................................................................................................7
5.0. Computation of excess return of GD and excess market return........................................................7
5.1. CAPM Estimation.............................................................................................................................7
5.2. Interpretation of CAPM Beta............................................................................................................8
5.3. Interpretation of R 2.........................................................................................................................8
5.4. Interpretation of confidence interval for CAPM Beta.......................................................................8
6. Hypothesis test using confidence interval approach at 0.05% significant level: Is GD stock a neutral
stock or not?................................................................................................................................................8
7. Hypothesis test at 0.05% significant level: Is error term in ordinary least squares normally distributed
or not?.........................................................................................................................................................9
Reference...................................................................................................................................................10
APPENDIX...............................................................................................................................................10
Table 1: Computed Returns for GSPC, GD and BA stock prices..........................................................10
Table 2: Computed Excess Returns for GD...........................................................................................12
3 | S t a t i s t i c s f o r B u s i n e s s A n d F i n a n c e
Data Analysis
The analysis and calculating were done in Microsoft Excel and SPSS software. Below are the
results of the results of data analysis as per the Task.
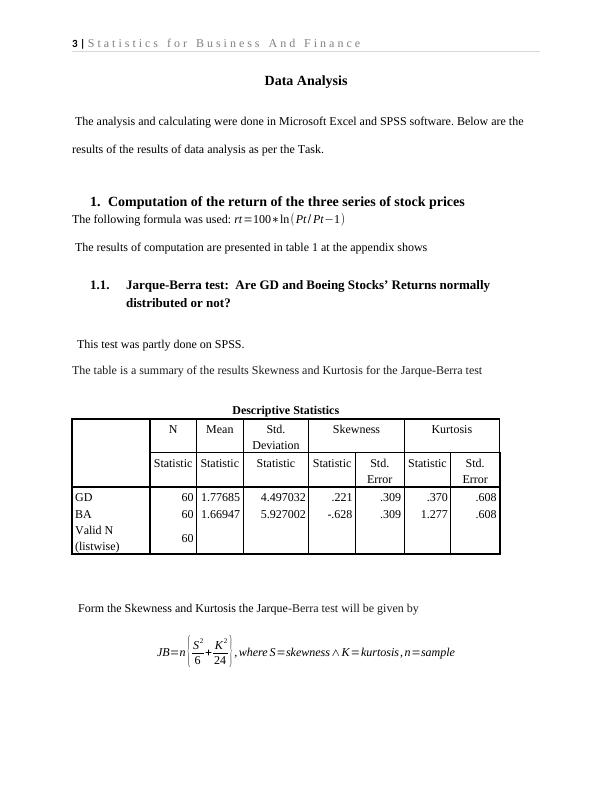
1. Computation of the return of the three series of stock prices
The following formula was used: rt=100∗ln(Pt / Pt−1)
The results of computation are presented in table 1 at the appendix shows
1.1. Jarque-Berra test: Are GD and Boeing Stocks’ Returns normally
distributed or not?
This test was partly done on SPSS.
The table is a summary of the results Skewness and Kurtosis for the Jarque-Berra test
Descriptive Statistics
N Mean Std.
Deviation
Skewness Kurtosis
Statistic Statistic Statistic Statistic Std.
Error
Statistic Std.
Error
GD 60 1.77685 4.497032 .221 .309 .370 .608
BA 60 1.66947 5.927002 -.628 .309 1.277 .608
Valid N
(listwise) 60
Form the Skewness and Kurtosis the Jarque-Berra test will be given by
JB=n { S2
6 + K2
24 } , where S=skewness∧K=kurtosis, n=sample
Data Analysis
The analysis and calculating were done in Microsoft Excel and SPSS software. Below are the
results of the results of data analysis as per the Task.
1. Computation of the return of the three series of stock prices
The following formula was used: rt=100∗ln(Pt / Pt−1)
The results of computation are presented in table 1 at the appendix shows
1.1. Jarque-Berra test: Are GD and Boeing Stocks’ Returns normally
distributed or not?
This test was partly done on SPSS.
The table is a summary of the results Skewness and Kurtosis for the Jarque-Berra test
Descriptive Statistics
N Mean Std.
Deviation
Skewness Kurtosis
Statistic Statistic Statistic Statistic Std.
Error
Statistic Std.
Error
GD 60 1.77685 4.497032 .221 .309 .370 .608
BA 60 1.66947 5.927002 -.628 .309 1.277 .608
Valid N
(listwise) 60
Form the Skewness and Kurtosis the Jarque-Berra test will be given by
JB=n { S2
6 + K2
24 } , where S=skewness∧K=kurtosis, n=sample
4 | S t a t i s t i c s f o r B u s i n e s s A n d F i n a n c e
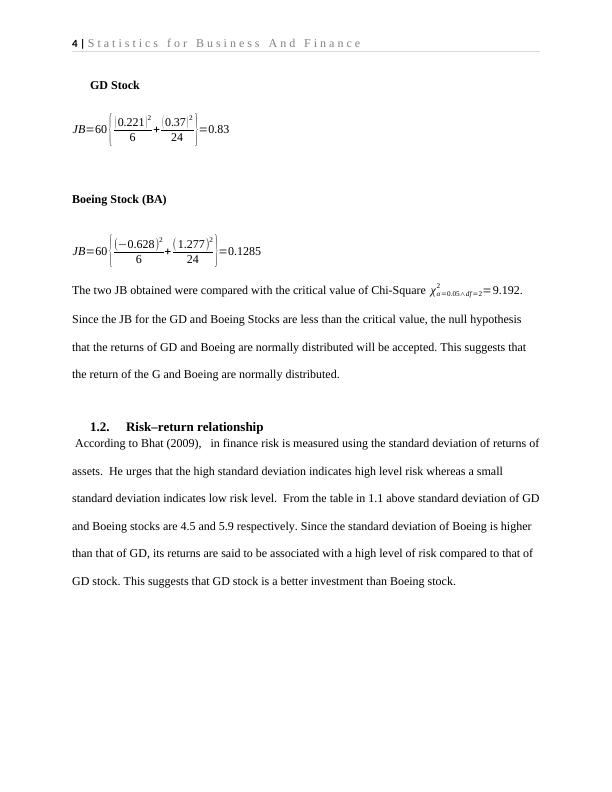
GD Stock
JB=60 { ( 0.221 )2
6 + ( 0.37 )2
24 }=0.83
Boeing Stock (BA)
JB=60 { (−0.628)2
6 + (1.277)2
24 }=0.1285
The two JB obtained were compared with the critical value of Chi-Square χα=0.05∧df =2
2 =9.192.
Since the JB for the GD and Boeing Stocks are less than the critical value, the null hypothesis
that the returns of GD and Boeing are normally distributed will be accepted. This suggests that
the return of the G and Boeing are normally distributed.
1.2. Risk–return relationship
According to Bhat (2009), in finance risk is measured using the standard deviation of returns of
assets. He urges that the high standard deviation indicates high level risk whereas a small
standard deviation indicates low risk level. From the table in 1.1 above standard deviation of GD
and Boeing stocks are 4.5 and 5.9 respectively. Since the standard deviation of Boeing is higher
than that of GD, its returns are said to be associated with a high level of risk compared to that of
GD stock. This suggests that GD stock is a better investment than Boeing stock.
End of preview
Want to access all the pages? Upload your documents or become a member.
Related Documents
Comparison of Boeing Company (BA) and General Dynamics (GD) Stock Prices: Analysis and Findingslg...
|15
|4454
|391
Which Stock Should I Invest In PHUONG THAO BUIlg...
|11
|2540
|64
Statistical Analysis and Comparison between Stock Prices of Boeing Company and General Dynamicslg...
|12
|4094
|443
Stock Return Analysislg...
|8
|1300
|101
Statistics for Business and Finance - Hypothesis Testing, CAPM Model and Regression Analysislg...
|10
|1170
|212
Statistics of Business and Financelg...
|9
|1388
|439