ACC211 Task 2: Financial Viability and Sensitivity Analysis of Project

Verified

Added on  2023/06/12

|25
|2866
|486
Report
AI Summary
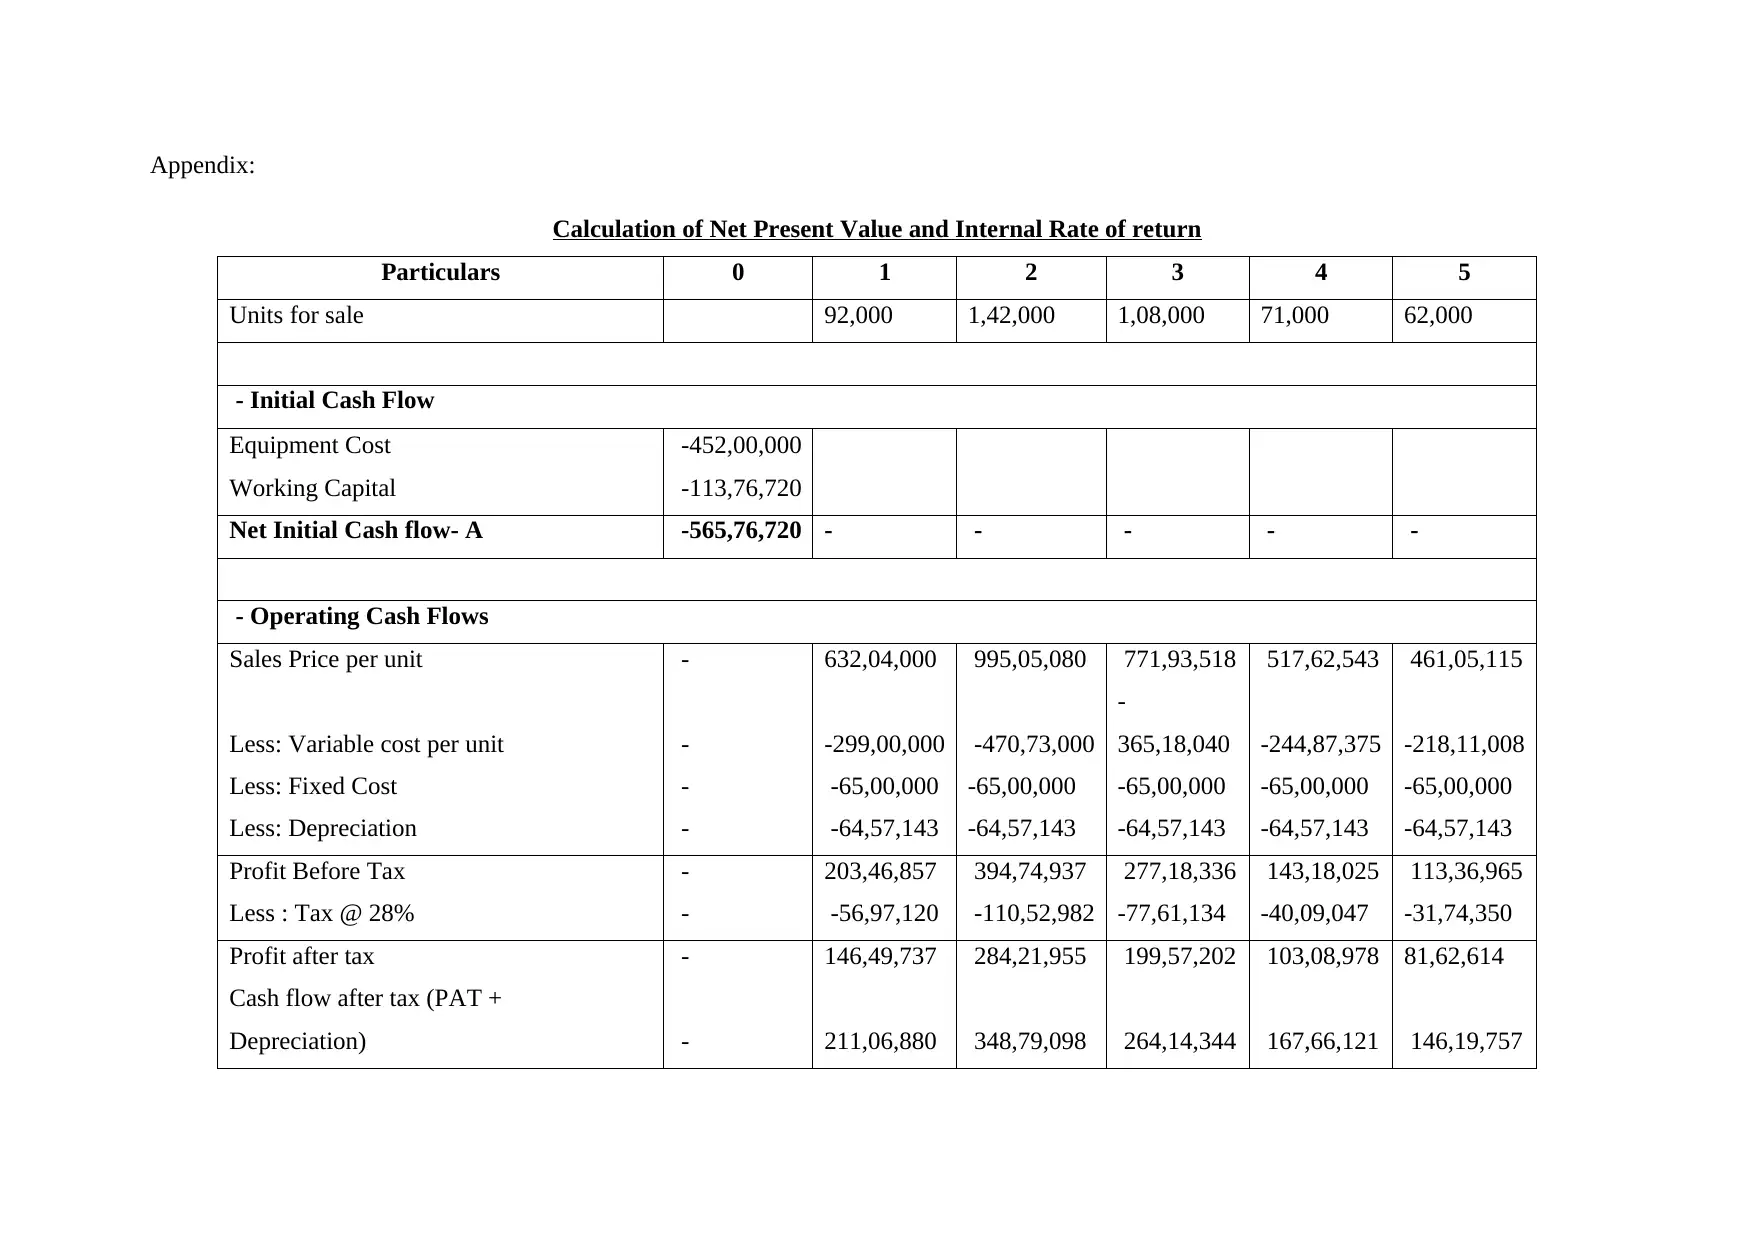
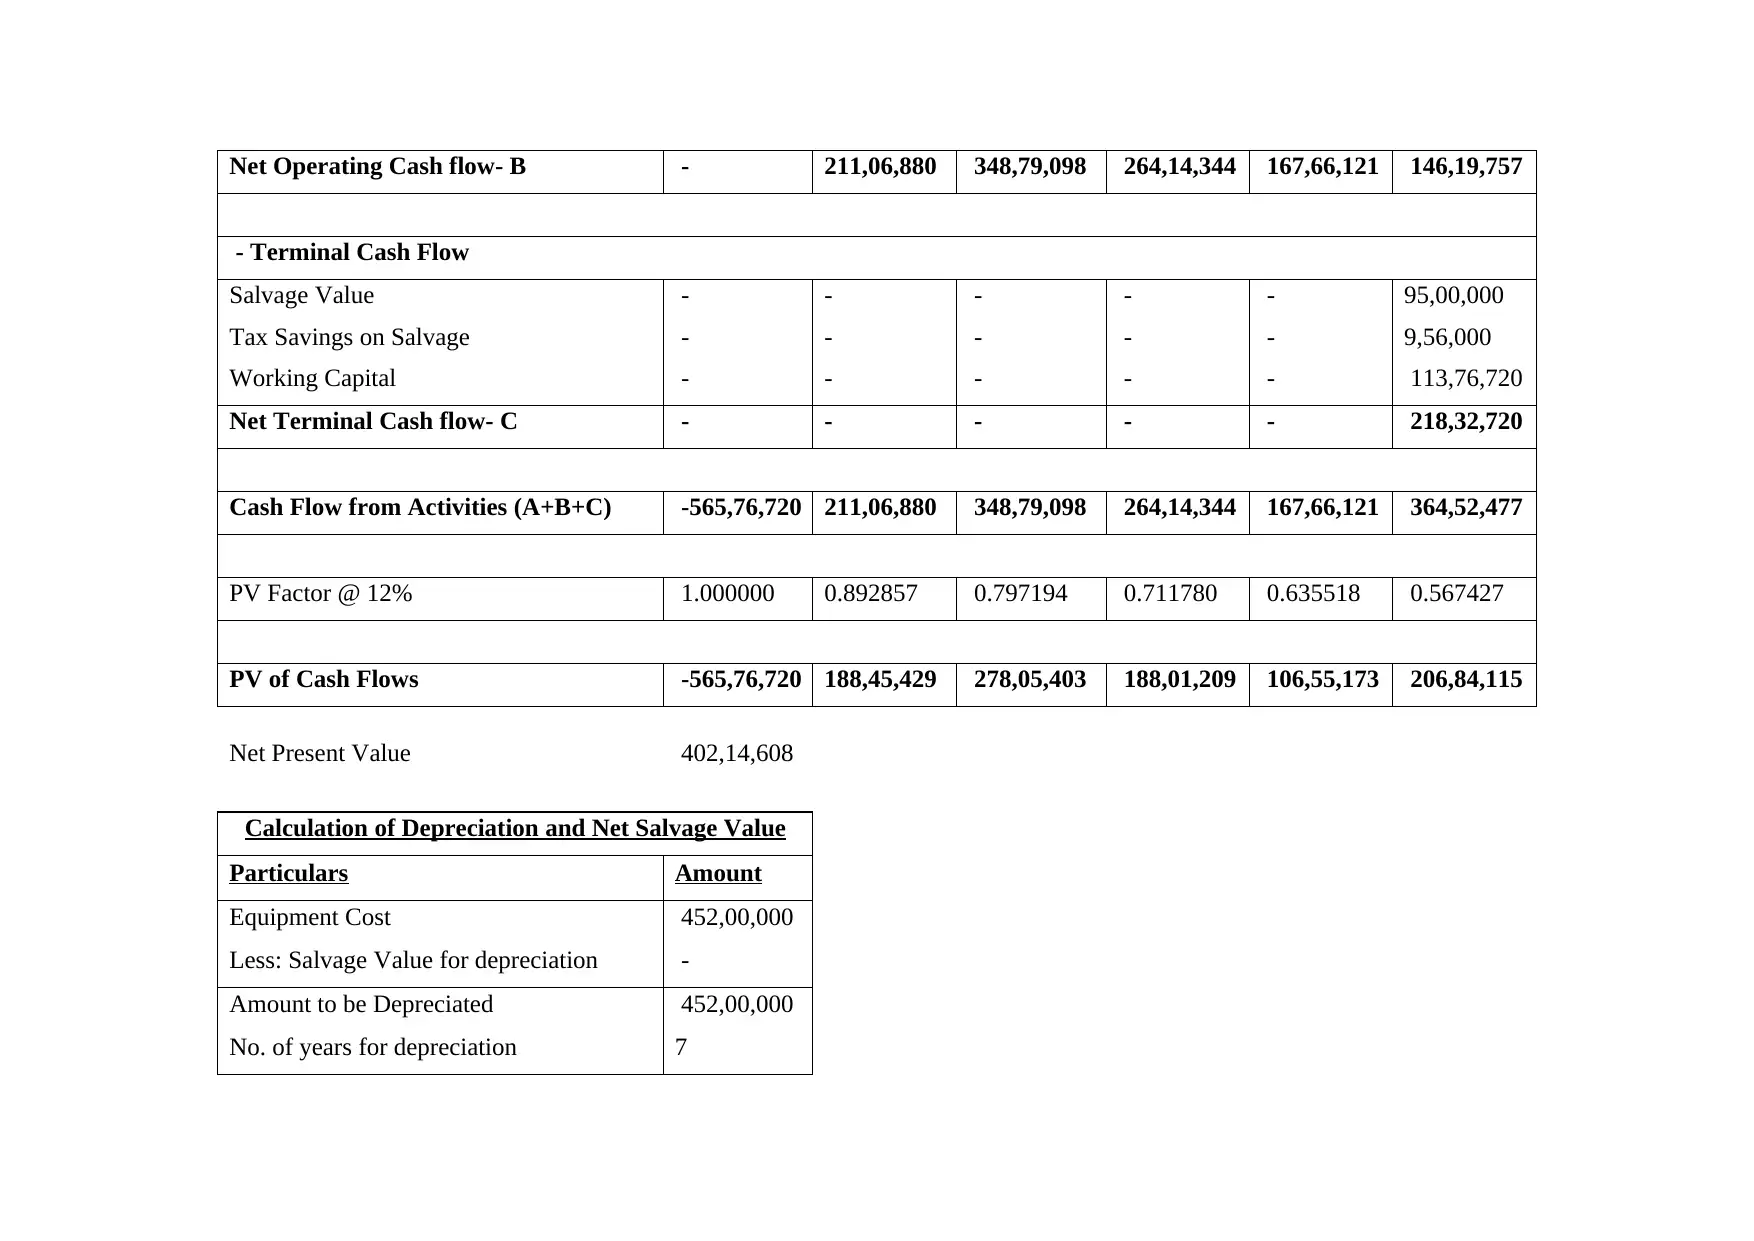
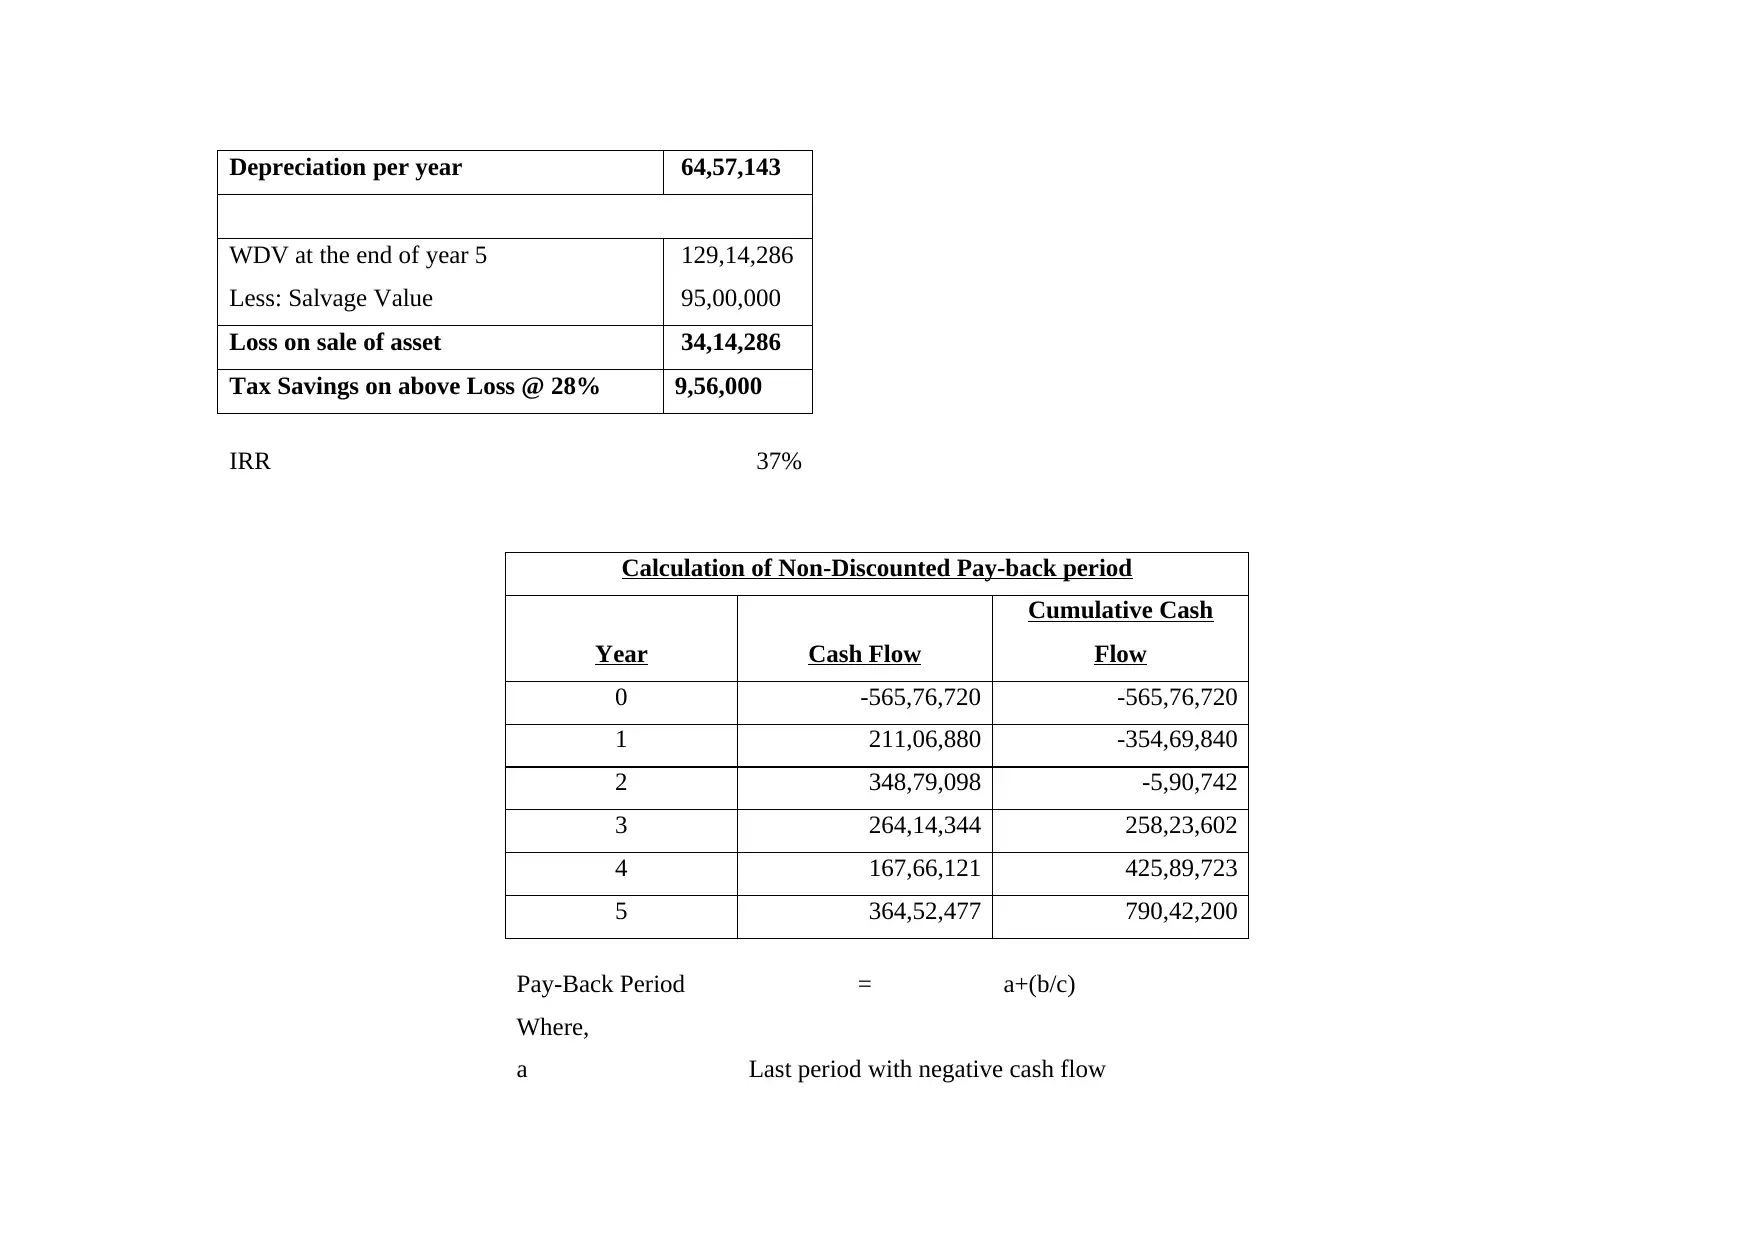
This report assesses the financial viability of a new project using capital budgeting techniques such as Net Present Value (NPV), Internal Rate of Return (IRR), payback period, and profitability index. The analysis indicates a positive NPV and an IRR exceeding the required rate of return, suggesting the project's financial feasibility. Sensitivity analysis is performed to evaluate the impact of changes in sales price and quantity on the project's NPV, revealing the project's sensitivity to these factors. The report also addresses the effect of potential loss of sales from other models due to the new project and concludes with a recommendation to accept the project based on its projected high returns. The calculations and analysis are based on provided financial data and standard capital budgeting principles.
Document Page
BUSINESS FINANCE
tabler-icon-diamond-filled.svg

Paraphrase This Document

Need a fresh take? Get an instant paraphrase of this document with our AI Paraphraser
Document Page
Contents
INTRODUCTION......................................................................................................................3
FINANCIAL VIABILITY OF THE PROJECT........................................................................4
Non discounted payback period.............................................................................................4
Profitability index...................................................................................................................4
Internal Rate of return............................................................................................................4
Net present value....................................................................................................................4
SENSITIVITY ANALYSIS.......................................................................................................5
Change in the sale price..........................................................................................................5
Changes in sales quantity.......................................................................................................5
EFFECT OF LOSS OF SALE OF OTHER MODELS DUE TO NEW PROJECT..................7
CONCLUSION AND RECOMMENDATION.........................................................................8
Bibliography...............................................................................................................................9
Document Page
INTRODUCTION
Every time a company receives a proposal for a new project, it evaluates the financial
impacts of the opportunity. In order to evaluate the financial variability of a new project,
capital budgeting is used as a tool. There are certain rules in used in the application of this
tool of cost accounting. It is an important and a widely used tool that can be undertaken by
keeping in mind certain important points.
Document Page
FINANCIAL VIABILITY OF THE PROJECT
Non discounted payback period
This technique helps the company to know the time that will be required to recover all the
cost that has been incurred in relation to the project. The amount that is received in after
recovering the cost is the profits earned by the company for this particular project. (Atkinson,
2012)
The pay back period in this project is 2.02 years whereas the project period is 5 years. This
means that the cost that was incurred by the company will be recovered within 2.02 years and
thereafter the company will start earning profits.
Profitability index
It helps to determine the inflow per dollar. In this case, the profitability index is 1.71 which is
an indication that shows that the company will earn $1.71 for each dollar spent. Since, the
earning exceeds the investment the project is said to be viable.
Internal Rate of return
The actual rate of return earned by the company can be known with the help of internal rate
of return. If the IRR exceeds the required return then the company must accept the proposal .
In the given case of Booli electronics, the IRR is 37% which is exceeding the reuired rate of
return. Therefore, the project should be accepted.
Net present value
Net present value can be defined as the present value of the cash inflows minus the present
value of the cash outflows. The project is accepted when the NPV is positive and rejected if
the NPV is negative. In the given case, the NPV is $40.2 million and therefore the project is
accepted.
tabler-icon-diamond-filled.svg

Paraphrase This Document

Need a fresh take? Get an instant paraphrase of this document with our AI Paraphraser
Document Page
SENSITIVITY ANALYSIS
Sensitivity analysis is a tool that is included in the capital budgeting process. It helps to know
the sensitivity of the net present value in relation to the cost. It helps to analyse the impact of
one independent variable on any dependent variable. The effect of any change in the price as
well as quantity is expressed in this project. (Berry, 2009)
Change in the sale price
In the given case, the selling price was increased by 1% which resulted in the increase of
4.35% NPV. It was seen that the NPV was $40.2 million initially but after the increment in
the selling price the NPV increased to $41.9 million. Therefore, we can see that the change in
selling price has an effect on the NPV.
The following were the observation on analysing the given case:
ï‚· When the selling price was increased by 1% , the IRR of the project increase by
2.67%.
ï‚· The increase in the selling price by 1% resulted in the decrease of payback period by
1.75%. Initially, the pay-back period was 2.02 years but then it decreased to 1.99
years.
ï‚· There was an increase in the profitability index by 1.77% when the selling price was
increased by 1%. There was a change in the profitability index from 1.71 to 1.74.
We can conclude that the change in the price of the product, the net present value is the most
sensitive to any changes.
Changes in sales quantity
A change in the quantity of sales by 1% resulted in an increase of NPV by 2.23%. As we
know, the NPV was $40.2 million initially but it increased to $41.1 million as an effect of the
change in the sales quantity. This indicated that a 1% change in the sales quantity will
increase the NPV by 2.23%.s
Let us now see the effects on other financial factors because of the change in quantity-
ï‚· 1 percent increase in the quantity of sales leads to an increment of IRR by 1.30%.
Initially, the IRR of the project was 37.47% but now it has increased to 36.99%.
Document Page
ï‚· 1 percent increase in the quantity of sales led to a decrease of pay-back period by
0.94%. Initially, the pay-back period was 2.02 years but after the change in sales it
decreased to 2 years.
ï‚· 1 percent change in quantity of sales led to an increase in the profitability index by
0.89%. Earlier the profitability index was 1.71 but now it is 1.73.
Therefore, we can say that the NPV is the most sensitive to the change in the quantity of
sales.
The decisions taken by capital budgeting is based on certain assumptions and estimates. In
order to forecast the cash flows many factors are taken into consideration. Such factors can be
financial or non financial. (Boyd, 2013) The economy and the circumstances are dynamic in
nature and therefore, there may be a change in the estimates also. However, sensitivity
analysis helps us to analyse the effects of such changes.
The rate of return that is used to compute the present value of the cash flows are also based
on many assumptions (Datar M. S., 2015). It is one of the most important thing in the process
of capital budgeting. All the economy and risk factor should be taken into consideration in
order to determine the discount rate. The assumptions made should not be unreal as it would
give wrong results which will have an adverse impact on the investors of the company. If the
assumptions are not made properly then the results derived from the process will be
unreliable. (Girard, 2014)
Document Page
EFFECT OF LOSS OF SALE OF OTHER MODELS DUE TO NEW PROJECT
There are many costs that are included while carrying out the capital budgeting process. Also
there are certain costs that should be excluded. This costs influence the decisions taken by the
investors. (Holtzman, 2013)
In the given case of Booli electronics, it is seen that the company has spent $ 1175000 for the
development of the proto type and it has also spent $650000 for carrying out market research.
However, these costs are not taken into consideration while performing the capital budgeting
process. These costs are considered as the sunk cost. They are irrelevant cost as it would not
have any impact on the acceptance or repentance decision of the project.
If a company has to let go another project because of the acceptance of this project then the
loses of other project has to be taken into consideration as they are relevant cost. This cost is
known as opportunity cost. These cost have an effect on the capital budgeting process and
therefore, it should be included. (Horngren, 2012)
tabler-icon-diamond-filled.svg

Paraphrase This Document

Need a fresh take? Get an instant paraphrase of this document with our AI Paraphraser
Document Page
CONCLUSION AND RECOMMENDATION
In the calculations performed, a proper analysis of the future cash flows is carried out for the
new project. There are certain factors that are calculated using the capital budgeting process
such as profitability index, pay-back period, IRR as well as NPV. It has been observed that
the NPV of the project is positive which is favourable. Also, the IRR exceeds the required
rate of return. The company will recover all the cost incurred within 2 years.
Hence, we can draw a conclusion that the project should be accepted a s it will generate high
returns in the future.
Document Page
Bibliography
Atkinson, A. A. (2012). Management accounting. Upper Saddle River, N.J.: Paerson.
Berry, L. E. (2009). Management accounting demystified. New York: McGraw-Hill.
Boyd, W. K. (2013). Cost Accounting For Dummies. Hoboken: Wiley.
Datar, M. S. (2015). Cost accounting. Boston: Pearson.
Datar, S. (2016). Horngren's Cost Accounting: A Managerial Emphasis. Hoboken: Wiley.
Girard, S. L. (2014). Business finance basics. Pompton Plains, NJ: Career Press.
Holtzman, M. (2013). Managerial Accounting For Dummies. Hoboken, NJ: Wiley.
Horngren, C. (2012). Cost accounting. Upper Saddle River, N.J.: Pearson/Prentice Hall.
Document Page
Appendix:
Calculation of Net Present Value and Internal Rate of return
Particulars 0 1 2 3 4 5
Units for sale 92,000 1,42,000 1,08,000 71,000 62,000
- Initial Cash Flow
Equipment Cost -452,00,000
Working Capital -113,76,720
Net Initial Cash flow- A -565,76,720 - - - - -
- Operating Cash Flows
Sales Price per unit - 632,04,000 995,05,080 771,93,518 517,62,543 461,05,115
Less: Variable cost per unit - -299,00,000 -470,73,000
-
365,18,040 -244,87,375 -218,11,008
Less: Fixed Cost - -65,00,000 -65,00,000 -65,00,000 -65,00,000 -65,00,000
Less: Depreciation - -64,57,143 -64,57,143 -64,57,143 -64,57,143 -64,57,143
Profit Before Tax - 203,46,857 394,74,937 277,18,336 143,18,025 113,36,965
Less : Tax @ 28% - -56,97,120 -110,52,982 -77,61,134 -40,09,047 -31,74,350
Profit after tax - 146,49,737 284,21,955 199,57,202 103,08,978 81,62,614
Cash flow after tax (PAT +
Depreciation) - 211,06,880 348,79,098 264,14,344 167,66,121 146,19,757
tabler-icon-diamond-filled.svg

Paraphrase This Document

Need a fresh take? Get an instant paraphrase of this document with our AI Paraphraser
Document Page
Net Operating Cash flow- B - 211,06,880 348,79,098 264,14,344 167,66,121 146,19,757
- Terminal Cash Flow
Salvage Value - - - - - 95,00,000
Tax Savings on Salvage - - - - - 9,56,000
Working Capital - - - - - 113,76,720
Net Terminal Cash flow- C - - - - - 218,32,720
Cash Flow from Activities (A+B+C) -565,76,720 211,06,880 348,79,098 264,14,344 167,66,121 364,52,477
PV Factor @ 12% 1.000000 0.892857 0.797194 0.711780 0.635518 0.567427
PV of Cash Flows -565,76,720 188,45,429 278,05,403 188,01,209 106,55,173 206,84,115
Net Present Value 402,14,608
Calculation of Depreciation and Net Salvage Value
Particulars Amount
Equipment Cost 452,00,000
Less: Salvage Value for depreciation -
Amount to be Depreciated 452,00,000
No. of years for depreciation 7
Document Page
Depreciation per year 64,57,143
WDV at the end of year 5 129,14,286
Less: Salvage Value 95,00,000
Loss on sale of asset 34,14,286
Tax Savings on above Loss @ 28% 9,56,000
IRR 37%
Calculation of Non-Discounted Pay-back period
Year Cash Flow
Cumulative Cash
Flow
0 -565,76,720 -565,76,720
1 211,06,880 -354,69,840
2 348,79,098 -5,90,742
3 264,14,344 258,23,602
4 167,66,121 425,89,723
5 364,52,477 790,42,200
Pay-Back Period = a+(b/c)
Where,
a Last period with negative cash flow
chevron_up_icon
1 out of 25
circle_padding
hide_on_mobile
zoom_out_icon
[object Object]