Financial Analysis Report: Beacon Lighting Group Limited, ACC701, 2019
VerifiedAdded on 2022/11/07
|20
|4806
|74
Report
AI Summary
This report provides a detailed financial analysis of Beacon Lighting Group Limited, an Australian lighting retailer, focusing on its performance over the past five years. The analysis includes common size statement analysis, trend analysis of income statements, balance sheets, and equity, and a comprehensive ratio analysis covering profitability, asset efficiency, liquidity, and capital structure. The study reveals changes in revenue, expenses, assets, liabilities, and equity, driven by market demands. The report concludes with recommendations for management to improve financial elements, control operating expenses, and suggests investment potential for both short and long term. The analysis uses financial statements and graphs to illustrate the company's financial position, highlighting its strengths and areas for potential improvement, ultimately providing insights into its overall financial health and investment viability. The report also examines profitability and efficiency ratios.
Running Head: Accounting for managers 1
Project Report: Accounting for managers
Project Report: Accounting for managers
Paraphrase This Document
Need a fresh take? Get an instant paraphrase of this document with our AI Paraphraser
Accounting for managers 2
Executive summary
The accounting for manager’s report has been prepared over BEACON LIGHTING
GROUP LIMITED. In the report, Common size statement analysis and trend analysis study
has been done to measure the performance of the company in last 5 years. Along with that, a
ratio analysis study has also been done to identify whether the key financial position of the
business is good or not. It is an Australian organization which was found in the year of 1967.
This is the largest specialist retailer of lights in Australian market. The study represents that
the various elements of total revenue, expenses, assets, liabilities and equity have been
changed in last 5 years due to the changes in requirement of the organization and market
demand. The study has been done over the financial statement of last 5 years and it has been
found that overall financial position of the organization is strong and the company is a good
choice for the purpose of investment.
Overall, the study represents that in the last 5 year financial statement of the company,
various changes have been seen. The report explains that it is required for the management of
the organization to make few changes into the financial element of the business in order to
improve the overall performance of the organization so that the overall position of the
company could be strong. Such as, the operating expenses could be controlled by the business
to improve the profitable position of the company. Overall, investors could invest in the
company for long term as well as short term to enhance the return position.
Accounting for managers 3
Contents
Introduction.......................................................................................................................4
Company overview...........................................................................................................4
Analysis over common size financial statement...............................................................4
Trend analysis...................................................................................................................5
Ratio analysis....................................................................................................................9
Conclusion......................................................................................................................12
Recommendation............................................................................................................12
References.......................................................................................................................14
Appendix.........................................................................................................................15
⊘ This is a preview!⊘
Do you want full access?
Subscribe today to unlock all pages.
Trusted by 1+ million students worldwide
Accounting for managers 4
Introduction:
Financial analysis is a technique of accounting which is used to calculate the changes
and performance of a business over a period of time. Financial analysis study makes it easier
for the companies and all the stakeholders of the company to identify and calculate the
financial performance of the company and recent changes in the organization so that they
could reach over a better conclusion and a proper strategy could be created for near future.
This report focuses over the BEACON LIGHTING GROUP LIMITED. The company has
been targeted to understand the concept of financial analysis and their application over an
organization. Common size statement analysis and trend analysis study has been done in the
report to measure the performance of the company in last 5 years. Along with that, a ratio
analysis study has also been done to identify whether the key financial position of the
business is good or not. Overall, the report would give a brief idea about the investment
position in BEACON LIGHTING GROUP LIMITED.
Company overview:
BEACON LIGHTING GROUP LIMITED is an Australian organization which
operates in lighting industry of the country. The company has been established in the year of
1967. Since 1967, the company has become the largest specialist retailer of light globes,
lighting, ceiling fans along with a wide range of services, advices and the knowledge. The
company offers a great range of products, exclusive range of lights, encompasses both design
and fashion elements along with the latest technology for energy efficient. The main target
market for the business is middle to upper class families, corporate and hotel industry which
has approximately a network of 110 stores (About us, 2019). Also, currently 100 stores are
operated in the state along with 4 franchise store in overall Australian market.
Financial statement of the company has been studied and found that various changes
have taken place in the company in last few years. Currently, the market cap of the business
is $ 218 million. Current stock price of the company is $ 0.995. A good price movement has
been found in the stock price in last few months in the organization.
Analysis over common size financial statement:
Common size financial statement is the financial statement of the business which
describes about the financial assets, liabilities, revenue, expenditures, cash position etc of the
business in particular period and then compares it with another period to identify the changes
Paraphrase This Document
Need a fresh take? Get an instant paraphrase of this document with our AI Paraphraser
Accounting for managers 5
occurred into the organization. Basically, there are 2 methods to evaluate the financial
statement of an organization which are horizontal analysis and vertical analysis. Horizontal
analysis takes the concern of 2 or more than 2 financial year statement to identify the changes
which have taken place in a period. It helps the management to identify the total growth
enjoyed by the company along with the reasons behind these changes. In this method, a year
is selected as base year and other years performance is compared on the basis of the base year
(Reilly and Brown, 2011).
Further, the vertical analysis is also a part of common size financial statement
analysis. In this method, the information of one year is collected and the performance of each
sales element is calculated to identify their share in the total revenue and the total expenditure
of the business. These help the business to identify the proportion of each element so that
additional expenses could be eliminated from the business (Phillips and Stawarski, 2016).
Trend analysis of BEACON LIGHTING GROUP LIMITED has been studied below:
Trend analysis:
Trend analysis study makes it simple for the business to identify those elements and
expenses which could be eliminated from the business to maintain the profit and improve the
financial position and performance of the business. In this report, the income statement and
balance sheet of the company has been studied. Below is the interpretation of the same:
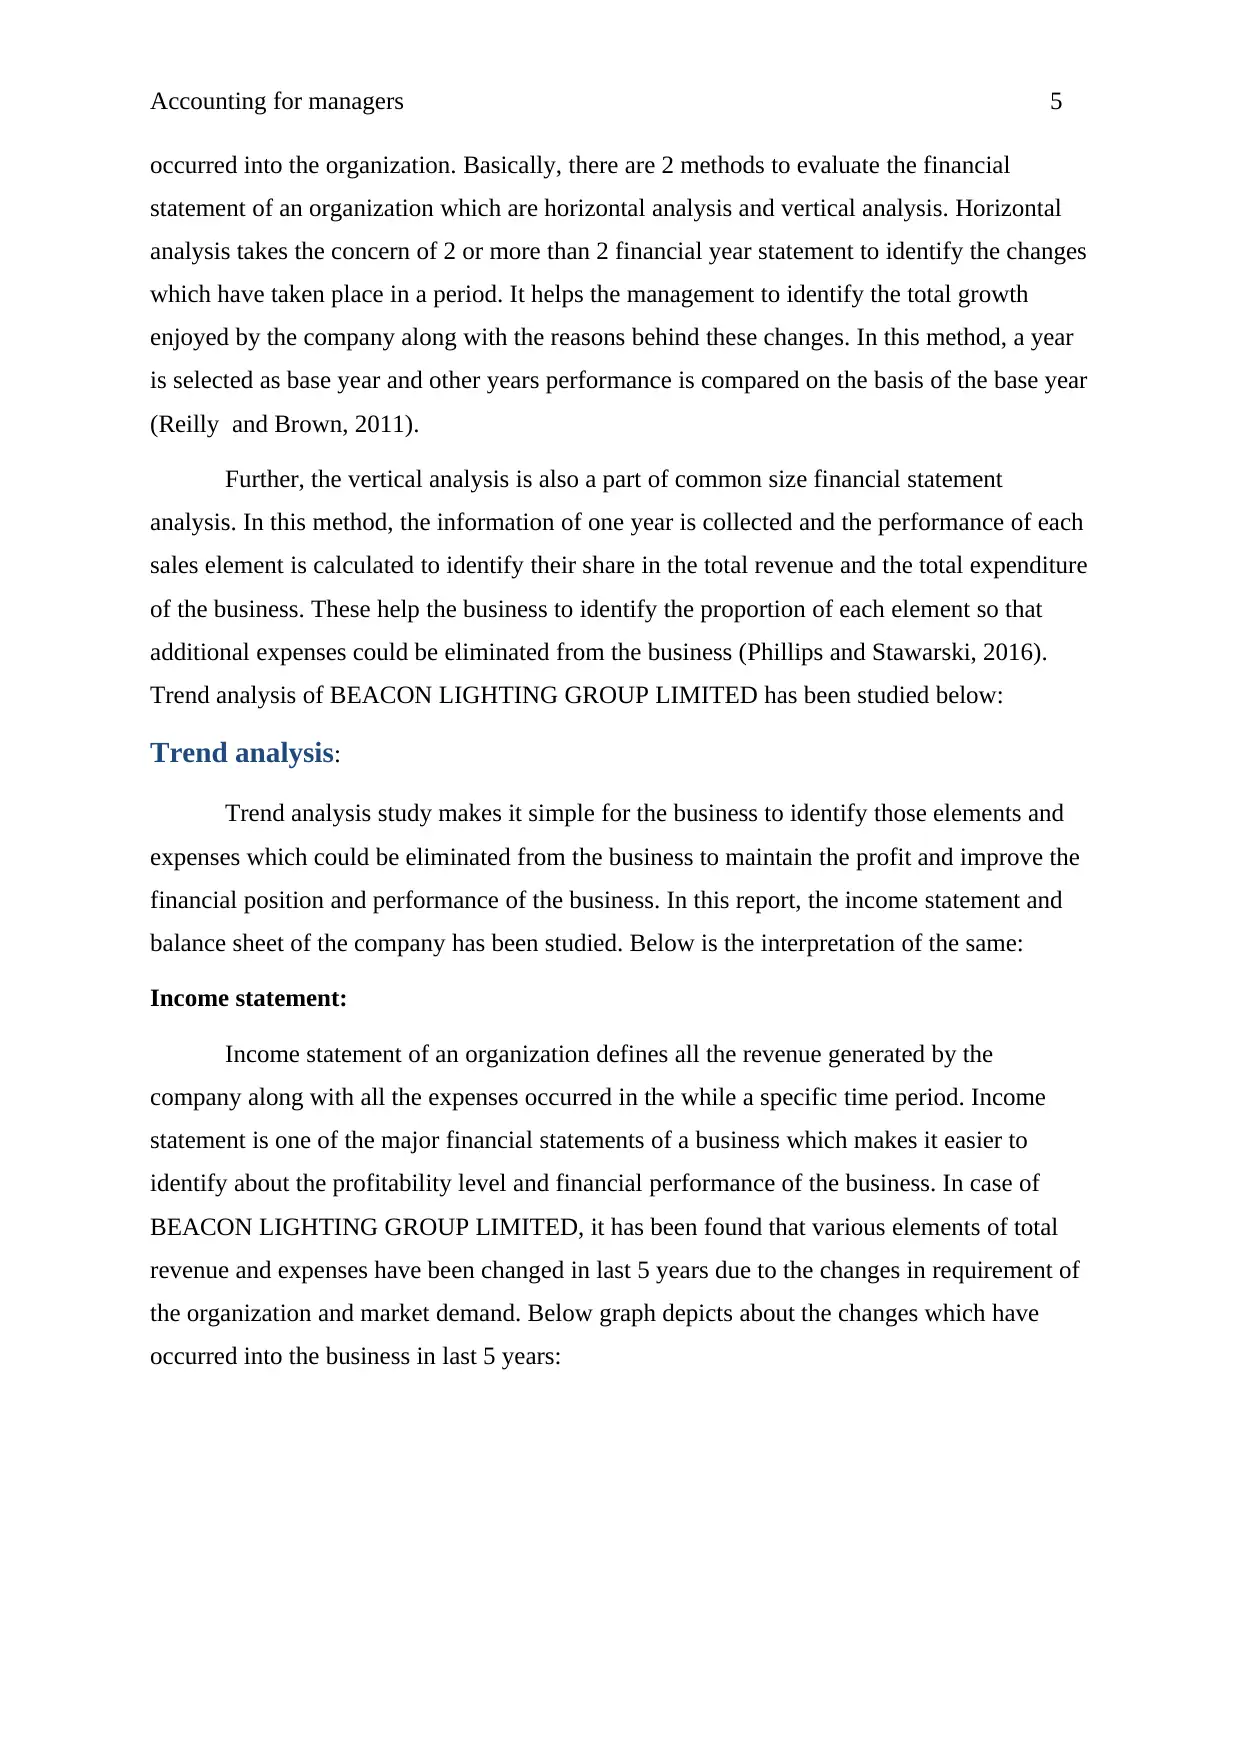
Income statement:
Income statement of an organization defines all the revenue generated by the
company along with all the expenses occurred in the while a specific time period. Income
statement is one of the major financial statements of a business which makes it easier to
identify about the profitability level and financial performance of the business. In case of
BEACON LIGHTING GROUP LIMITED, it has been found that various elements of total
revenue and expenses have been changed in last 5 years due to the changes in requirement of
the organization and market demand. Below graph depicts about the changes which have
occurred into the business in last 5 years:
occurred into the organization. Basically, there are 2 methods to evaluate the financial
statement of an organization which are horizontal analysis and vertical analysis. Horizontal
analysis takes the concern of 2 or more than 2 financial year statement to identify the changes
which have taken place in a period. It helps the management to identify the total growth
enjoyed by the company along with the reasons behind these changes. In this method, a year
is selected as base year and other years performance is compared on the basis of the base year
(Reilly and Brown, 2011).
Further, the vertical analysis is also a part of common size financial statement
analysis. In this method, the information of one year is collected and the performance of each
sales element is calculated to identify their share in the total revenue and the total expenditure
of the business. These help the business to identify the proportion of each element so that
additional expenses could be eliminated from the business (Phillips and Stawarski, 2016).
Trend analysis of BEACON LIGHTING GROUP LIMITED has been studied below:
Trend analysis:
Trend analysis study makes it simple for the business to identify those elements and
expenses which could be eliminated from the business to maintain the profit and improve the
financial position and performance of the business. In this report, the income statement and
balance sheet of the company has been studied. Below is the interpretation of the same:
Income statement:
Income statement of an organization defines all the revenue generated by the
company along with all the expenses occurred in the while a specific time period. Income
statement is one of the major financial statements of a business which makes it easier to
identify about the profitability level and financial performance of the business. In case of
BEACON LIGHTING GROUP LIMITED, it has been found that various elements of total
revenue and expenses have been changed in last 5 years due to the changes in requirement of
the organization and market demand. Below graph depicts about the changes which have
occurred into the business in last 5 years:
Accounting for managers 6
2018
(AUD) 2017
(AUD) 2016
(AUD) 2015
(AUD) 2014
(AUD)
-60.00%
-40.00%
-20.00%
0.00%
20.00%
40.00%
60.00%
80.00%
100.00%
120.00%
Revenue from continuing
operations ($000s)
Cost of sales ($000s)
Gross profit ($000s)
Other income ($000s)
Administrative expenses
($000s)
Finance costs ($000s)
Income tax expense
($000s)
Net profit for the period
($000s)
BEACON LIGHTING GROUP LIMITED
Figure 1: Trend analysis over income statement
(Morningstar, 2019)
The graph depicts that almost all the expenses of the business was similar in the last 5
years. No major alterations have occurred into the business which describes that company is
quite efficient to manage the consistency and performance of the business.
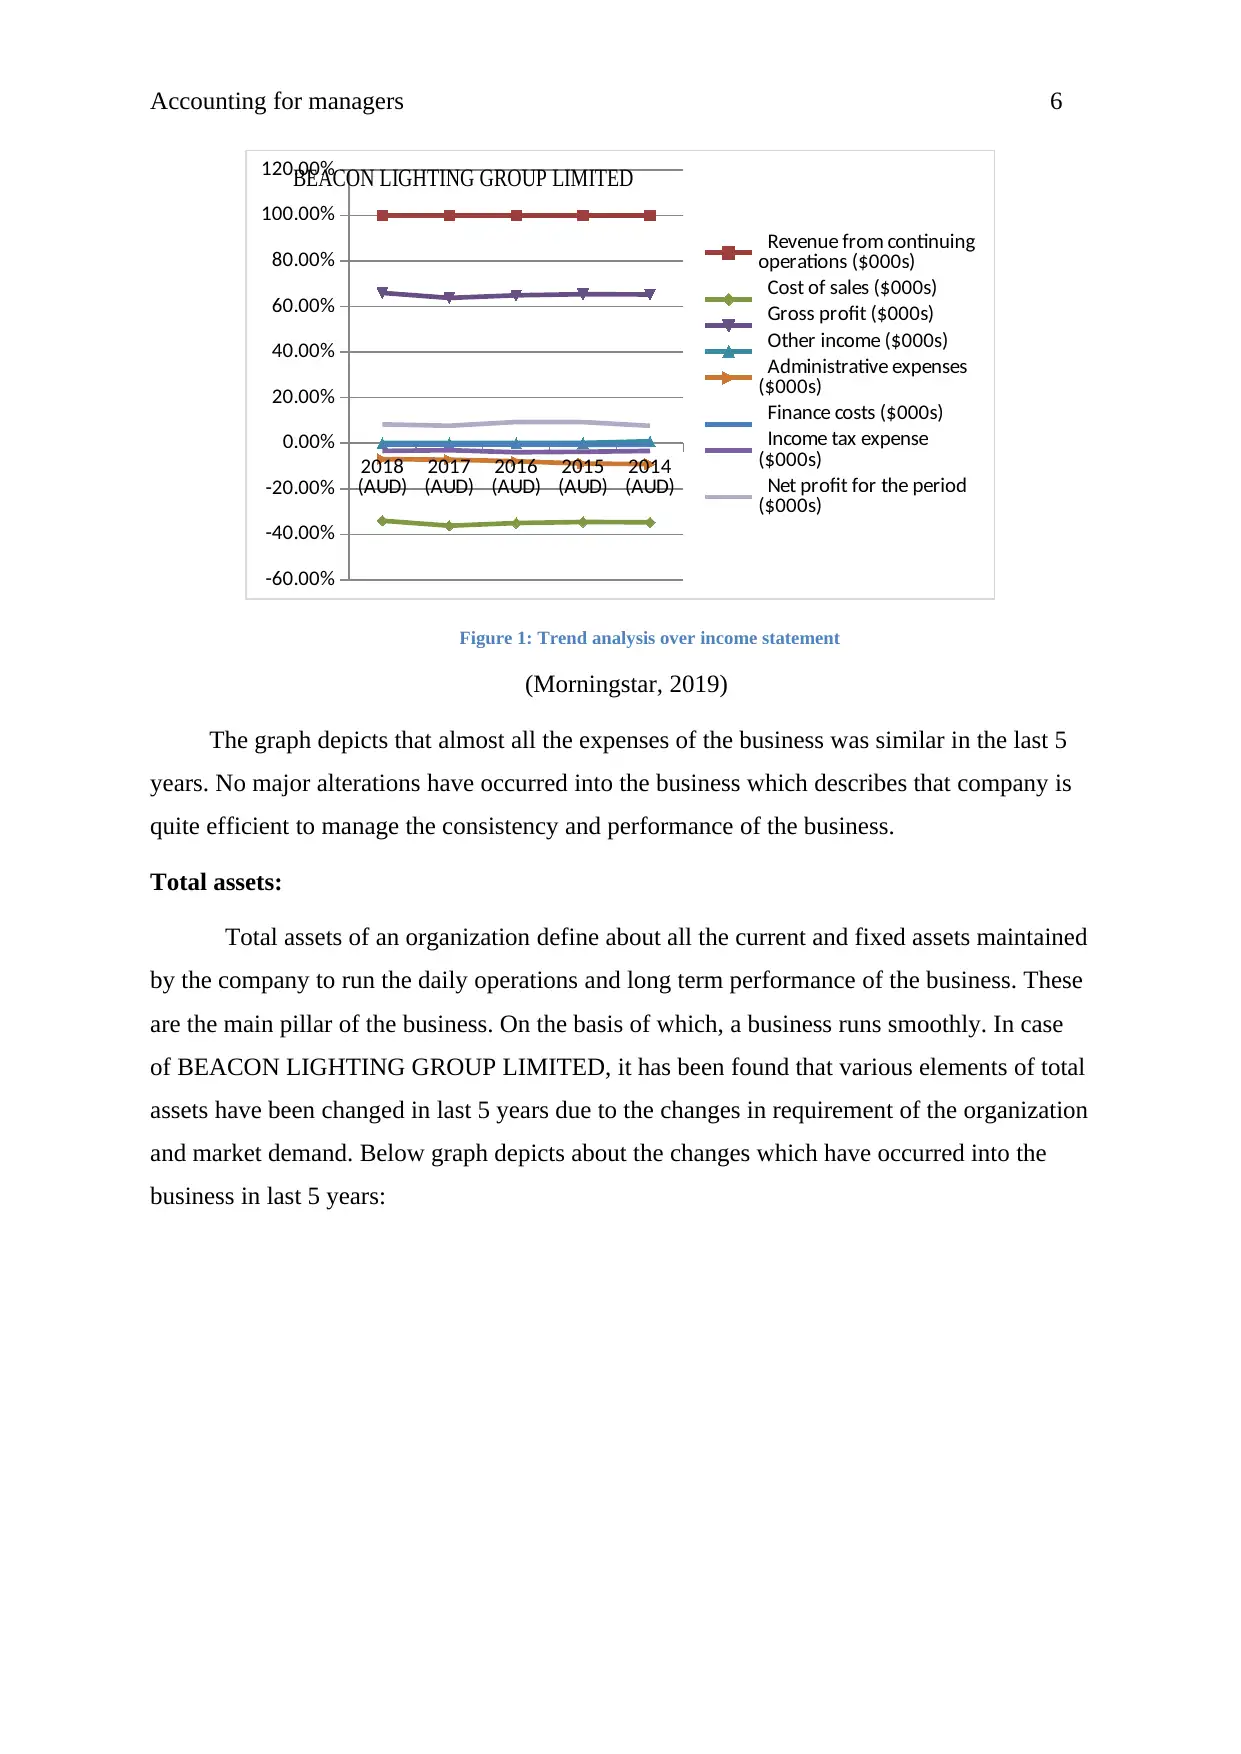
Total assets:
Total assets of an organization define about all the current and fixed assets maintained
by the company to run the daily operations and long term performance of the business. These
are the main pillar of the business. On the basis of which, a business runs smoothly. In case
of BEACON LIGHTING GROUP LIMITED, it has been found that various elements of total
assets have been changed in last 5 years due to the changes in requirement of the organization
and market demand. Below graph depicts about the changes which have occurred into the
business in last 5 years:
2018
(AUD) 2017
(AUD) 2016
(AUD) 2015
(AUD) 2014
(AUD)
-60.00%
-40.00%
-20.00%
0.00%
20.00%
40.00%
60.00%
80.00%
100.00%
120.00%
Revenue from continuing
operations ($000s)
Cost of sales ($000s)
Gross profit ($000s)
Other income ($000s)
Administrative expenses
($000s)
Finance costs ($000s)
Income tax expense
($000s)
Net profit for the period
($000s)
BEACON LIGHTING GROUP LIMITED
Figure 1: Trend analysis over income statement
(Morningstar, 2019)
The graph depicts that almost all the expenses of the business was similar in the last 5
years. No major alterations have occurred into the business which describes that company is
quite efficient to manage the consistency and performance of the business.
Total assets:
Total assets of an organization define about all the current and fixed assets maintained
by the company to run the daily operations and long term performance of the business. These
are the main pillar of the business. On the basis of which, a business runs smoothly. In case
of BEACON LIGHTING GROUP LIMITED, it has been found that various elements of total
assets have been changed in last 5 years due to the changes in requirement of the organization
and market demand. Below graph depicts about the changes which have occurred into the
business in last 5 years:
⊘ This is a preview!⊘
Do you want full access?
Subscribe today to unlock all pages.
Trusted by 1+ million students worldwide
Accounting for managers 7
2018
(AUD) 2017
(AUD) 2016
(AUD) 2015
(AUD) 2014
(AUD)
0
0.1
0.2
0.3
0.4
0.5
0.6
Current Assets
Cash and cash
equivalents ($000s)
Trade receivables
($000s)
Other receivables
($000s)
Total inventories
($000s)
Prepayments ($000s)
Other current assets
($000s)
Figure 2: Total assets (trend analysis)
(Morningstar, 2019)
The above graph explains that various alterations have occurred into the current assts
and noncurrent assets of the business. The overall changes have been done by the business to
meet the expectation of the market and stakeholders of the business.
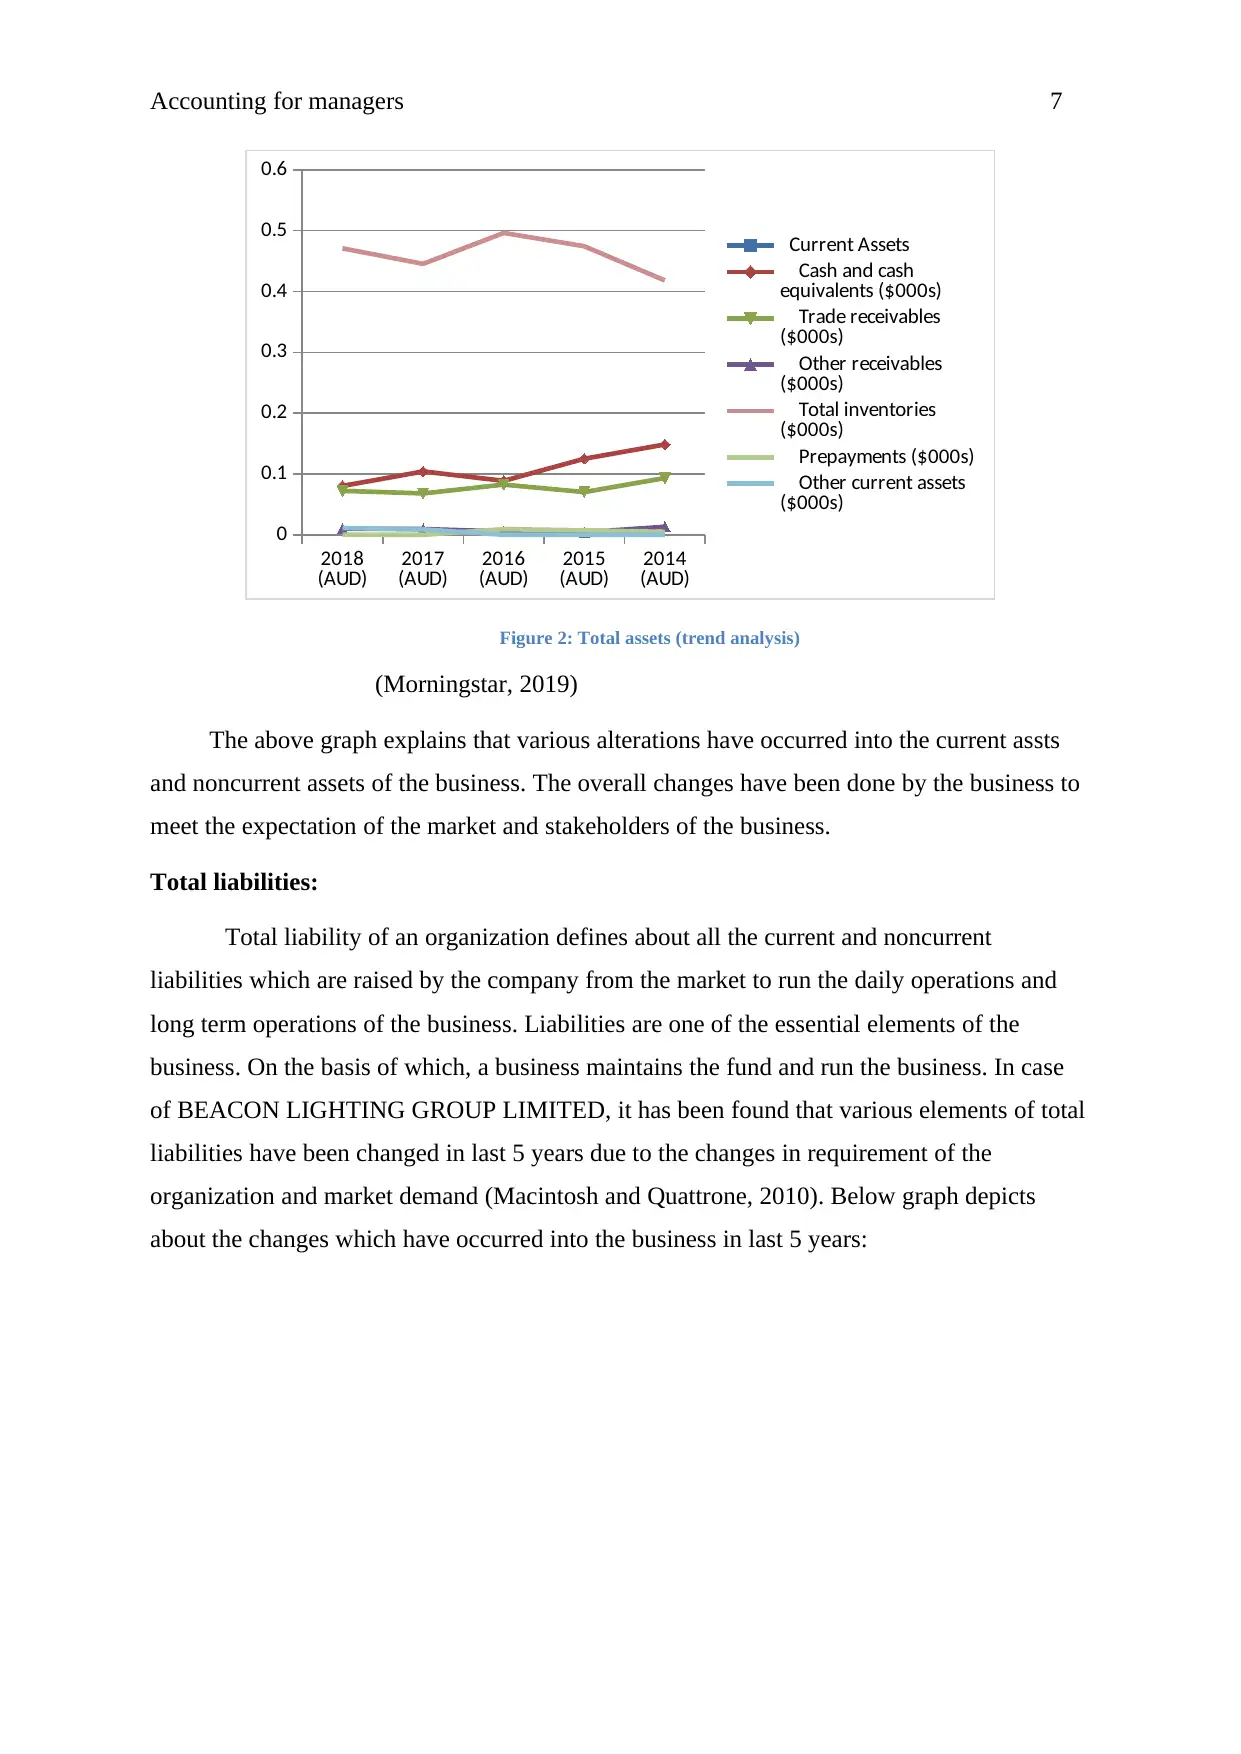
Total liabilities:
Total liability of an organization defines about all the current and noncurrent
liabilities which are raised by the company from the market to run the daily operations and
long term operations of the business. Liabilities are one of the essential elements of the
business. On the basis of which, a business maintains the fund and run the business. In case
of BEACON LIGHTING GROUP LIMITED, it has been found that various elements of total
liabilities have been changed in last 5 years due to the changes in requirement of the
organization and market demand (Macintosh and Quattrone, 2010). Below graph depicts
about the changes which have occurred into the business in last 5 years:
2018
(AUD) 2017
(AUD) 2016
(AUD) 2015
(AUD) 2014
(AUD)
0
0.1
0.2
0.3
0.4
0.5
0.6
Current Assets
Cash and cash
equivalents ($000s)
Trade receivables
($000s)
Other receivables
($000s)
Total inventories
($000s)
Prepayments ($000s)
Other current assets
($000s)
Figure 2: Total assets (trend analysis)
(Morningstar, 2019)
The above graph explains that various alterations have occurred into the current assts
and noncurrent assets of the business. The overall changes have been done by the business to
meet the expectation of the market and stakeholders of the business.
Total liabilities:
Total liability of an organization defines about all the current and noncurrent
liabilities which are raised by the company from the market to run the daily operations and
long term operations of the business. Liabilities are one of the essential elements of the
business. On the basis of which, a business maintains the fund and run the business. In case
of BEACON LIGHTING GROUP LIMITED, it has been found that various elements of total
liabilities have been changed in last 5 years due to the changes in requirement of the
organization and market demand (Macintosh and Quattrone, 2010). Below graph depicts
about the changes which have occurred into the business in last 5 years:
Paraphrase This Document
Need a fresh take? Get an instant paraphrase of this document with our AI Paraphraser
Accounting for managers 8
Current liabilities Trade payables ($000s) Other payables ($000s)
Loans - secured ($000s) Loans - unsecured
($000s) Obligations under
finance leases and hire
purchase ($000s)
Loans from related
parties ($000s) Total current interest-
bearing loans and
borrowings ($000s)
Income tax
payable/(refundable)
($000s)
Provisions ($000s) Derivative financial
instruments ($000s) Other current liabilities
($000s)
Total current liabilities
for continuing operations
($000s)
Liabilities directly
associated with assets held
for sale ($000s)
Total current liabilities
($000s)
Total current liabilities
for previous year ($000s)
Figure 3: Total liabilities (trend analysis)
(Yahoo finance, 2019)
The above graph explains that various changes have occurred into the current
liabilities and noncurrent liabilities of the business. The overall changes have been done by
the business to meet the expectation of the market and stakeholders of the business. Overall
changes depict about better performance and financial position of the business.
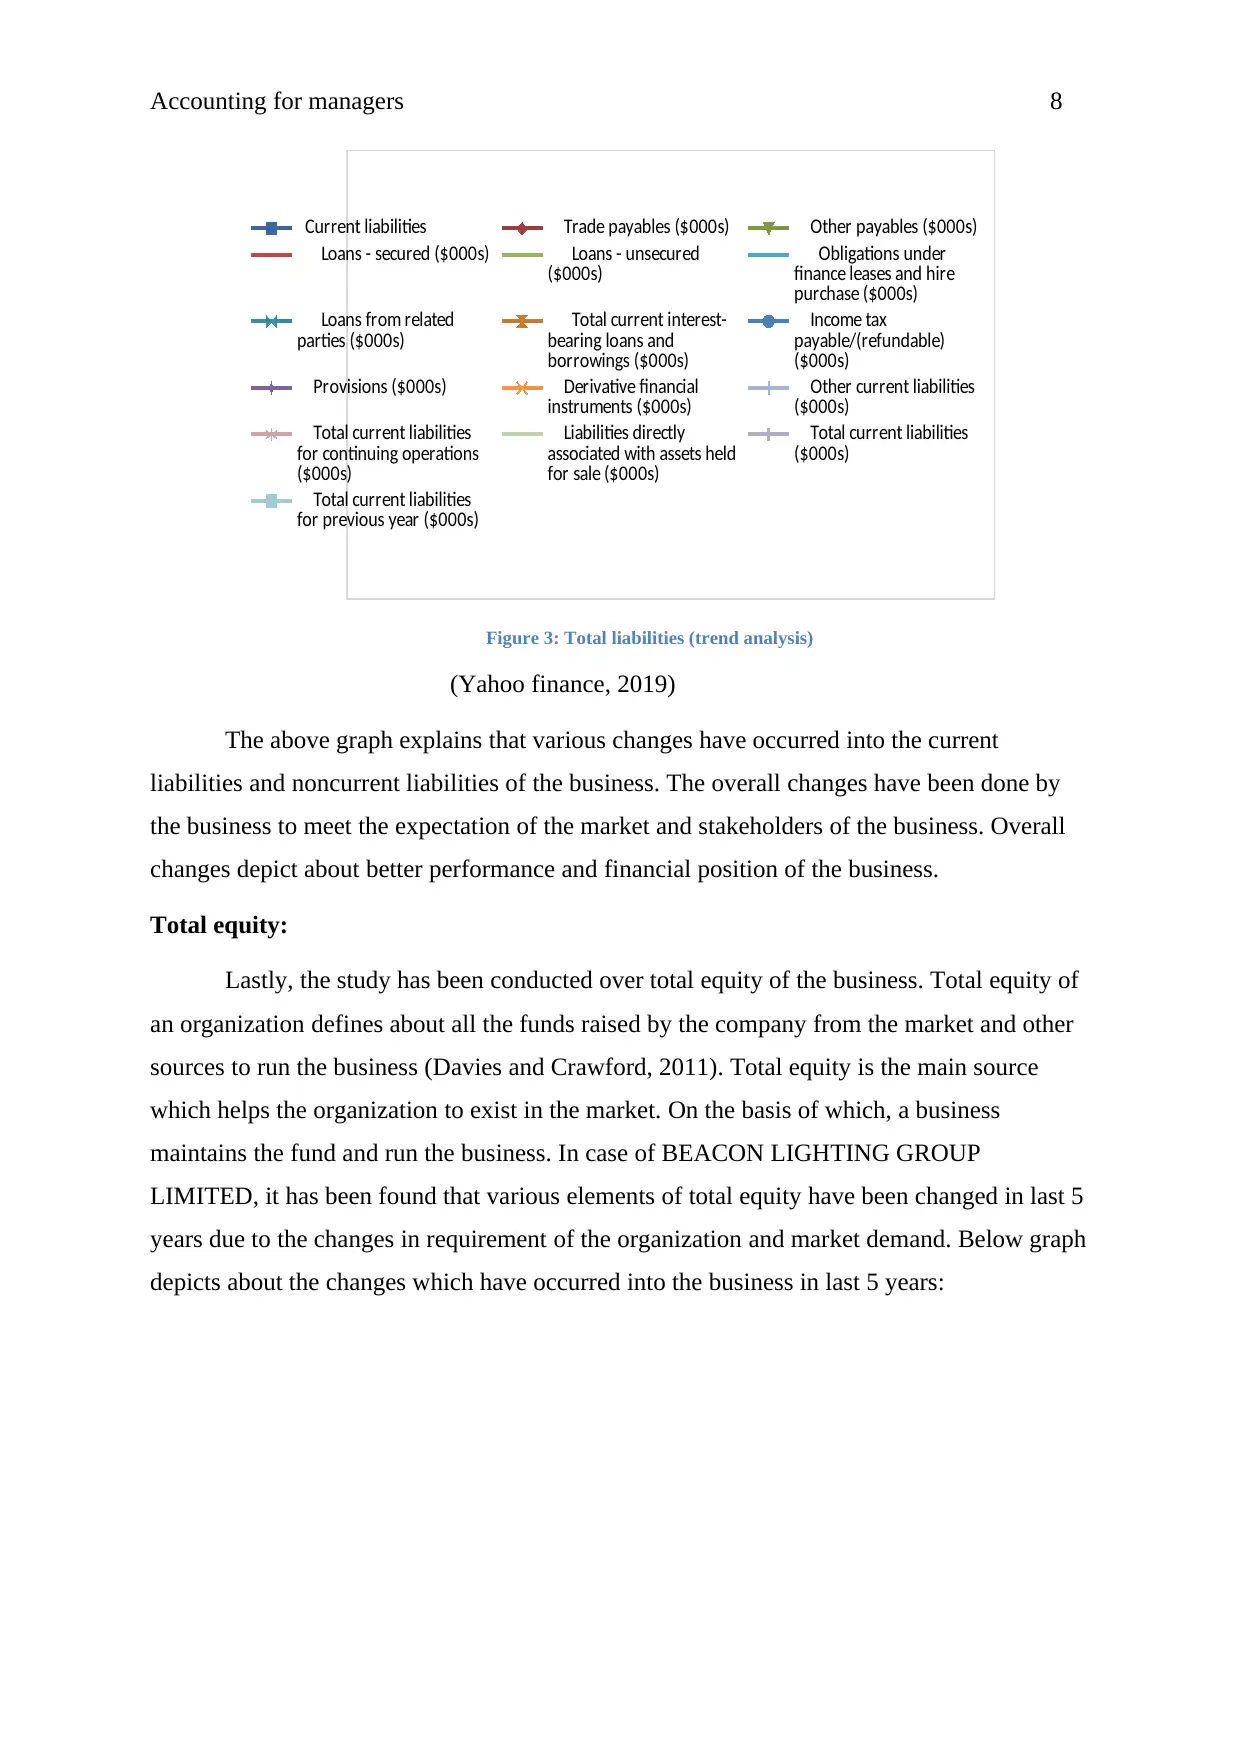
Total equity:
Lastly, the study has been conducted over total equity of the business. Total equity of
an organization defines about all the funds raised by the company from the market and other
sources to run the business (Davies and Crawford, 2011). Total equity is the main source
which helps the organization to exist in the market. On the basis of which, a business
maintains the fund and run the business. In case of BEACON LIGHTING GROUP
LIMITED, it has been found that various elements of total equity have been changed in last 5
years due to the changes in requirement of the organization and market demand. Below graph
depicts about the changes which have occurred into the business in last 5 years:
Current liabilities Trade payables ($000s) Other payables ($000s)
Loans - secured ($000s) Loans - unsecured
($000s) Obligations under
finance leases and hire
purchase ($000s)
Loans from related
parties ($000s) Total current interest-
bearing loans and
borrowings ($000s)
Income tax
payable/(refundable)
($000s)
Provisions ($000s) Derivative financial
instruments ($000s) Other current liabilities
($000s)
Total current liabilities
for continuing operations
($000s)
Liabilities directly
associated with assets held
for sale ($000s)
Total current liabilities
($000s)
Total current liabilities
for previous year ($000s)
Figure 3: Total liabilities (trend analysis)
(Yahoo finance, 2019)
The above graph explains that various changes have occurred into the current
liabilities and noncurrent liabilities of the business. The overall changes have been done by
the business to meet the expectation of the market and stakeholders of the business. Overall
changes depict about better performance and financial position of the business.
Total equity:
Lastly, the study has been conducted over total equity of the business. Total equity of
an organization defines about all the funds raised by the company from the market and other
sources to run the business (Davies and Crawford, 2011). Total equity is the main source
which helps the organization to exist in the market. On the basis of which, a business
maintains the fund and run the business. In case of BEACON LIGHTING GROUP
LIMITED, it has been found that various elements of total equity have been changed in last 5
years due to the changes in requirement of the organization and market demand. Below graph
depicts about the changes which have occurred into the business in last 5 years:
Accounting for managers 9
2018
(AUD) 2017
(AUD) 2016
(AUD) 2015
(AUD) 2014
(AUD)
-150.00%
-100.00%
-50.00%
0.00%
50.00%
100.00%
150.00%
200.00%
Contributed equity
($000s)
Retained earnings
($000s)
Reserves ($000s)
Total Parent interests
($000s)
Minority interests
($000s)
TOTAL EQUITY ($000s)
TOTAL EQUITY FOR
PREVIOUS YEAR ($000s)
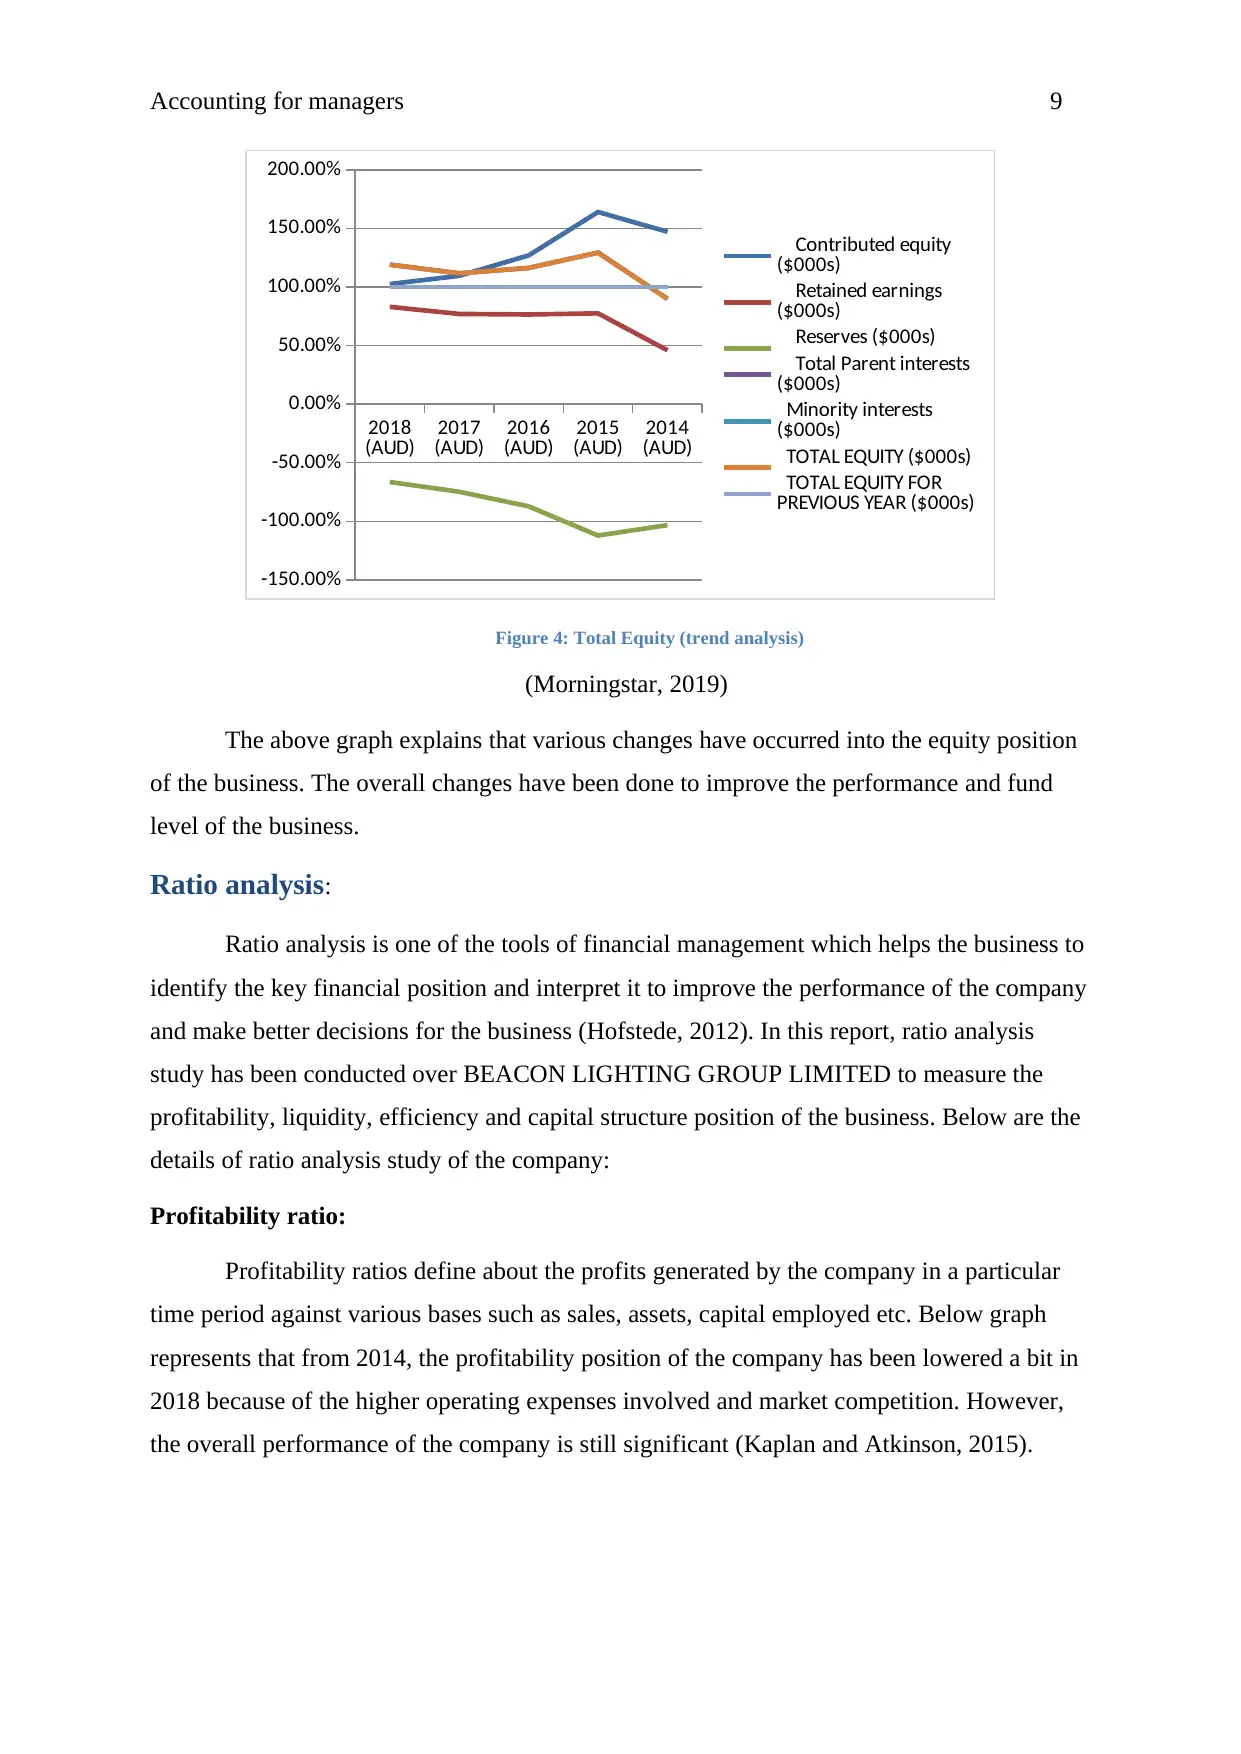
Figure 4: Total Equity (trend analysis)
(Morningstar, 2019)
The above graph explains that various changes have occurred into the equity position
of the business. The overall changes have been done to improve the performance and fund
level of the business.
Ratio analysis:
Ratio analysis is one of the tools of financial management which helps the business to
identify the key financial position and interpret it to improve the performance of the company
and make better decisions for the business (Hofstede, 2012). In this report, ratio analysis
study has been conducted over BEACON LIGHTING GROUP LIMITED to measure the
profitability, liquidity, efficiency and capital structure position of the business. Below are the
details of ratio analysis study of the company:
Profitability ratio:
Profitability ratios define about the profits generated by the company in a particular
time period against various bases such as sales, assets, capital employed etc. Below graph
represents that from 2014, the profitability position of the company has been lowered a bit in
2018 because of the higher operating expenses involved and market competition. However,
the overall performance of the company is still significant (Kaplan and Atkinson, 2015).
2018
(AUD) 2017
(AUD) 2016
(AUD) 2015
(AUD) 2014
(AUD)
-150.00%
-100.00%
-50.00%
0.00%
50.00%
100.00%
150.00%
200.00%
Contributed equity
($000s)
Retained earnings
($000s)
Reserves ($000s)
Total Parent interests
($000s)
Minority interests
($000s)
TOTAL EQUITY ($000s)
TOTAL EQUITY FOR
PREVIOUS YEAR ($000s)
Figure 4: Total Equity (trend analysis)
(Morningstar, 2019)
The above graph explains that various changes have occurred into the equity position
of the business. The overall changes have been done to improve the performance and fund
level of the business.
Ratio analysis:
Ratio analysis is one of the tools of financial management which helps the business to
identify the key financial position and interpret it to improve the performance of the company
and make better decisions for the business (Hofstede, 2012). In this report, ratio analysis
study has been conducted over BEACON LIGHTING GROUP LIMITED to measure the
profitability, liquidity, efficiency and capital structure position of the business. Below are the
details of ratio analysis study of the company:
Profitability ratio:
Profitability ratios define about the profits generated by the company in a particular
time period against various bases such as sales, assets, capital employed etc. Below graph
represents that from 2014, the profitability position of the company has been lowered a bit in
2018 because of the higher operating expenses involved and market competition. However,
the overall performance of the company is still significant (Kaplan and Atkinson, 2015).
⊘ This is a preview!⊘
Do you want full access?
Subscribe today to unlock all pages.
Trusted by 1+ million students worldwide
Accounting for managers 10
2018 2017 2016 2015 2014
0.00%
5.00%
10.00%
15.00%
20.00%
25.00%
30.00%
35.00%
40.00%
45.00%
50.00%
Profitability ratios
Return on Capital employed Return on assets
Net profit margin %
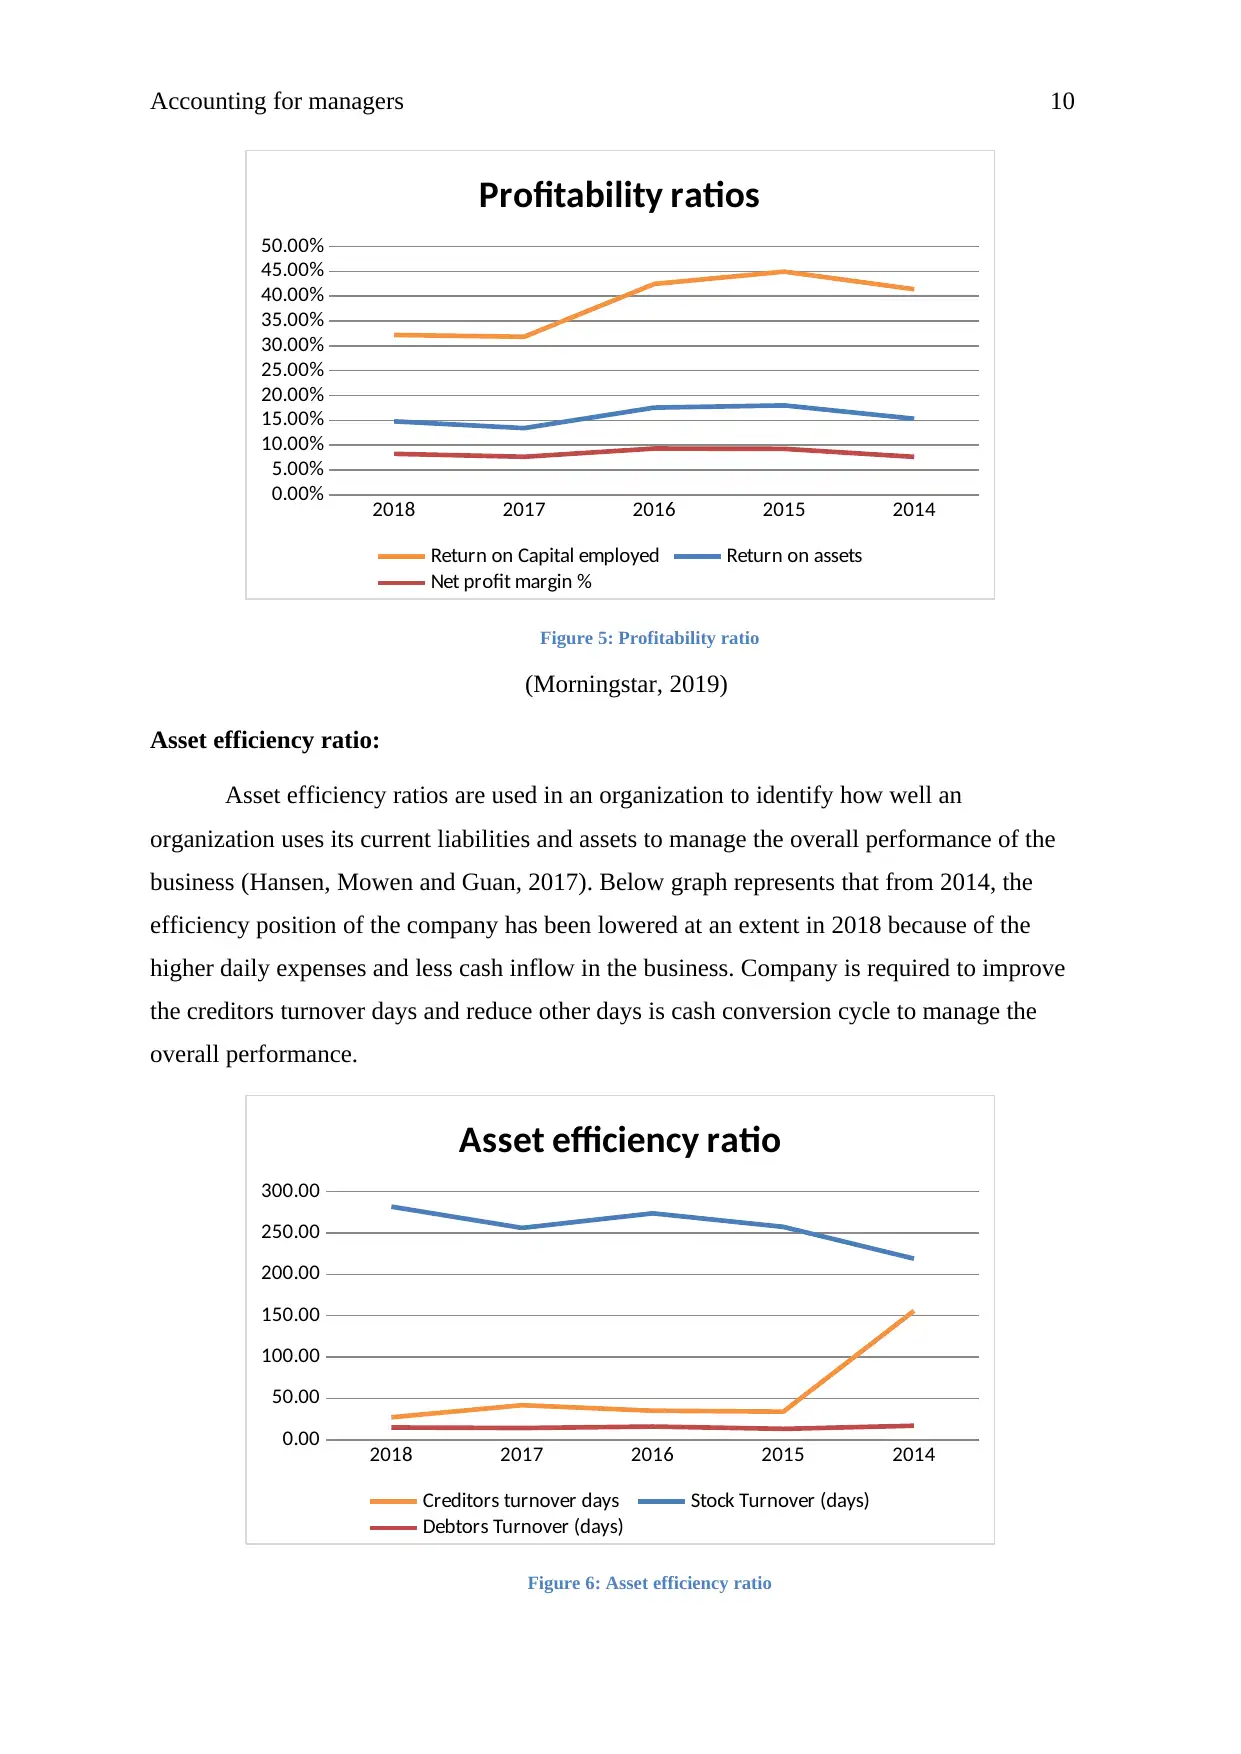
Figure 5: Profitability ratio
(Morningstar, 2019)
Asset efficiency ratio:
Asset efficiency ratios are used in an organization to identify how well an
organization uses its current liabilities and assets to manage the overall performance of the
business (Hansen, Mowen and Guan, 2017). Below graph represents that from 2014, the
efficiency position of the company has been lowered at an extent in 2018 because of the
higher daily expenses and less cash inflow in the business. Company is required to improve
the creditors turnover days and reduce other days is cash conversion cycle to manage the
overall performance.
2018 2017 2016 2015 2014
0.00
50.00
100.00
150.00
200.00
250.00
300.00
Asset efficiency ratio
Creditors turnover days Stock Turnover (days)
Debtors Turnover (days)
Figure 6: Asset efficiency ratio
2018 2017 2016 2015 2014
0.00%
5.00%
10.00%
15.00%
20.00%
25.00%
30.00%
35.00%
40.00%
45.00%
50.00%
Profitability ratios
Return on Capital employed Return on assets
Net profit margin %
Figure 5: Profitability ratio
(Morningstar, 2019)
Asset efficiency ratio:
Asset efficiency ratios are used in an organization to identify how well an
organization uses its current liabilities and assets to manage the overall performance of the
business (Hansen, Mowen and Guan, 2017). Below graph represents that from 2014, the
efficiency position of the company has been lowered at an extent in 2018 because of the
higher daily expenses and less cash inflow in the business. Company is required to improve
the creditors turnover days and reduce other days is cash conversion cycle to manage the
overall performance.
2018 2017 2016 2015 2014
0.00
50.00
100.00
150.00
200.00
250.00
300.00
Asset efficiency ratio
Creditors turnover days Stock Turnover (days)
Debtors Turnover (days)
Figure 6: Asset efficiency ratio
Paraphrase This Document
Need a fresh take? Get an instant paraphrase of this document with our AI Paraphraser
Accounting for managers 11
(Yahoo finance, 2019)
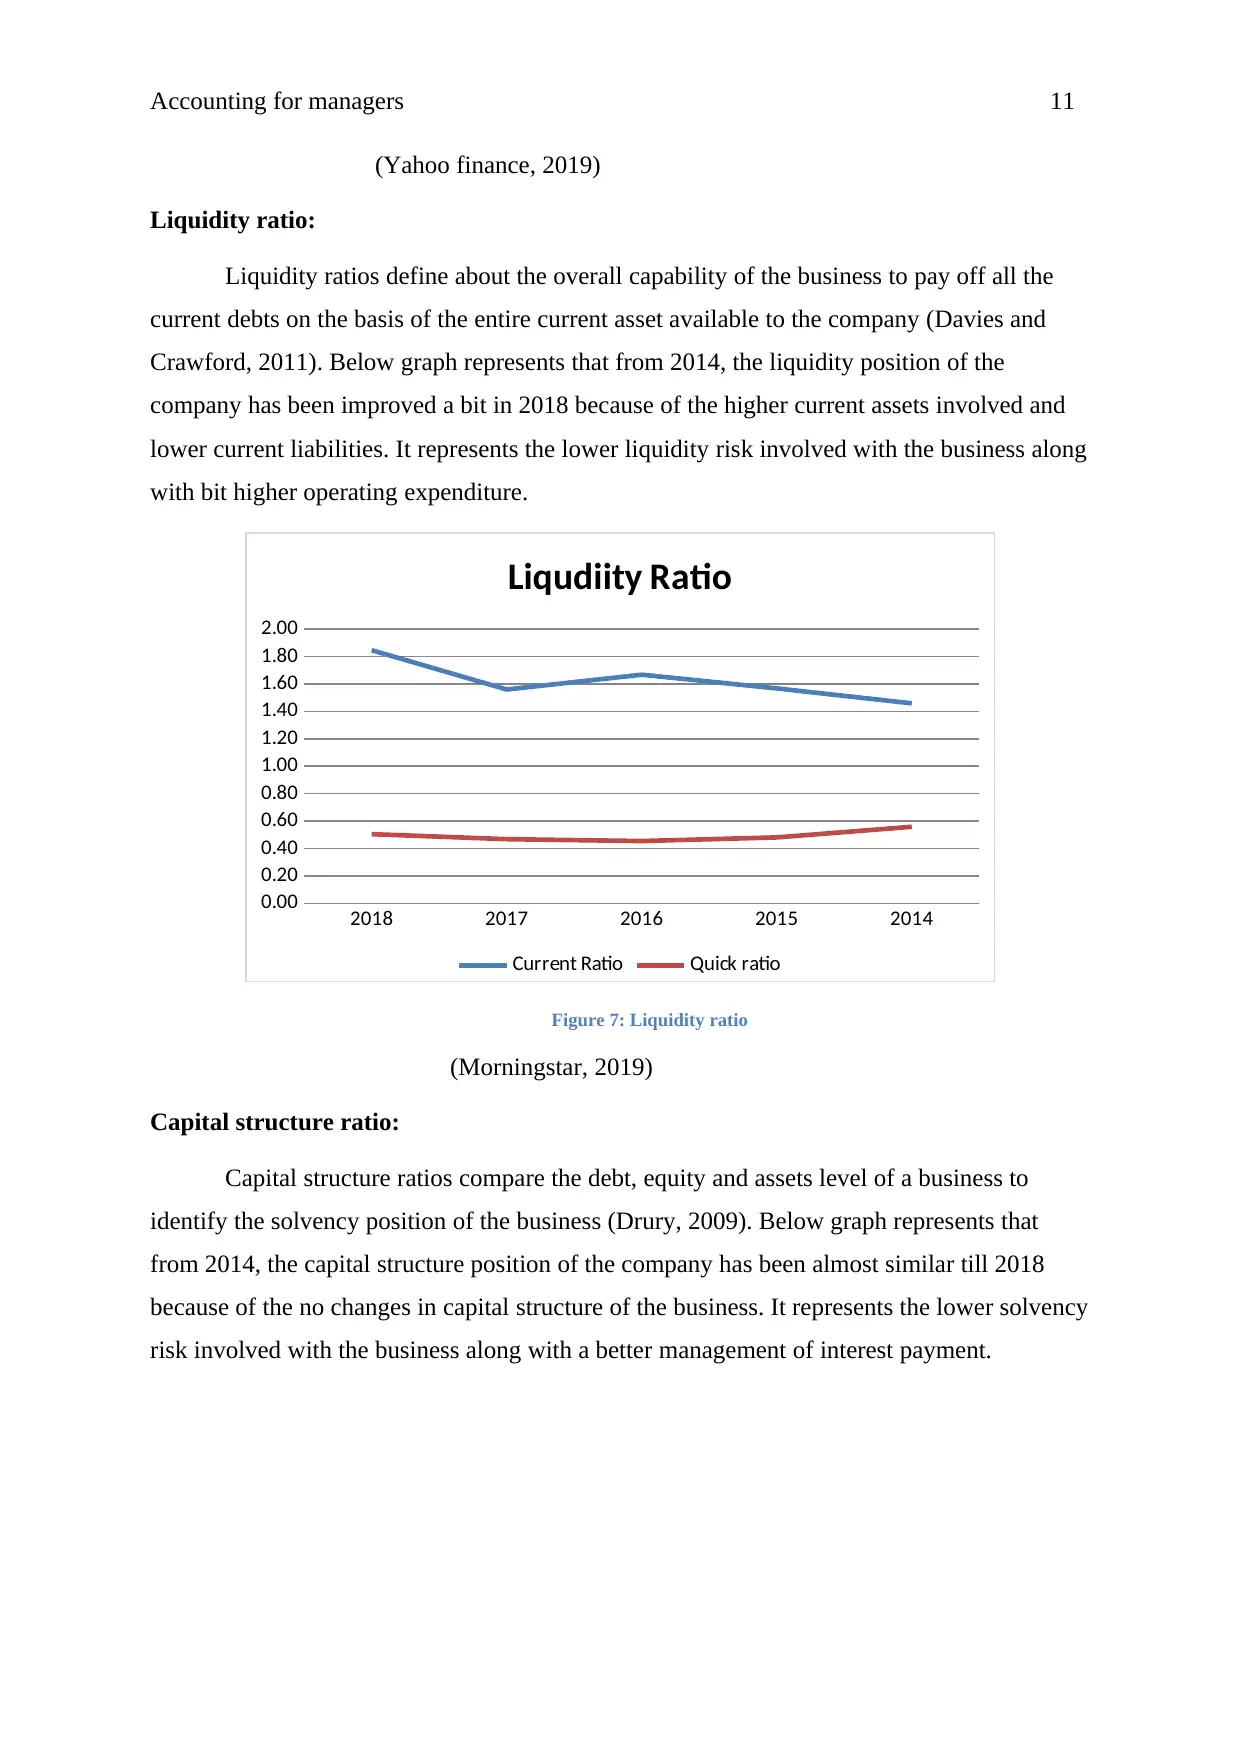
Liquidity ratio:
Liquidity ratios define about the overall capability of the business to pay off all the
current debts on the basis of the entire current asset available to the company (Davies and
Crawford, 2011). Below graph represents that from 2014, the liquidity position of the
company has been improved a bit in 2018 because of the higher current assets involved and
lower current liabilities. It represents the lower liquidity risk involved with the business along
with bit higher operating expenditure.
2018 2017 2016 2015 2014
0.00
0.20
0.40
0.60
0.80
1.00
1.20
1.40
1.60
1.80
2.00
Liqudiity Ratio
Current Ratio Quick ratio
Figure 7: Liquidity ratio
(Morningstar, 2019)
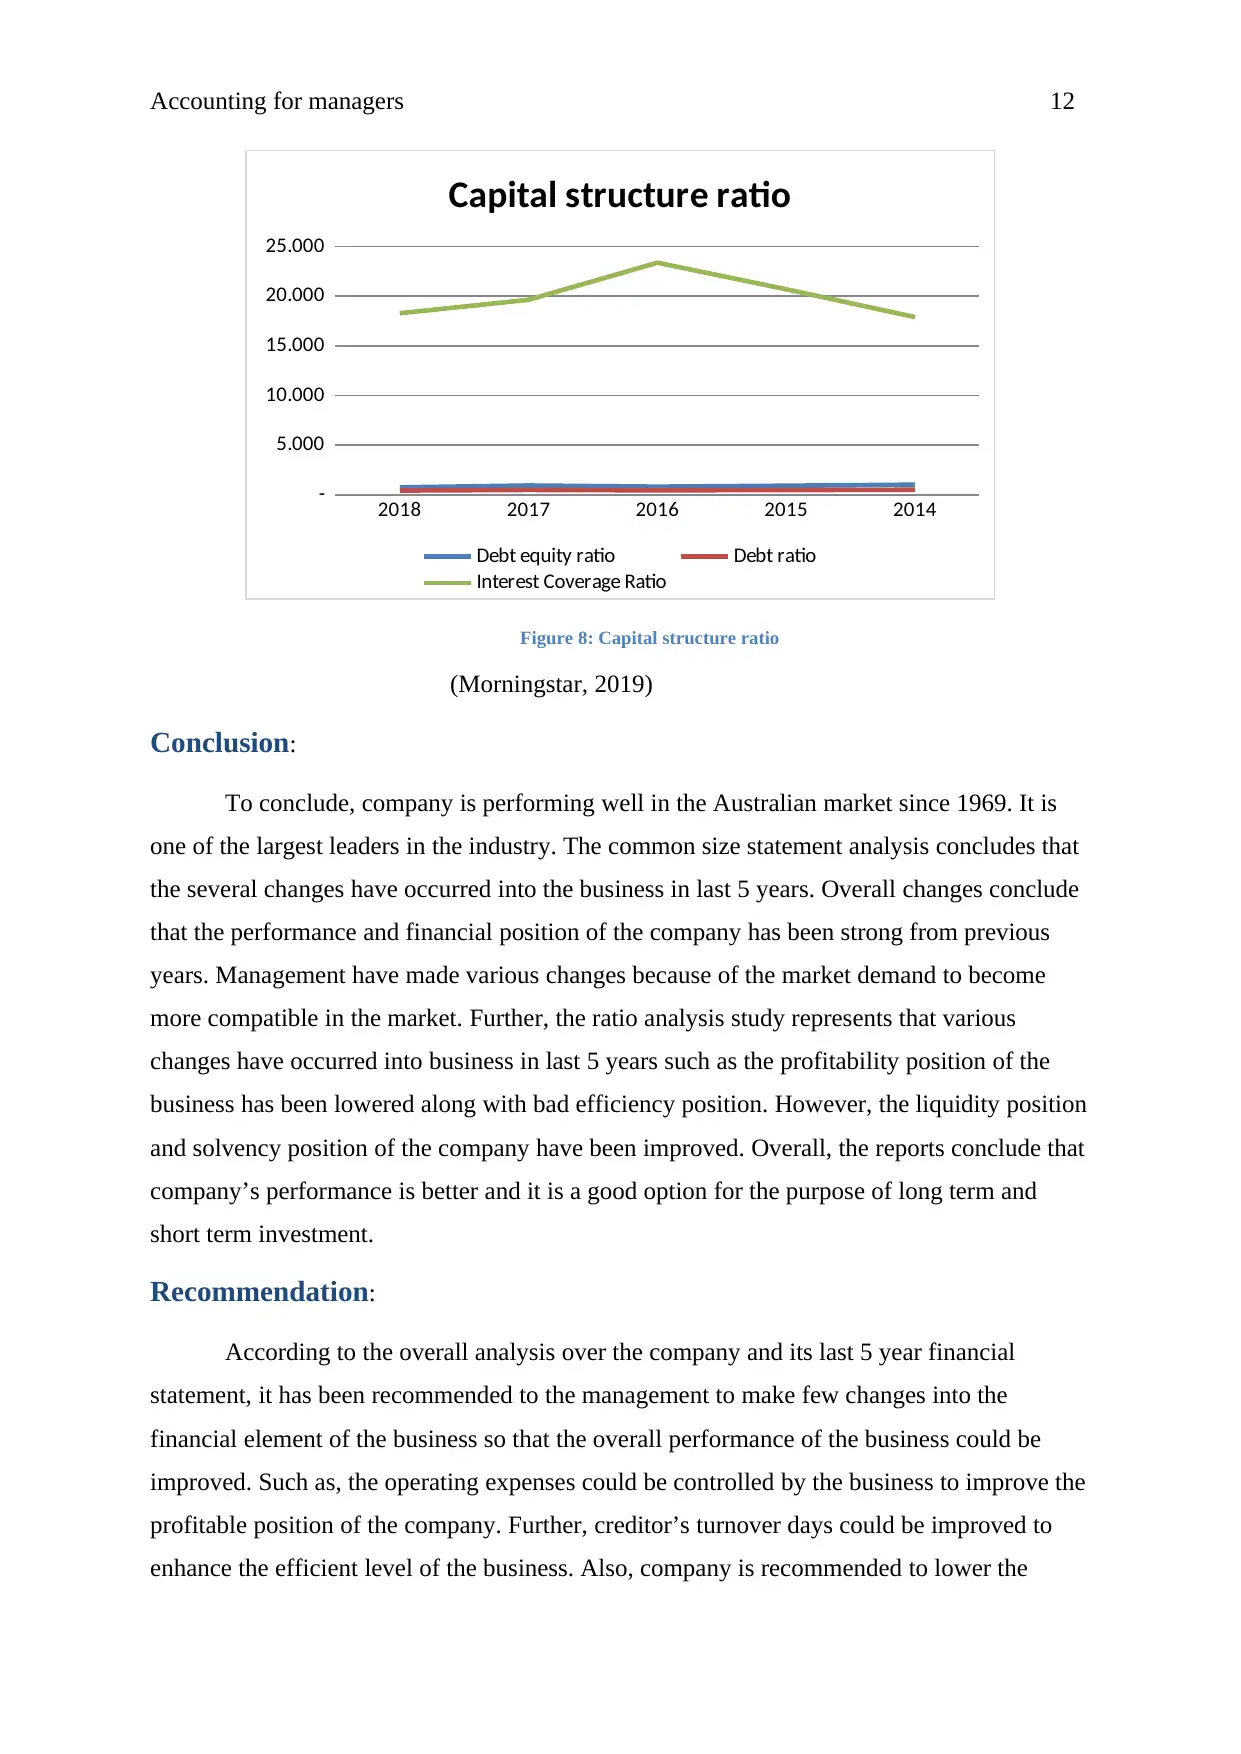
Capital structure ratio:
Capital structure ratios compare the debt, equity and assets level of a business to
identify the solvency position of the business (Drury, 2009). Below graph represents that
from 2014, the capital structure position of the company has been almost similar till 2018
because of the no changes in capital structure of the business. It represents the lower solvency
risk involved with the business along with a better management of interest payment.
(Yahoo finance, 2019)
Liquidity ratio:
Liquidity ratios define about the overall capability of the business to pay off all the
current debts on the basis of the entire current asset available to the company (Davies and
Crawford, 2011). Below graph represents that from 2014, the liquidity position of the
company has been improved a bit in 2018 because of the higher current assets involved and
lower current liabilities. It represents the lower liquidity risk involved with the business along
with bit higher operating expenditure.
2018 2017 2016 2015 2014
0.00
0.20
0.40
0.60
0.80
1.00
1.20
1.40
1.60
1.80
2.00
Liqudiity Ratio
Current Ratio Quick ratio
Figure 7: Liquidity ratio
(Morningstar, 2019)
Capital structure ratio:
Capital structure ratios compare the debt, equity and assets level of a business to
identify the solvency position of the business (Drury, 2009). Below graph represents that
from 2014, the capital structure position of the company has been almost similar till 2018
because of the no changes in capital structure of the business. It represents the lower solvency
risk involved with the business along with a better management of interest payment.
Accounting for managers 12
2018 2017 2016 2015 2014
-
5.000
10.000
15.000
20.000
25.000
Capital structure ratio
Debt equity ratio Debt ratio
Interest Coverage Ratio
Figure 8: Capital structure ratio
(Morningstar, 2019)
Conclusion:
To conclude, company is performing well in the Australian market since 1969. It is
one of the largest leaders in the industry. The common size statement analysis concludes that
the several changes have occurred into the business in last 5 years. Overall changes conclude
that the performance and financial position of the company has been strong from previous
years. Management have made various changes because of the market demand to become
more compatible in the market. Further, the ratio analysis study represents that various
changes have occurred into business in last 5 years such as the profitability position of the
business has been lowered along with bad efficiency position. However, the liquidity position
and solvency position of the company have been improved. Overall, the reports conclude that
company’s performance is better and it is a good option for the purpose of long term and
short term investment.
Recommendation:
According to the overall analysis over the company and its last 5 year financial
statement, it has been recommended to the management to make few changes into the
financial element of the business so that the overall performance of the business could be
improved. Such as, the operating expenses could be controlled by the business to improve the
profitable position of the company. Further, creditor’s turnover days could be improved to
enhance the efficient level of the business. Also, company is recommended to lower the
⊘ This is a preview!⊘
Do you want full access?
Subscribe today to unlock all pages.
Trusted by 1+ million students worldwide
1 out of 20
Related Documents


Your All-in-One AI-Powered Toolkit for Academic Success.
+13062052269
info@desklib.com
Available 24*7 on WhatsApp / Email
![[object Object]](/_next/static/media/star-bottom.7253800d.svg)
Unlock your academic potential
Copyright © 2020–2026 A2Z Services. All Rights Reserved. Developed and managed by ZUCOL.