Financial Analysis Report: Bega Cheese Limited's Performance (ACC701)
VerifiedAdded on 2022/12/29
|14
|2768
|3
Report
AI Summary
This report provides a financial analysis of Bega Cheese Limited, examining its financial position and performance. The analysis includes an executive summary, introduction, overview of the company, and detailed findings. Key aspects of the analysis involve ratio analysis (profitability, liquidity, and efficiency ratios) and common size analysis of the balance sheet. The report assesses the company's financial health, highlighting trends in profitability, liquidity, and asset utilization. The conclusion summarizes the company's declining financial position, emphasizing concerns related to liquidity and debt levels. Recommendations are provided, suggesting strategies to improve the financial performance, such as investing in current assets, optimizing receivables, and reducing expenses. The report aims to provide the board of directors with accurate financial information to facilitate informed decision-making.

Accounting for managers
Paraphrase This Document
Need a fresh take? Get an instant paraphrase of this document with our AI Paraphraser
ACCOUNTING 1
Executive Summary
The main aim of this report is to analyze or evaluate the financial position of the company. Bega
Cheese Limited has been taken into consideration to examine the financial performance. It has
been evaluated that the financial position of the company was declined in 2018 as it takes or
borrow as long term debt. It has long or short term debt due to which it will face the financial
challenges in near future. It is suggesting that the company has to borrow the amount on equity
instead of debt. It also has to invest the amount on current assets rather than non-current assets.
ACCOUNTING 2
Contents
Introduction......................................................................................................................................4
Overview..........................................................................................................................................5
Findings...........................................................................................................................................6
Ratio Analysis..............................................................................................................................6
Common Size Analysis................................................................................................................8
Conclusion.....................................................................................................................................10
Recommendations..........................................................................................................................11
References......................................................................................................................................12
⊘ This is a preview!⊘
Do you want full access?
Subscribe today to unlock all pages.
Trusted by 1+ million students worldwide

ACCOUNTING 3
Paraphrase This Document
Need a fresh take? Get an instant paraphrase of this document with our AI Paraphraser
ACCOUNTING 4
Introduction
Financial Analysis is the practice of assessing businesses, projects, budgets, and the other
financial information’s to examine the performance and suitability. It is used to examine the
stability, solvency, liquidity and profitability of an entity. It is essential to assess the financial
performance of the firm to operate the smoothly in the market. There are numerous techniques
that are used to assess the financial position of the business such as trend analysis, common size
financial statement and ratio analysis (Robinson, Henry, Pirie, and Broihahn, 2015). Although,
the assessment of financial position of the business on the basis of ratio will not accurate as these
are examine on fair cost. In this report, the discussion is made on the topic of financial analysis.
In this report, Bega Cheese Limited has been taken into consideration to assess the financial
position of the company.
The report is requested by the company’s board of directors and it is prepared for getting the
accurate the financial information. The main aim of this paper is to calculate the financial
position of the business to take the right decision.
In the beginning of this report, background of the company will be discussed. After the
discussion about the company, the financial analysis will be done to calculate the financial
performance by using the ratio, trend and common size balance sheet. At the end, the
recommendation will be given as per the findings.
ACCOUNTING 5
Overview
Bega Chesse Limited is a diary company of Australia which was established as an agricultural
cooperative that is owned by the dairy suppliers. The company converted into the public firm in
the year 2011 when it listed on the Australian Securities Exchange. Bega Cheese Limited also
has a 25% of stake of capital chilled foods with the multinational corporation lion have the
controlling interest. The company operates under the Dairy, Food processing industry by
providing the healthy food to consumers. The companies mainly operate in Australia. The a2
milk companies, Bellamy’s Organic are the main competitors of the company that provides the
similar services to consumers with the high quality (Bega Cheese Limited, 2017). The top
management and the supervisors of the company help to grow their business at the international
level. The corporate structures of the company are as given in the picture:
⊘ This is a preview!⊘
Do you want full access?
Subscribe today to unlock all pages.
Trusted by 1+ million students worldwide
ACCOUNTING 6
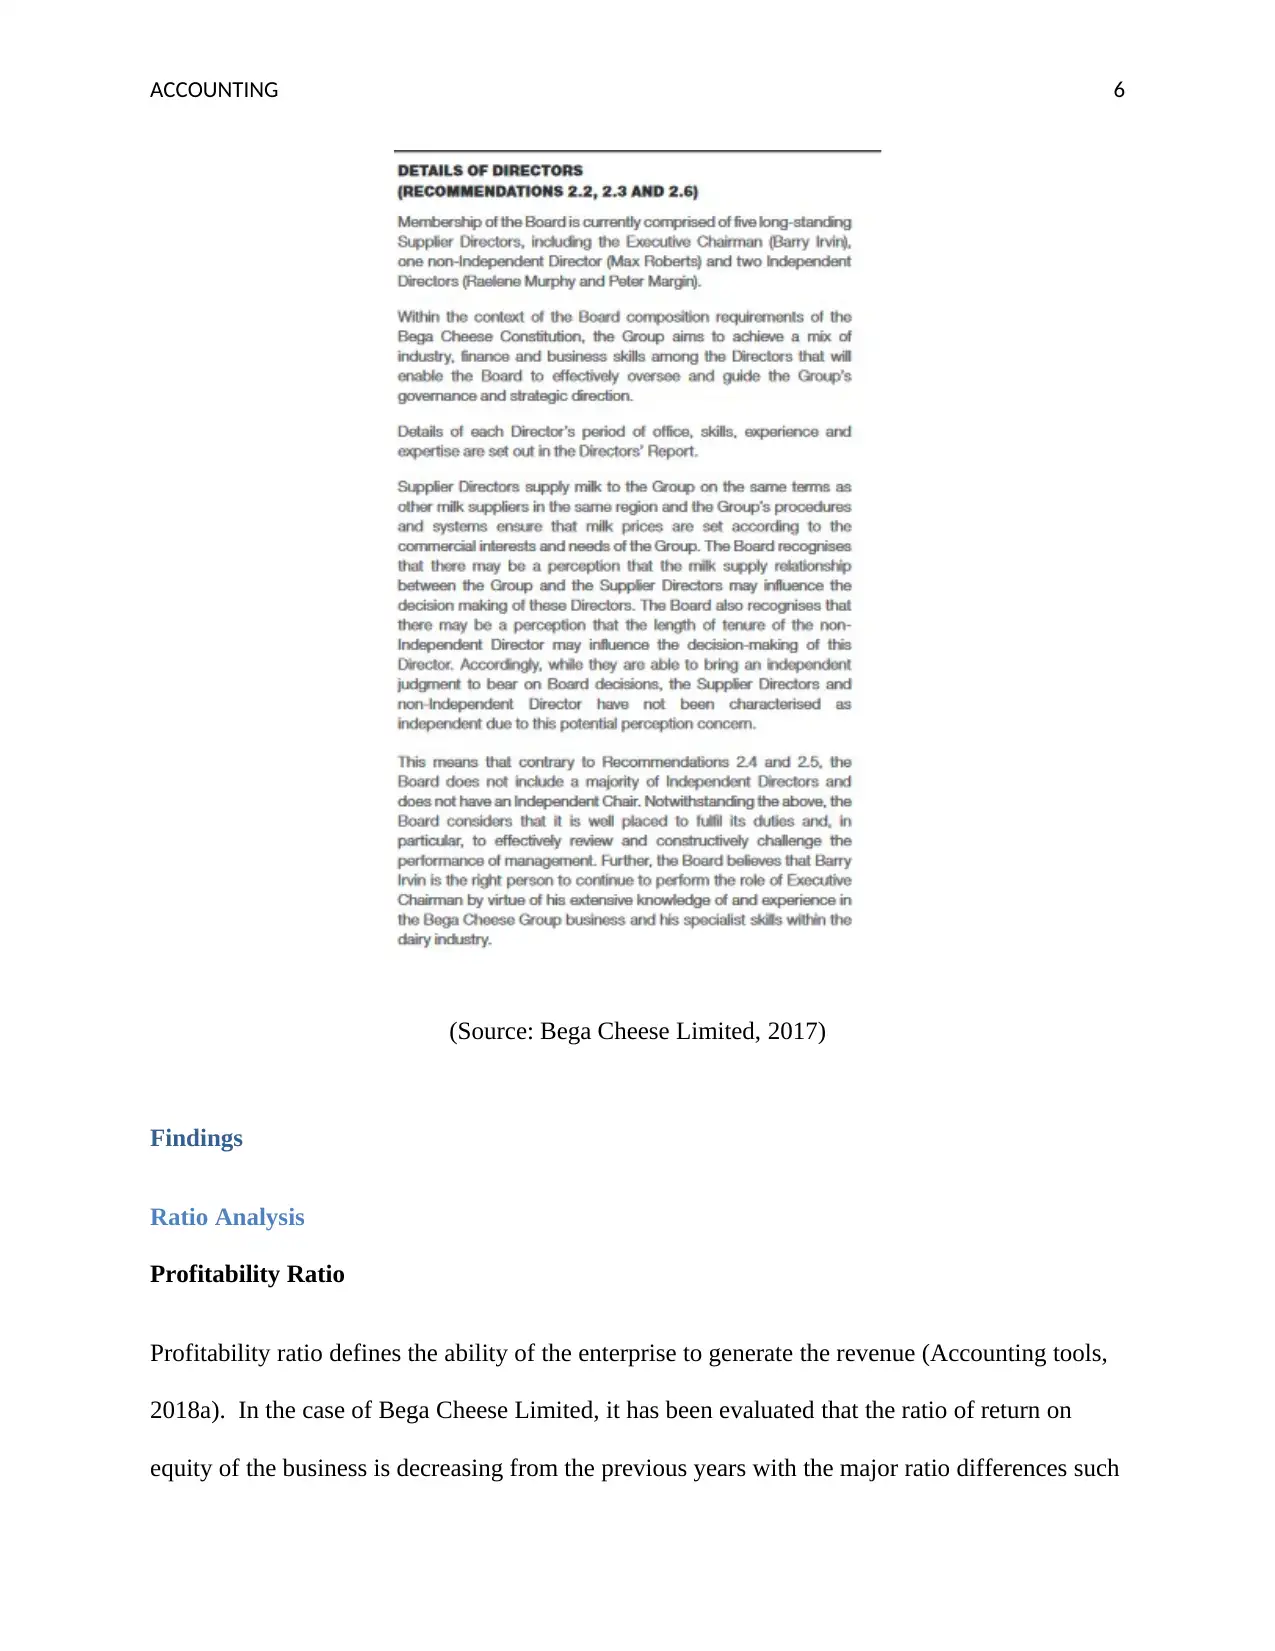
(Source: Bega Cheese Limited, 2017)
Findings
Ratio Analysis
Profitability Ratio
Profitability ratio defines the ability of the enterprise to generate the revenue (Accounting tools,
2018a). In the case of Bega Cheese Limited, it has been evaluated that the ratio of return on
equity of the business is decreasing from the previous years with the major ratio differences such
Paraphrase This Document
Need a fresh take? Get an instant paraphrase of this document with our AI Paraphraser
ACCOUNTING 7
as 30.82% to 4.78% from the year 2017 to 2018. The gross margin ratio of the firm is
increasing every year and now it is 18.91% in the year 2018. It reflects that the gross profit
margin is increasing from the 2017, 2016 and 2015 with the percentage of 12.57%, 12.82% and
10.88% respectively (Boyas, and Teeter, 2017). It depict that the cost of production of the
company is decreasing due to which the gross profit of the company is increasing.
The net profit margin ratio of the company is decreasing with the major percentage in the year
2018. It has been found that the company net profit margin is high in the year 2017 with the
percentage of 11.31% . Increasing net profit depicts that the company has earns the high revenue
by controlling the expenses (Zainudin, and Hashim, 2016).
Liquidity Ratio
Liquidity Ratio states the competence of the business to pay its all short term liabilities by using
the assets (Clear Tax, 2018). The ratio contains the current and quick ratio to states the liquidity
situation of the business. It has been evaluated that the current ratio of the company is decreasing
in 2018 from the year 2017, and 2016. The current ratio of the business is in the year 2018 is
1.69 which reflects that it becomes insolvent in the coming future due to decreasing the current
asset. The quick ratio of the business also defines the liquidity position that is decreasing from
the previous years such as 2017 and 2018. It states that the firm has more current liabilities rather
than current assets. It has been assessed that the current ratio of the firm is reducing that states
the weak liquidity position due to more liabilities. The reason of changing the low level of
liquidity position is that the company invests less in current assets due to which current liabilities
is increasing (Small, Dollie, and Yasseen, 2019).
ACCOUNTING 8
Efficiency Ratio
Efficiency Ratio describes the ability of the enterprise to use the assets to pay all short term and
long term debts (Accounting tools, 2018b). The efficiency ratio of the company contains the
collection period, credit period and inventory turnover ratio. The collection period and credit
period are the days in which the company receive and pay its liability. Collection period of the
company is increasing by 2 days in 2018 as in the year 2017; the company receives the collection
amount in 42 days. It states that the company fails to receive the amount in few days due to it
takes more time to pay its all liabilities. The inventory turnover of the business is also declining
with the 6.2 ratio from the previous year’s such as 2017 and 2016. It reflects that the company
takes less time to convert its stock into money but it delivers the stock on credit due to which the
amount of account receivable takes more time to receives and pay. The company also takes more
time to convert the stock into cash so that it is able to invest in current assets or pay its long term
or short term debts on time (Chen, Ong, and Hsu, 2016).
Common Size Analysis
Common Size Balance Sheet
Common Size Balance Sheet is the technique to analyze the financial situation. The financial
situation of the business is analyzed by evaluating the percentage of assets and liabilities. These
are evaluated as below:
Assets
⊘ This is a preview!⊘
Do you want full access?
Subscribe today to unlock all pages.
Trusted by 1+ million students worldwide
ACCOUNTING 9
As per the common size balance sheet method, the total assets have been taken as a base due to
which it is taken as 100%. In total asset, there are different percentage of current assets and non-
current asset. In the last five years, the percentage of current assets and current liabilities are
fluctuated. In the year 2018, the percentage of current asset is 38.58% and the percentage of non-
current assets is 61.42% which depict that the company invested more in fixed assets as compare
to current assets. It affects the liquidity position of the company as the fixed assets take time to
convert into money due to which it has to take the money on debt. The percentage of current
assets is high as compare to non-current assets in the year 2017. The percentage of current asset
is 77.49% and non-current assets are 22.51% which depict the strong liquidity position of the
company (Bauman, and Shaw, 2016). In 2016, 2015, and 2014, the percentage of current asset is
constant or similar such as 58-59%.The liquidity position of the company is moderate which
defines that the 60% of current assets of the company is converted into cash. According to the
analyses, the company mainly invests in fixed assets which consume high cost but long term
asset takes more time to convert the assets into cash. The company has to focus on its liquidity
position neither it will face the financial issues in near future (Di Tella, 2017).
Liabilities
Total liabilities have been taken as a base due to which it is considered as 100%. The percentage
of total liabilities is divided into the current liabilities and non-current liabilities. In 2018, the
percentage of current liabilities is 47.65% and the non-current liabilities are 52.35%. It depicts
the high chances of insolvency as the company borrows the money on debt that directly causes
the losses. It has been evaluated that the company has more long term liabilities as compare to
short term liabilities due to which the risk of losses is high as it difficult to pay long term
liabilities (Karadag, 2015).
Paraphrase This Document
Need a fresh take? Get an instant paraphrase of this document with our AI Paraphraser
ACCOUNTING 10
In the year 2017, the percentage of current liabilities is 55.13% and the non-current liabilities are
44.87% which indicates that the company as at the edge position of insolvency. In the year
2016, 2015 and 2014, the percentage of current liabilities is high as compare to non-current
liabilities such as 80.84%, 74.78% and 90.57%. The non-current liabilities of the company are
19.16%, 25.22% and 9.43%. It has been evaluated that the percentage of current liabilities is high
in three years which indicates that the company is in difficult situation as it has to pay the large
amount to reduce long term liabilities.
Conclusion
From the above evaluation, it is concluded that the position of Bega Cheese Limited is declining.
As per the analysis, it has been assessed that the business is at the declining position as it has
more current liabilities as compare to current assets. It is also observed that the current assets are
less as compare to fixed assets due to which the company faces the difficulty to convert the
assets into cash. According to ratio analysis, it has been measured that the efficiency ratio of the
organization is also less which depict that the organization consumes more time to receive the
cash from debtors due to which it is also getting more money on debt instead of equity or it takes
more time to pay its all liabilities (short term- long term liabilities). As per the common size
balance sheet, it has been found that the business has more non-current assets instead of current
assets due to which its liquidity position is declined. It can be said that the company will face the
loss in the coming future (Bauman, and Shaw, 2016).
ACCOUNTING 11
Recommendations
It is observed that the financial situation of the business is not good due to which it will faces the
challenge that is why’ it is recommending that it has to focuses on some areas which is requires
to improve. Some of the areas in which the company has to focus are given below:
As per the above analysis, it has been found that the firm has more current assets as compare to
non-current assets. It is recommending that Bega Cheese Limited has to invest the money on
current assets so that it can convert the assets into cash in short time period. It helps to increases
the revenue in the organization (Schroeder, Clark, and Cathey, 2019).
It has been found that the company receives the cash amount from its debtors in more time due to
which it takes more time to pay the credit amount. It is suggesting that the company has to
receive the amount of account receivables in less time so that it borrows fewer amounts of cash
as debt and also invest in current assets or inventory to earn the high revenue.
It is also suggested that the company has to reduce the expenses to earn the high revenue.
According to the analysis, it has been evaluated that the net profit margin of the organization is
reducing due to its high expenses. The expenses of the company is high that is why; it is
recommending that the business has to focus on reducing its expenses to earns the high revenue.
It is required to maintain the balance between the expenses and revenue to operate the business
smoothly in the market (Williams, and Dobelman, 2017).
⊘ This is a preview!⊘
Do you want full access?
Subscribe today to unlock all pages.
Trusted by 1+ million students worldwide
1 out of 14
Related Documents


Your All-in-One AI-Powered Toolkit for Academic Success.
+13062052269
info@desklib.com
Available 24*7 on WhatsApp / Email
![[object Object]](/_next/static/media/star-bottom.7253800d.svg)
Unlock your academic potential
Copyright © 2020–2026 A2Z Services. All Rights Reserved. Developed and managed by ZUCOL.