Finance Assignment: Breakeven Analysis, Ratios, and IRR Calculation

Verified

Added on  2022/08/08

|8
|896
|34
Homework Assignment
AI Summary
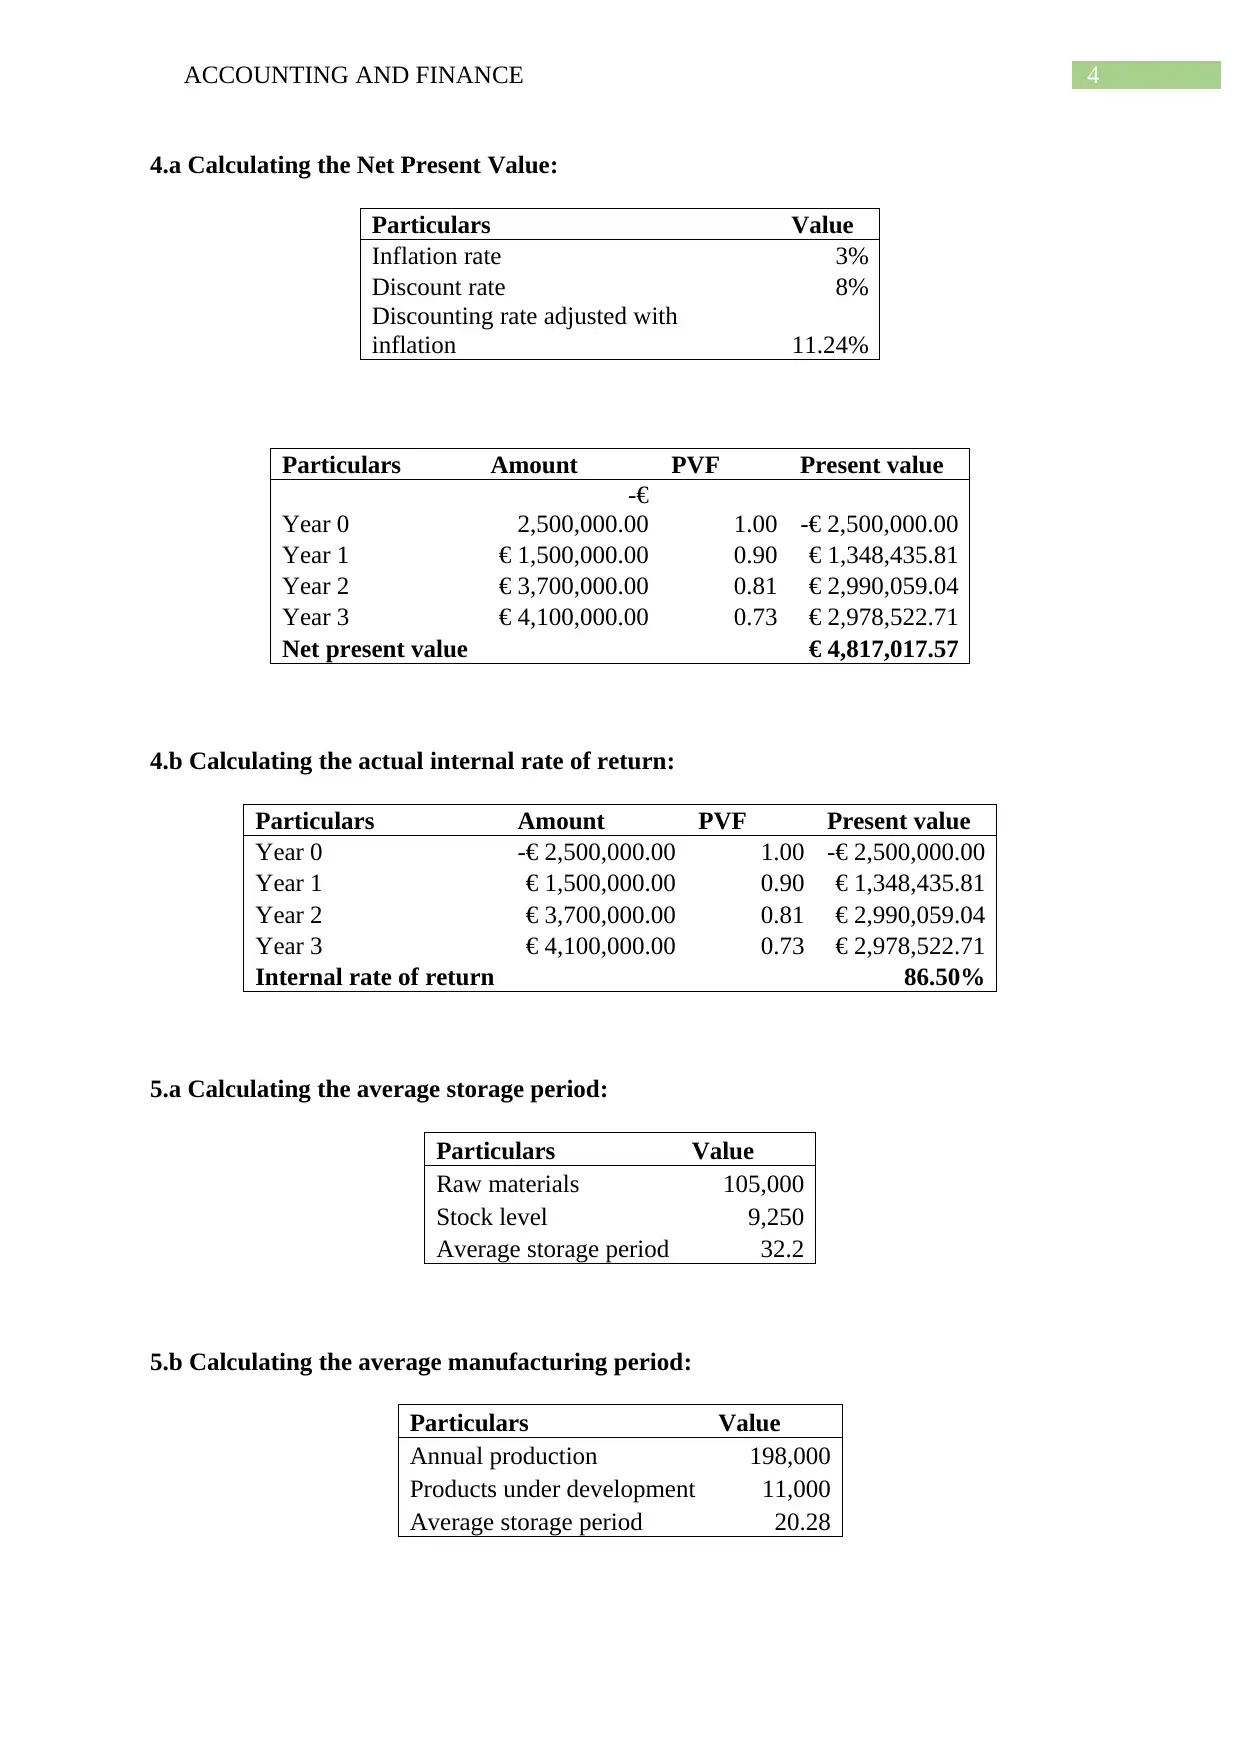
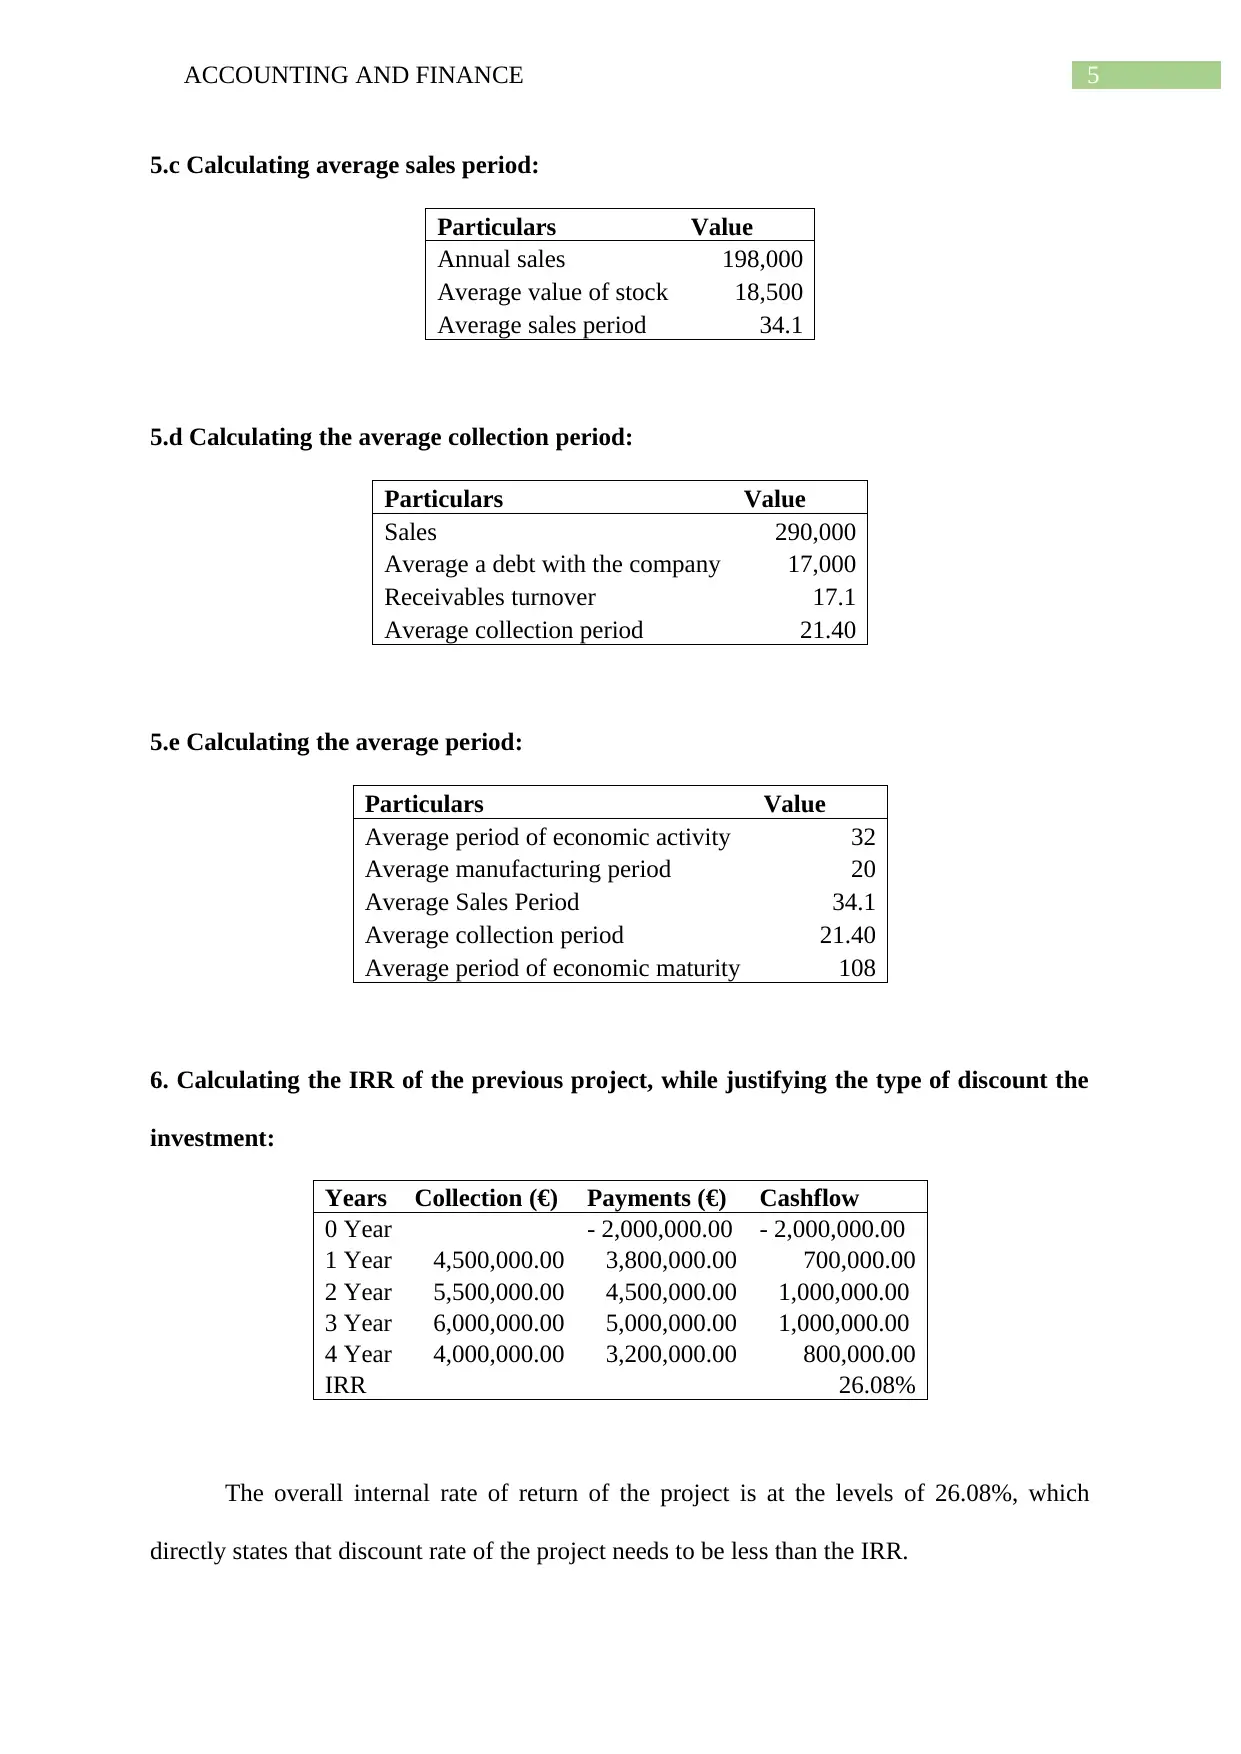
This finance assignment provides a comprehensive analysis of various financial concepts. It begins with calculating the breakeven point in units, days to achieve breakeven, and the corresponding sales value. The assignment then delves into calculating the absolute return and various financial ratios, comparing a company's performance to its sector. Further, it includes the calculation of Net Present Value (NPV) and the actual Internal Rate of Return (IRR), alongside an analysis of average storage, manufacturing, sales, and collection periods. Finally, the assignment calculates the IRR of a project, justifying the discount rate used. The assignment is well-structured, including detailed calculations and references.
Document Page
Running head: ACCOUNTING AND FINANCE
Accounting and Finance
Name of the Student:
Name of the University:
Author Note
tabler-icon-diamond-filled.svg

Secure Best Marks with AI Grader

Need help grading? Try our AI Grader for instant feedback on your assignments.
Document Page
1ACCOUNTING AND FINANCE
Table of Contents
1.a Calculating the breakeven point in units:.............................................................................2
1.b Days to achieve BEP:...........................................................................................................2
1.c Sale value:............................................................................................................................2
2. Calculating the absolute return:.............................................................................................2
3. Calculating different financial ratios:.....................................................................................3
4.a Calculating the Net Present Value:......................................................................................3
4.b Calculating the actual internal rate of return:.......................................................................4
5.a Calculating the average storage period:...............................................................................4
5.b Calculating the average manufacturing period:...................................................................4
5.c Calculating average sales period:.........................................................................................4
5.d Calculating the average collection period:...........................................................................4
5.e Calculating the average period:............................................................................................5
6. Calculating the IRR of the previous project, while justifying the type of discount the
investment:.................................................................................................................................5
References and Bibliography:....................................................................................................6
Document Page
2ACCOUNTING AND FINANCE
1.a Calculating the breakeven point in units:
Particulars Value
Unit selling price € 25
Unit variable costs € 5
Unit contribution
margin € 20
Fixed cost € 110,000
Breakeven point in units 5,500
1.b Days to achieve BEP:
Particulars Value
Annual sales 20,000
Sales per day 55
Breakeven point in
units 5,500
Days to achieve BEP 100
1.c Sale value:
Particulars Value
Breakeven point in units 5,500
Unit selling price € 25
Sale value € 137,500
Document Page
3ACCOUNTING AND FINANCE
2. Calculating the absolute return:
Year 1 Year 0 Year 1 Year 2 Year 3 Year 4 Year 5 Year 6
Production in units 140,000.00 200,000.00 200,000.00 200,000.00 200,000.00
Unit Sale Price (in Euros) 2.50 2.60 2.70 2.81 2.92
Revenues (in Euros) 350,000.00 520,000.00 540,800.00 562,432.00 584,929.28
Costs:
Variable cost per unit (in Euros) 1.50 1.55 1.59 1.64 1.69
Total variable cost (in Euros) 210,000.00 309,000.00 318,270.00 327,818.10 337,652.64
Fixed cost per year (in Euros) 60,000.00 61,200.00 62,424.00 63,672.48 64,945.93
Gross income (in Euros) (Revenues-Variable cost-Fixed cost) 80,000.00 149,800.00 160,106.00 170,941.42 182,330.71
Depreciation expense (in Euros) 35,000.00 35,000.00 35,000.00 35,000.00 35,000.00
Net income before taxes (Gross income - Depreciation) 45,000.00 114,800.00 125,106.00 135,941.42 147,330.71
Tax rate 25% 11,250.00 28,700.00 31,276.50 33,985.36 36,832.68
Net income after tax 45,000.00 103,550.00 96,406.00 104,664.92 113,345.35 36,832.68-
+Depreciation (Added back) 35,000.00 35,000.00 35,000.00 35,000.00 35,000.00
Annual cash flows 80,000.00 138,550.00 131,406.00 139,664.92 148,345.35
Terminal cash flow on sale of machine - - - - 26,250.00
Initial investment 200,000.00-
Cash flows in each Year 200,000.00- 80,000.00 138,550.00 131,406.00 139,664.92 174,595.35
Discount rate 1.00 0.93 0.86 0.79 0.74 0.68
Dis-cash flow 200,000.00- 74,074.07 118,784.29 104,314.32 102,657.89 118,826.66
'Total benefits 318,657.24
Net absolute return 59.33%
3. Calculating different financial ratios:
Particulars Sector Company
General liquidity ratio 1.55 1.89
Acid test ratio 1.20 1.42
Cash to liquidity ratio 0.95 0.74
Debt ratio 1.25 1.75
Margin on Sales 21.00% 58.00%
Investment rotation 1.45 0.85
Economic Profitability 23.00% 16.68%
Financial Profitability 29.00% 19.56%
The general liquidity ratio and acid test ratio of the company is higher than the sector,
which states about the current financial position of the company. On the other hand, the cash
to liabilities of the industry is higher, as the company holds less cash in their books. In
addition, the debt ratio of the company is better than the industry, as its value is higher.
Moreover, the economic profitability and financial profitability of the industry is much higher
than the industry, which is due to the low level of profits obtained by the organisation
(Kanapickiene and Grundiene 2015).
tabler-icon-diamond-filled.svg

Secure Best Marks with AI Grader

Need help grading? Try our AI Grader for instant feedback on your assignments.
Document Page
4ACCOUNTING AND FINANCE
4.a Calculating the Net Present Value:
Particulars Value
Inflation rate 3%
Discount rate 8%
Discounting rate adjusted with
inflation 11.24%
Particulars Amount PVF Present value
Year 0
-€
2,500,000.00 1.00 -€ 2,500,000.00
Year 1 € 1,500,000.00 0.90 € 1,348,435.81
Year 2 € 3,700,000.00 0.81 € 2,990,059.04
Year 3 € 4,100,000.00 0.73 € 2,978,522.71
Net present value € 4,817,017.57
4.b Calculating the actual internal rate of return:
Particulars Amount PVF Present value
Year 0 -€ 2,500,000.00 1.00 -€ 2,500,000.00
Year 1 € 1,500,000.00 0.90 € 1,348,435.81
Year 2 € 3,700,000.00 0.81 € 2,990,059.04
Year 3 € 4,100,000.00 0.73 € 2,978,522.71
Internal rate of return 86.50%
5.a Calculating the average storage period:
Particulars Value
Raw materials 105,000
Stock level 9,250
Average storage period 32.2
5.b Calculating the average manufacturing period:
Particulars Value
Annual production 198,000
Products under development 11,000
Average storage period 20.28
Document Page
5ACCOUNTING AND FINANCE
5.c Calculating average sales period:
Particulars Value
Annual sales 198,000
Average value of stock 18,500
Average sales period 34.1
5.d Calculating the average collection period:
Particulars Value
Sales 290,000
Average a debt with the company 17,000
Receivables turnover 17.1
Average collection period 21.40
5.e Calculating the average period:
Particulars Value
Average period of economic activity 32
Average manufacturing period 20
Average Sales Period 34.1
Average collection period 21.40
Average period of economic maturity 108
6. Calculating the IRR of the previous project, while justifying the type of discount the
investment:
Years Collection (€) Payments (€) Cashflow
0 Year - 2,000,000.00 - 2,000,000.00
1 Year 4,500,000.00 3,800,000.00 700,000.00
2 Year 5,500,000.00 4,500,000.00 1,000,000.00
3 Year 6,000,000.00 5,000,000.00 1,000,000.00
4 Year 4,000,000.00 3,200,000.00 800,000.00
IRR 26.08%
The overall internal rate of return of the project is at the levels of 26.08%, which
directly states that discount rate of the project needs to be less than the IRR.
Document Page
6ACCOUNTING AND FINANCE
tabler-icon-diamond-filled.svg

Paraphrase This Document

Need a fresh take? Get an instant paraphrase of this document with our AI Paraphraser
Document Page
7ACCOUNTING AND FINANCE
References and Bibliography:
Arkan, T., 2016. The importance of financial ratios in predicting stock price trends: A case
study in emerging markets. Finanse, Rynki Finansowe, Ubezpieczenia, 79(1), pp.13-26.
Hoyle, J.B., Schaefer, T. and Doupnik, T., 2015. Advanced accounting. McGraw Hill.
Kanapickienė, R. and Grundienė, Ž., 2015. The model of fraud detection in financial
statements by means of financial ratios. Procedia: social and behavioral sciences, pp.321-
327.
Kaplan, R.S. and Atkinson, A.A., 2015. Advanced management accounting. PHI Learning.
Kieso, D.E., Weygandt, J.J. and Warfield, T.D., 2019. Intermediate accounting. John Wiley
& Sons.
Liang, D., Lu, C.C., Tsai, C.F. and Shih, G.A., 2016. Financial ratios and corporate
governance indicators in bankruptcy prediction: A comprehensive study. European Journal
of Operational Research, 252(2), pp.561-572.
chevron_up_icon
1 out of 8
circle_padding
hide_on_mobile
zoom_out_icon
[object Object]