Accounting and Finance for Business: Pizza Franchise Project Analysis

Verified

Added on  2021/06/14

|10
|1980
|12
Homework Assignment
AI Summary
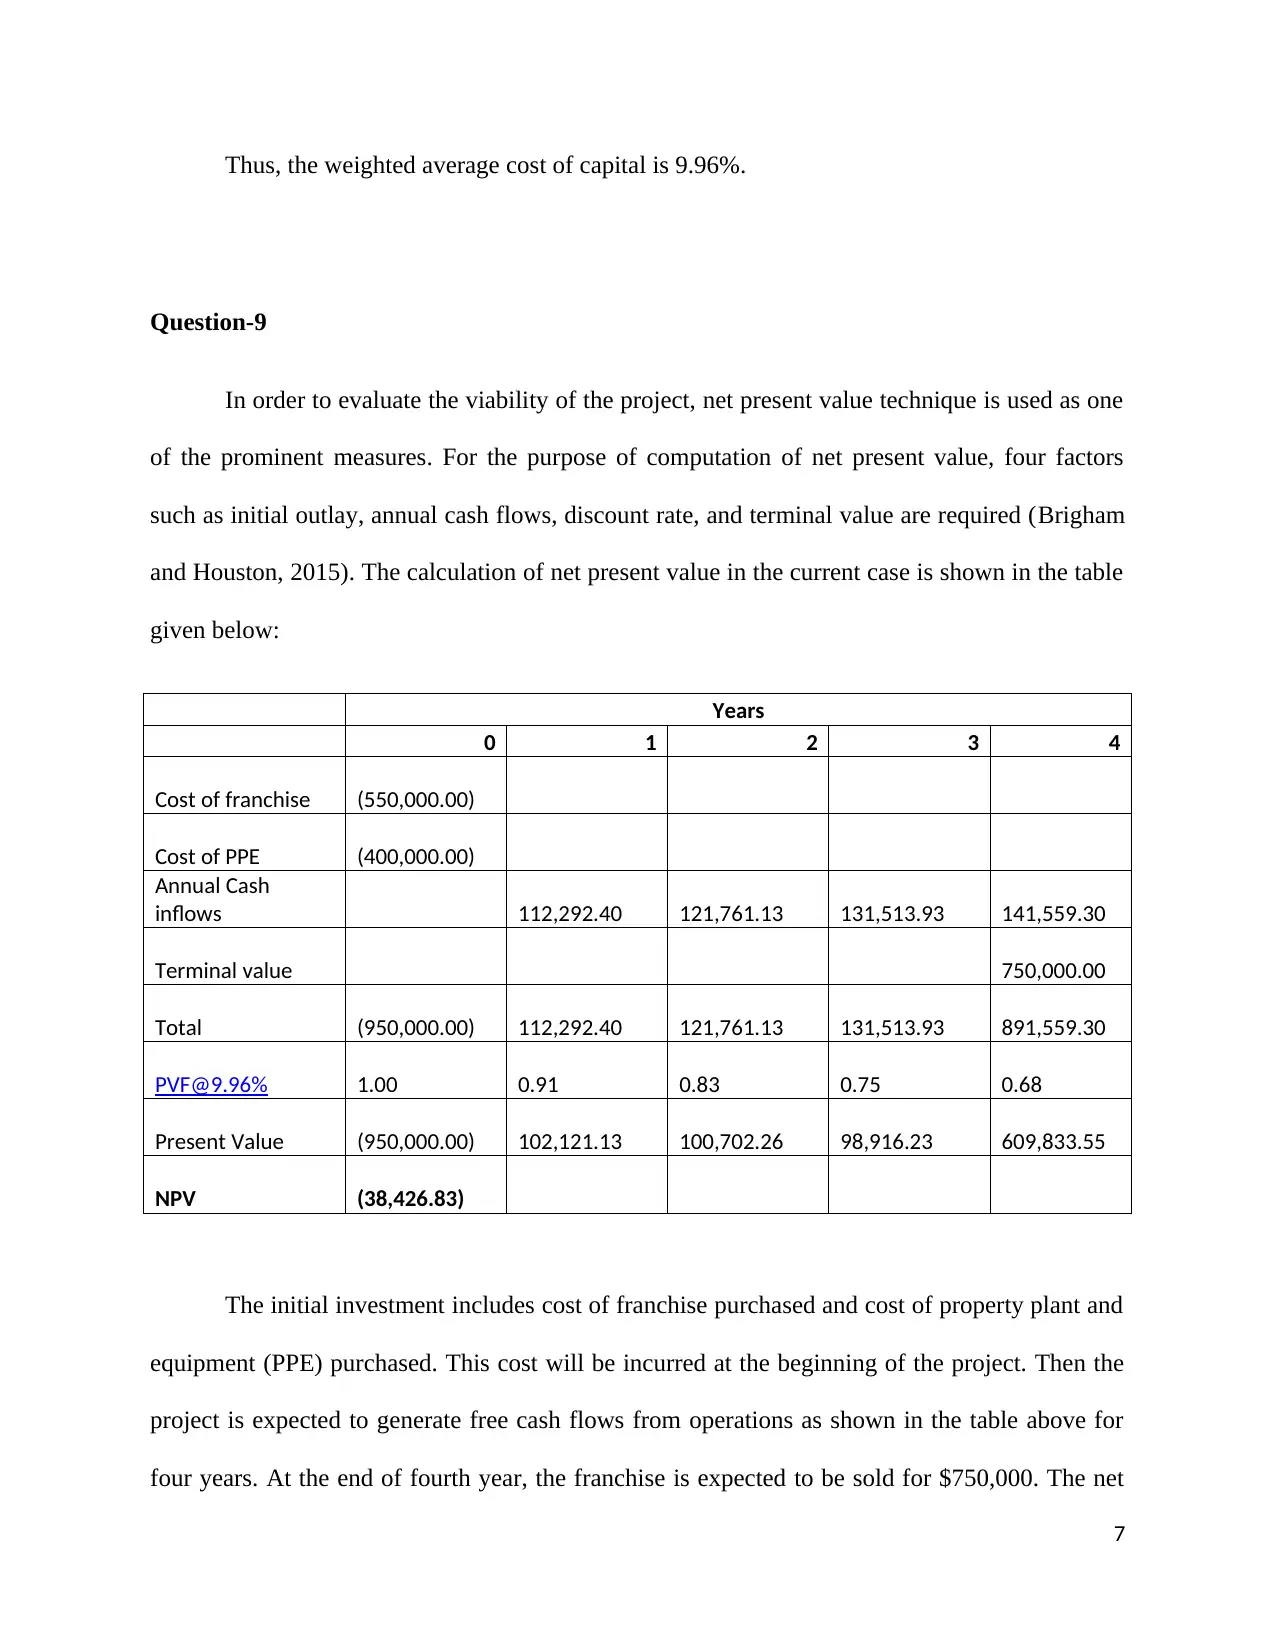
This assignment provides a comprehensive financial analysis of a proposed pizza franchise. It begins by calculating the number of pizzas required to break even, considering fixed and variable costs, and desired return on capital. An income statement is constructed to estimate net income, followed by a free cash flow analysis using the indirect method. The assignment then computes the Earnings Before Interest, Taxes, Depreciation, and Amortization (EBITDA) and assesses the franchise's beta and the risk-free rate to calculate the Capital Asset Pricing Model (CAPM) return and Weighted Average Cost of Capital (WACC). Finally, the Net Present Value (NPV) of the project is determined, leading to a recommendation to reject the project due to a negative NPV. The analysis also considers the risks associated with the project, such as market competition and regulatory changes, and references relevant financial literature.
Document Page
Accounting and Finance for Business
1
tabler-icon-diamond-filled.svg

Secure Best Marks with AI Grader

Need help grading? Try our AI Grader for instant feedback on your assignments.
Document Page
Question-1
In order to arrive at the number of units required to be sold to achieve a desired level of
income, it is essential to find out the fixed cost incurred and work out the return required before
tax. Then, sum up these two figures and divide by the contribution margin per unit (Cafferky,
2010).
In the current case, the contribution margin per unit for Pizza is $3.77. Total fixed cost has been
worked out to be $367,260 and the return on capital is $80,000 ($400,000*20%). The total of
fixed cost and desired return is $447,260. Thus, the number of Pizzas required to be sold per year
will be 118,637 ($447,260/3.77) or we can say 2,281 per week (118,637/52).
Question-2
The estimated net income after deducting taxes is presented in the statement shown
below:
Income statement: Year 1
Particulars Amount
No of Pizza sold (2300*52) 119,600.00
Price per Pizza 10.00
Revenues
1,196,000.0
0
Less: Variable cost
Cost of goods sold (4.93*119600) 589,628.00
Royalty (7% of sales 83,720.00
Marketing Contribution (6% of
sales) 71,760.00
Contribution
2
Document Page
450,892.00
Less: Fixed costs
Full-Time Employee Costs 123,000.00
Casual Employee Costs 67,392.00
On-Costs 57,118.00
Store Costs (outgoings) 18,000.00
Occupancy Cost (rent) 48,000.00
EBITDA 137,382.00
Less: Interest (150000*6.5%) 9,750.00
Less: Depreciation
(400000*11%) 44,000.00
Profit before tax 83,632.00
Less: Tax @30% 25,089.60
Net Income 58,542.40
Question-3
The free cash flows from operations have been computed for the first year shown in the
statement given below. The free cash flows computation has been done applying indirect method
which involves starting with net income and then making add back adjustments (Jury, 2012)
:
Estimate the free cash flow (Indirect method):
Year-1
Particulars Amount
Profit after tax 58,542.40
3
Document Page
Add: Depreciation (Being non cash
expenditure 44,000.00
Add: Interest (being non operational
item) 9,750.00
Free Cash Flows from operations
112,292.4
0
In order to arrive at the free cash flows from the operations, the depreciation and interest
have been added back to the profit after tax. Depreciation is added because it’s a non cash item
and interest has been added because it’s a non operating expenditure (Jury, 2012).
Question-4
Estimate the free cash flow (Indirect method)
Particulars Year-2 Year-3 Year-4
Profit after tax 68,011.13 77,763.93 87,809.30
Add: Depreciation (Being non cash
expenditure 44,000.00 44,000.00 44,000.00
Add: Interest (being non operational
item) 9,750.00 9,750.00 9,750.00
Free Cash Flows from operations
121,761.1
3
131,513.9
3
141,559.3
0
Due to 3% increase in the number of Pizzas, the sale revenues and variable cost both will
increase. However, the fixed will remain constant. The net increase on the due to increase in
number of Pizzas by 3% has been shown in the table above. Further, while arriving at free cash
flows, the depreciation and interest charge would remain same for all years.
Year-2 Year-3 Year-4
A. EBDITA
150,908.7
6
164,841.3
2
179,191.8
6
4
tabler-icon-diamond-filled.svg

Secure Best Marks with AI Grader

Need help grading? Try our AI Grader for instant feedback on your assignments.
Document Page
B. Capital employed
400,000.0
0
400,000.0
0
400,000.0
0
C. EBDITA % to capital
employed (A/B) 37.73% 41.21% 44.80%
The EBIDTA in year-2, 3, and 4 has been shown in the table given above. It could be
observed that EBIDTA is not less than 33% of $400,000 in any year.
Question-5
The beta of Domino’s Pizza is found to be 1.31. The Beta of Retail Food Group Limited
is 1.45(Reuters, 2018). The simple average of these two betas is worked out to be 1.38 times.
Beta is the measure of relative volatility of the stock to the market overall. The beta value of
more than 1 signifies that the stock is more risky and if beta value is less than 1, it means that the
stock is less risky. The Domino’s as well as Retail Food Group has beta values higher than 1
which means that these stocks are riskier as compared to the market (Baker and English, 2011).
Question-6
The yield on 15 years government bond of Australia is 2.99% (Bloomberg, 2018). This
yield can be used as the proxy for risk free rate of return.
Question-7
The capital asset pricing model (CAPM) is used to compute the required rate of return for
the equity investors. In order to apply the CAPM, the data in relation to risk free rate, beta, and
market risk premium is required to be collected (Baker and English, 2011). In the current case,
the risk free rate of return taking yield on 15 years government bond is 2.99%, the proxy beta is
5
Document Page
1.38, and market risk premium is assumed to be 6.50%. Using this data, the CAPM has been
computed as shown below:
CAPM = Rf + Beta * Risk Premium
= 2.99% + 1.38 * 6.50%
= 11.96%
Thus, the CAPM return for the store is 11.96%. This is the return that the store should
generate for the investors to keep them motivated for investment.
Question-8
The weighted average cost of capital (WACC) signifies the cost incurred by the business
in financing its assets and activities. It is computed with reference to cost of different sources of
capital used such as equity, debt, and preferred capital. The cost of different sources is averaged
applying the weights of different sources in the total capital employed (Brigham and Houston,
2015). In current case, it has been assumed that debt will be 27% and equity will be 73% in the
total capital. The cost of equity will be 11.96% as calculated applying CAPM and that of debt it
will be 6.50%. However, the cost of debt will be taken after tax which is worked out to be 4.55%
[6.50 %*( 1-30%)]. Using these figures, the calculation of WACC is shown below:
WACC = Ke*We + Kd*Wd
= 11.96*73% + 4.55*27%
= 9.96%
6
Document Page
Thus, the weighted average cost of capital is 9.96%.
Question-9
In order to evaluate the viability of the project, net present value technique is used as one
of the prominent measures. For the purpose of computation of net present value, four factors
such as initial outlay, annual cash flows, discount rate, and terminal value are required (Brigham
and Houston, 2015). The calculation of net present value in the current case is shown in the table
given below:
Years
0 1 2 3 4
Cost of franchise (550,000.00)
Cost of PPE (400,000.00)
Annual Cash
inflows 112,292.40 121,761.13 131,513.93 141,559.30
Terminal value 750,000.00
Total (950,000.00) 112,292.40 121,761.13 131,513.93 891,559.30
PVF@9.96% 1.00 0.91 0.83 0.75 0.68
Present Value (950,000.00) 102,121.13 100,702.26 98,916.23 609,833.55
NPV (38,426.83)
The initial investment includes cost of franchise purchased and cost of property plant and
equipment (PPE) purchased. This cost will be incurred at the beginning of the project. Then the
project is expected to generate free cash flows from operations as shown in the table above for
four years. At the end of fourth year, the franchise is expected to be sold for $750,000. The net
7
tabler-icon-diamond-filled.svg

Paraphrase This Document

Need a fresh take? Get an instant paraphrase of this document with our AI Paraphraser
Document Page
present value of the project is estimated to be -$38,426.83 which indicates that the project is not
financial beneficial for the investor.
Question-10
The NPV of the project is -$38,426.83 which signifies that the project is not financial
viability. A project is accepted and considered for implementation if it has positive NPV else the
project is rejected. In the current case, the NPV of the project is negative and based on this it
could be advised to Tien (owner) to reject the project implementation. The positive NPV shows
profitability of the project, on the other hand, a negative NPV indicates that the project will be
incurring losses (Brigham and Houston, 2015).
Question-11
Tien (owner) has been advised to reject the project. The major argument in support of this
advice is the negative NPV of the project. Further, the profitability of the project over the period
of four years is attractive. The project is expected to generate net profit after tax of $58,542.40 in
the first year itself and then it will grow to $87,809.30 at the end of 4th year. But due to negative
NPV it is not recommended for implementation.
Question-12
The consideration of risks is of primary importance in deicide as to whether a project
should be accepted or not. In the current project of Pizza franchise, it has been observed that the
project is financial beneficial but it has certain risks attached to it. First of all, there is intense
competition in the market of fast food, so, the Pizza franchise will have to face threat from the
competitors which may lead to price cut or decrease in the demand. Further, in computing the
8
Document Page
revenues, it has been assumed that there will 3% increase in the number of pizzas sold each year.
However, if the conditions do not favor the franchise, the achievement of this growth in the
number of pizzas could be difficult (Brigham and Houston, 2015).
Apart from the above, there is always the risk of political and regulatory environment.
This means that the franchise is subject to the risk of change in government regulations relating
to franchises. There may be changes in the laws and regulations affecting the franchise
adversely. For instance, the government may revoke license to carry out the business operations.
Further, it may also impose certain taxes or enhance the existing tax rates on the income earned
by the franchise (Brigham and Houston, 2015).
9
Document Page
References
Baker, H.K. and English, P. 2011. Capital Budgeting Valuation: Financial Analysis for Today's
Investment Projects. John Wiley & Sons.
Bloomberg. 2018. Government Bond Yield. [Online]. Available at:
https://www.bloomberg.com/markets/rates-bonds/government-bonds/Australia [Accessed on:
May 16, 2018].
Brigham, E.F. and Houston, J.F. 2015. Fundamentals of Financial Management. Cengage
Learning.
Cafferky, M. 2010. Breakeven Analysis: The Definitive Guide to Cost-Volume-Profit Analysis.
Business Expert Press.
Jury, T. 2012. Cash Flow Analysis and Forecasting: The Definitive Guide to Understanding and
Using Published Cash Flow Data. John Wiley & Sons.
Reuters. 2018. Domino's Pizza Enterprises Ltd (DMP.AX). [Online]. Available at:
https://www.reuters.com/finance/stocks/overview/DMP.AX [Accessed on: May 16, 2018].
Reuters. 2018. Domino's Pizza Enterprises Ltd (DMP.AX). [Online]. Available at:
https://www.reuters.com/finance/stocks/overview/RFG.AX [Accessed on: May 16, 2018].
10
chevron_up_icon
1 out of 10
circle_padding
hide_on_mobile
zoom_out_icon
logo.png

Your All-in-One AI-Powered Toolkit for Academic Success.

Available 24*7 on WhatsApp / Email

[object Object]