Statistical Analysis: Alternative Medicine Usage in Australia - STT100

Verified

Added on  2023/04/03

|9
|1784
|414
Homework Assignment
AI Summary
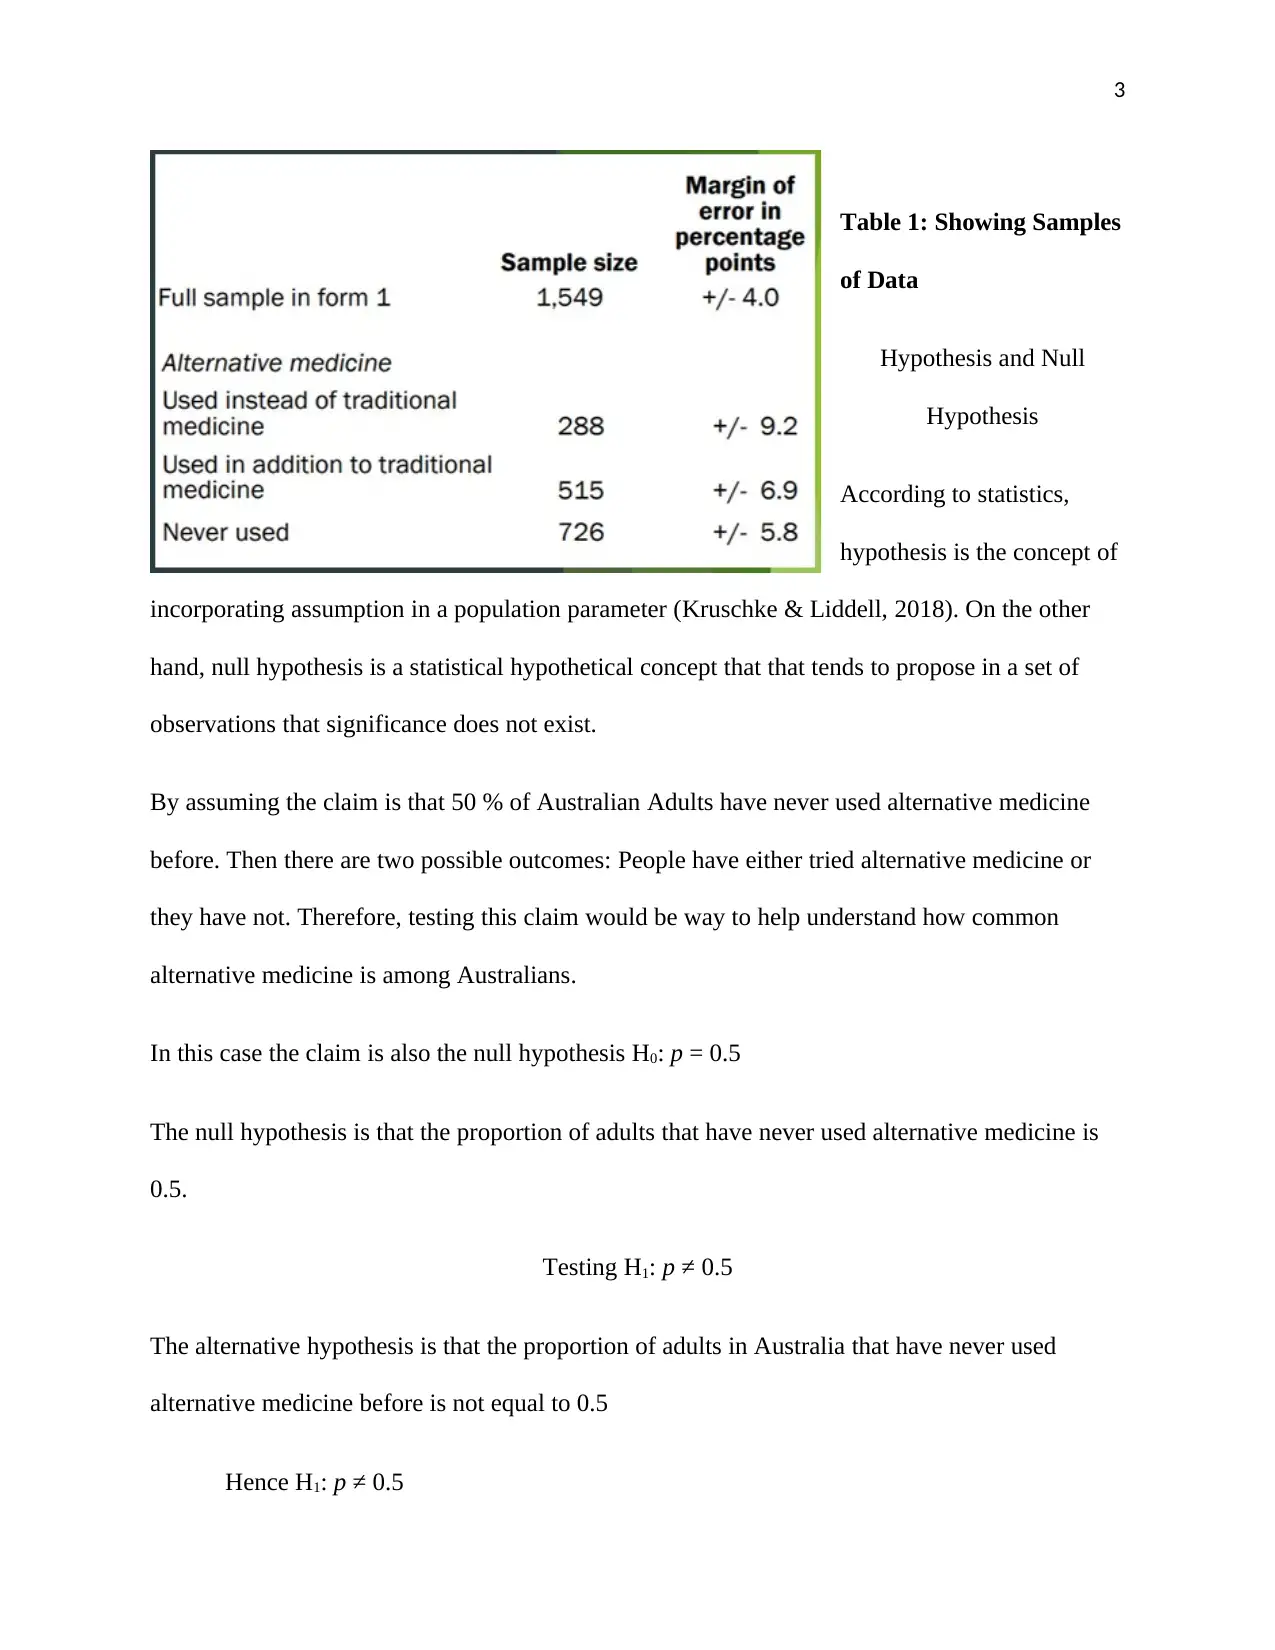
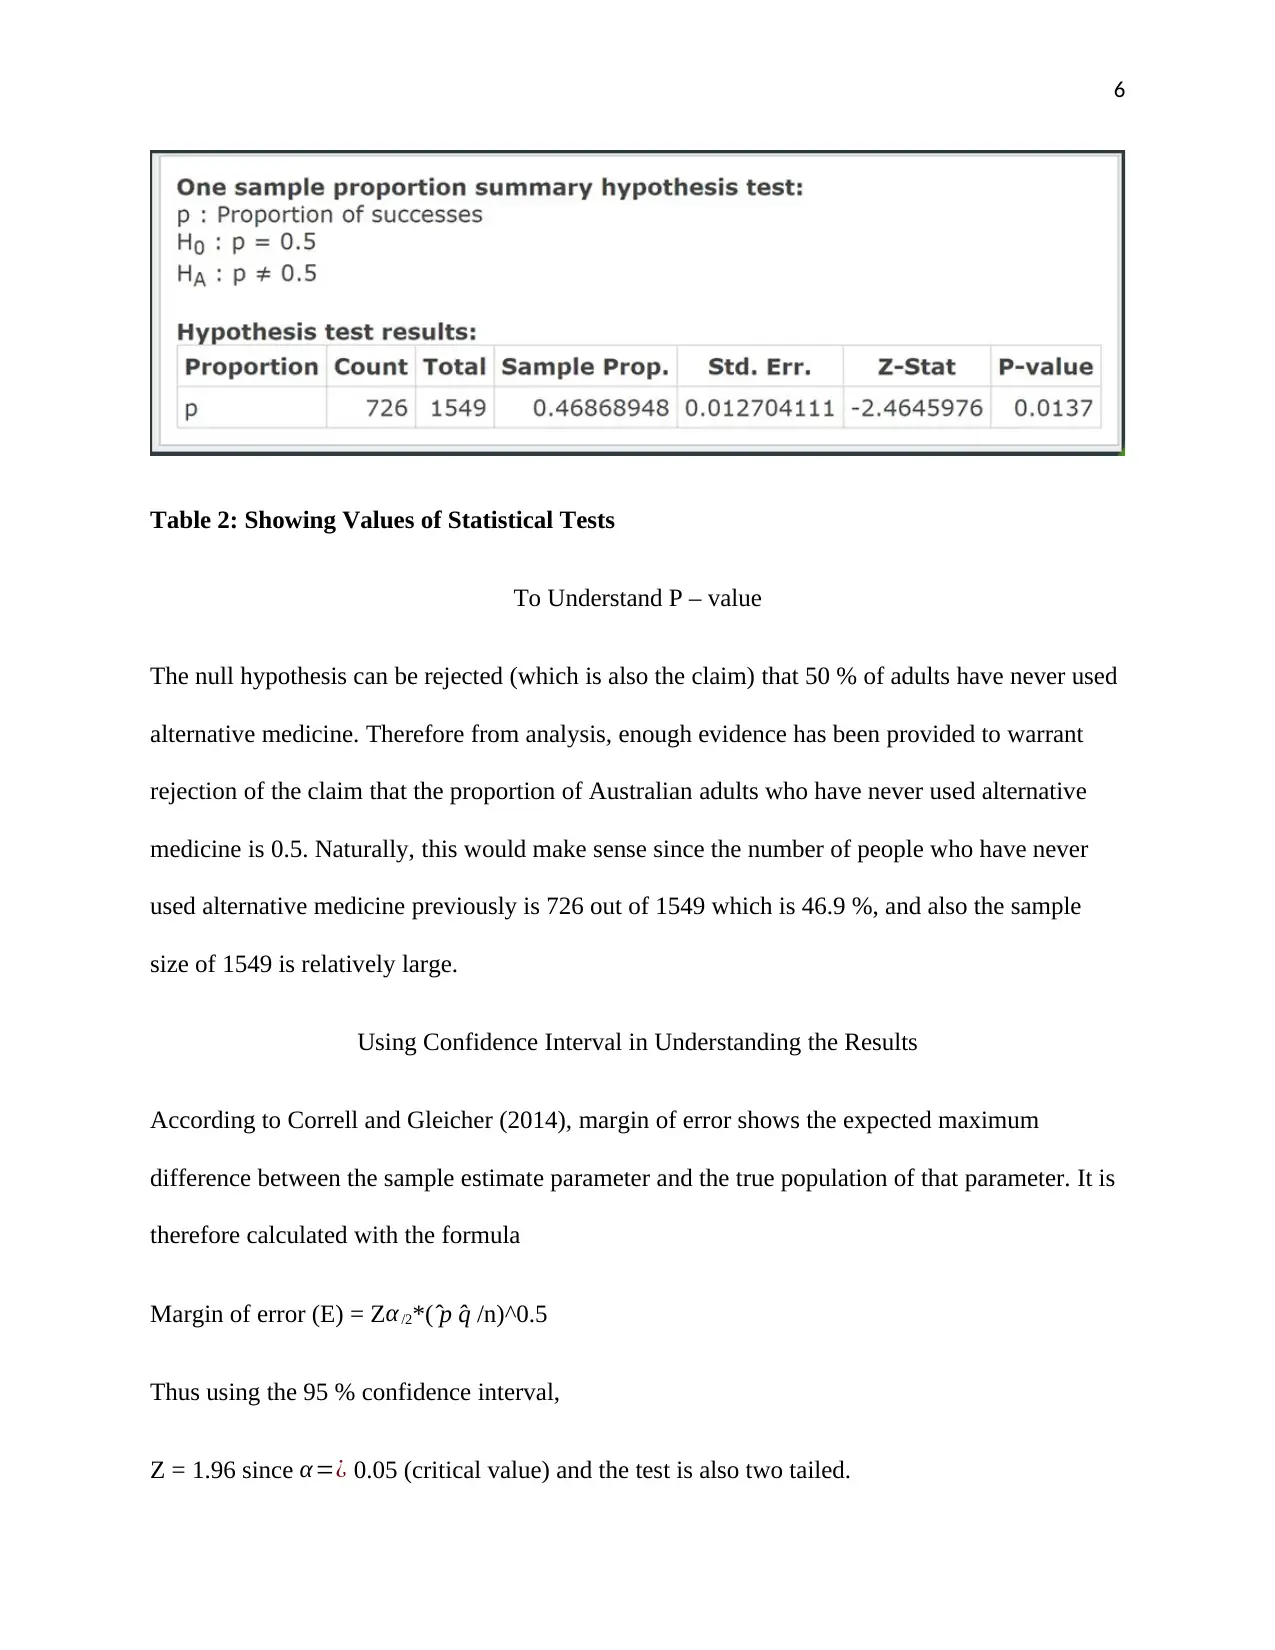
This assignment presents a statistical analysis of alternative medicine usage in Australia, based on data from the Pew Research Center. The study employs hypothesis testing to determine if the proportion of Australians who have never used alternative medicine is equal to 50%. The analysis includes calculating the sample proportion, formulating null and alternative hypotheses, and applying a z-test. The results, a p-value of 0.0137, lead to the rejection of the null hypothesis, suggesting that less than half of Australians have never used alternative medicine. The assignment also includes the calculation of a 95% confidence interval to support the findings and a discussion of potential factors, such as social, economic, and cultural influences, that may affect the use of alternative medicine. The conclusion confirms the widespread use of alternative medicine in Australia.
tabler-icon-diamond-filled.svg

Contribute Materials

Your contribution can guide someone’s learning journey. Share your documents today.
Document Page
1
HAVE MOST PEOPLE USED ALTERNATIVE MEDICINE IN AUSTRALIA
By
Name
Professor’s Name
Course Number
College/University Name
Street
Date
tabler-icon-diamond-filled.svg

Secure Best Marks with AI Grader

Need help grading? Try our AI Grader for instant feedback on your assignments.
Document Page
2
Introduction
The moment people become sick or when in pain, the possible remedies they use are either
alternative medicine or conventional medicine or combining the two. Examples of alternative
medicine comprise acupuncture, herbal medicine and homeopathy (Macdonald & Gavura, 2016).
Moreover, the major concern for patients is to get best treatments as possible and thus would
prefer seeking assistance from healthcare professionals like pharmacists or seek advice from
other sources like family, friends or the internet. Therefore, due to various needs of patients, it is
notable that having various options for treatment would be more beneficial in promoting
wellbeing (Banaszkiewicz, 2014). Moreover, this research is concerned with the statistical test
whether or not the use of alternative medicine is also common in Australia.
Furthermore, it is more potent to provide patients with best medical care to save lives as well as
promoting customers end-to-end experience. In addition, hospitals are often striving for holistic
patients care and majorly depend on conventional medicine in serving patients’ needs
(Hefermehl, 2014). Although conventional medicine is highly regarded among patients, interest
in alternative medicine may also be significant. The data was collected by Pew Research Center
where during the period from May 10, 2016 to June 6, 2016. Additionally, the data was obtained
from a random sample of adults that was representative of Australian Population. The sample
includes 1,549 adults who responded to questions about alternative medicine and other aspects of
health. In addition, analysis has been done using proportion (option 1) method.
Sample proportion = 726/1549 = 0.4687
Document Page
3
Table 1: Showing Samples
of Data
Hypothesis and Null
Hypothesis
According to statistics,
hypothesis is the concept of
incorporating assumption in a population parameter (Kruschke & Liddell, 2018). On the other
hand, null hypothesis is a statistical hypothetical concept that that tends to propose in a set of
observations that significance does not exist.
By assuming the claim is that 50 % of Australian Adults have never used alternative medicine
before. Then there are two possible outcomes: People have either tried alternative medicine or
they have not. Therefore, testing this claim would be way to help understand how common
alternative medicine is among Australians.
In this case the claim is also the null hypothesis H0: p = 0.5
The null hypothesis is that the proportion of adults that have never used alternative medicine is
0.5.
Testing H1: p 0.5
The alternative hypothesis is that the proportion of adults in Australia that have never used
alternative medicine before is not equal to 0.5
Hence H1: p ≠ 0.5
Document Page
4
Requirements
According to the sampling methods, it is worth noting that the requirement of the simple random
sample has been met. Furthermore, there are two categories of outcome including a fixed number
of independent trials as well as the probability of success which is constant, thereby meeting the
binomial distribution conditions. In addition, the values of np and nq are both greater than 5
since there are more than 5 failures and more than 5 successes.
Moreover, from the data, sample proportion can be calculated. Since the parameter involved in
analysis is a population proportion, p, the sampling distribution is thus the normal (z)
distribution. Therefore, this leads to the need of use of z – test. The significance level has then
been assumed to be α = 0.05. Thus the aim is to determine whether or not the population
proportion of adults that have never tried using alternative medicine is equal to 0.5.
Calculating the Value of the Test Statistic z
To calculate the value of z, the following formula is used.
z = ( ̂̂ p – p)/(pq/n)^(0.5) ̂̂̂
p = 726/1549, where p = 0.5, q = 0.5 and n = 1549
Thus z = -2.465
Thus since the alternative hypothesis is found as H1: p 0.5, the test involved is a two – tailed
test. Therefore, the p-value is two times the area of the region to the left of the test statistic z.
Moreover, according to Liublinska & Rubin (2014), alternative hypothesis that is two – sided is
tabler-icon-diamond-filled.svg

Secure Best Marks with AI Grader

Need help grading? Try our AI Grader for instant feedback on your assignments.
Document Page
5
used if there is absence of reason for believing that the sample mean can be lower than or higher
than the value given. Thus researchers mostly hypothesize the significance difference of the
values. Furthermore, the sample mean may be lower or higher than the value given, thus
researchers need to determine both extremely low and high values. Additionally, this means that
the value alpha must be located at the ends of a curve. At the lower end, half the value of alpha is
located as well as the higher end where another half of the alpha value is located (Liublinska &
Rubin 2014). Therefore from such operations, both high cutoff and low cutoff values are
obtained.
Thus the area to the left of z = -2.465 is approximately 0.00685 according to table A-2
Therefore, 2 x 0.00685 = 0.0237
Thus p – value = 0.0137
The p – Value Interpretation
The p – value = 0.0137
It is notable that the p – value is less that the significance level of α = 0.05. Thus the null
hypothesis is rejected (H0: p = 0.5), since the p – value is less than the alpha hence the alternative
hypothesis is accepted. Moreover, statistical researches argue that when a statistical test for
hypothesis is conducted, when p – value is found to be greater than the alpha then null
hypothesis is accepted with rejection of alternative hypothesis whereas when the p – value is
found to be less than the alpha value then null hypothesis is rejected and alternative hypothesis
accepted (Lockhart etal., 2014)
Document Page
6
Table 2: Showing Values of Statistical Tests
To Understand P – value
The null hypothesis can be rejected (which is also the claim) that 50 % of adults have never used
alternative medicine. Therefore from analysis, enough evidence has been provided to warrant
rejection of the claim that the proportion of Australian adults who have never used alternative
medicine is 0.5. Naturally, this would make sense since the number of people who have never
used alternative medicine previously is 726 out of 1549 which is 46.9 %, and also the sample
size of 1549 is relatively large.
Using Confidence Interval in Understanding the Results
According to Correll and Gleicher (2014), margin of error shows the expected maximum
difference between the sample estimate parameter and the true population of that parameter. It is
therefore calculated with the formula
Margin of error (E) = Z α/2*( ̂ p ̂ q /n)^0.5
Thus using the 95 % confidence interval,
Z = 1.96 since α =¿ 0.05 (critical value) and the test is also two tailed.
Document Page
7
Therefore, E = 1.96 ( 0.4687 x 0.5313
1549 )0.5
Thus, E = 0.02485
Also, given that p = 0.4687, then the confidence level is
0.444 < p < 0.494
Therefore, there is 95 % confidence that the interval contains the actual population proportion.
Moreover, since the claim value of 0.5 is not contained within the interval, there is enough
evidence to reject the claim that 50 % of adults have never tried using alternative medicine. It is
worth noting that the same conclusion is reached when p – value method is used. On the other
hand, the type I error was based on the Alpha = 0.05, hence the null hypothesis which was a true
false was rejected (Lando & Mungan, 2018). The type II error was absent since alternative
hypothesis was accepted.
Besides, the difference between the sample estimate and the calculated value is brought by other
factors as well. These factors include social, economic and cultural factors. To begin with,
according to heath research it is notable that social aspects of life like level of education
influence the choice of people on medicine to use while sick. Most people who have high level
of education would prefer conventional medicine while those with lower level of education
would prefer alternative medicine.
On the other hand, economic part of life also has a greater influence. For instance, people who
have low income as well as those that are unemployed tend to use cheaper means of
medication. Even though most people are under Medicare card, but some treatments are
not covered with the service. Thus most of the people with low income tend to use
tabler-icon-diamond-filled.svg

Paraphrase This Document

Need a fresh take? Get an instant paraphrase of this document with our AI Paraphraser
Document Page
8
alternative medication which is cheaper compared to conventional medication. In
addition, cultural issues affect the people’s choice on medication. Moreover, According
to healthcare research, most people view some diseases to be best treated through cultural
means. Religious beliefs hold a strong effect in regard to this. There
Conclusion
In conclusion, analysis of the data from Pew Research Center has shown how common the use of
alternative medicine is among the people of Australia. Furthermore, given that the sample size of
1549 represents the larger population in Australia, less than half of Australians have never used
some types of alternative medicine. Conversely, according to results from the poll, of Australian
population, 51.8% have tried using alternative medicine. In addition, the use of alternative
medicine could have been attributed to due to fact that some alternative medicines may cost
cheaper than conventional medical treatment however, the effectiveness of some alternative
techniques may be fully in doubt hence the placebo would execute a role.
References
Macdonald, C. and Gavura, S., 2016. Alternative medicine and the ethics of
commerce. Bioethics, 30(2), pp.77-84. doi.org/10.1111/bioe.12226
Document Page
9
Banaszkiewicz, P.A., 2014. Traumatic arthritis of the hip after dislocation and acetabular
fractures: treatment by mold arthroplasty: an end-result study using a new method of result
evaluation. In Classic Papers in Orthopaedics (pp. 13-17). Springer, London.
doi.org/10.1007/978-1-4471-5451-8_3
Hefermehl, L.J., Largo, R.A., Hermanns, T., Poyet, C., Sulser, T. and Eberli, D., 2014. Lateral
temperature spread of monopolar, bipolar and ultrasonic instruments for robotassisted
laparoscopic surgery. BJU international, 114(2), pp.245-252. doi.org/10.1111/bju.12498
Kruschke, J.K. and Liddell, T.M., 2018. The Bayesian New Statistics: Hypothesis testing,
estimation, meta-analysis, and power analysis from a Bayesian perspective. Psychonomic
Bulletin & Review, 25(1), pp.178-206. doi.org/10.3758/s13423-016-1221-4
Liublinska, V. and Rubin, D.B., 2014. Sensitivity analysis for a partially missing binary outcome
in a twoarm randomized clinical trial. Statistics in medicine, 33(24), pp.4170-4185.
doi.org/10.1002/sim.6197
Lockhart, R., Taylor, J., Tibshirani, R.J. and Tibshirani, R., 2014. A significance test for the
lasso. Annals of statistics, 42(2), p.413. doi: 10.1214/13-AOS1175
Correll, M. and Gleicher, M., 2014. Error bars considered harmful: Exploring alternate
encodings for mean and error. IEEE transactions on visualization and computer
graphics, 20(12), pp.2142-2151.
doi: 10.1109/TVCG.2014.2346298
Lando, H. and Mungan, M.C., 2018. The effect of type-1 error on deterrence. International
review of law and economics, 53, pp.1-8. /doi.org/10.1016/j.irle.2017.08.001
chevron_up_icon
1 out of 9
circle_padding
hide_on_mobile
zoom_out_icon
logo.png

Your All-in-One AI-Powered Toolkit for Academic Success.

Available 24*7 on WhatsApp / Email

[object Object]